| Param | Original file | Final file |
|---|---|---|
| Filename | modeM0/AS1T05_186T01_9000006130_45846cztM0_level2.fits | modeM0/AS1T05_186T01_9000006130_45846cztM0_level2_quad_clean.evt |
| Size (bytes) | 771,966,720 | 100,690,560 |
| Size | 736.2 MB | 96.0 MB |
| Events in quadrant A | 8,859,988 | 666,073 |
| Events in quadrant B | 9,424,456 | 572,277 |
| Events in quadrant C | 3,073,322 | 734,044 |
| Events in quadrant D | 6,680,136 | 591,228 |
| Mode M0 | |||
|---|---|---|---|
| Quadrant | BADHDUFLAG | Total packets | Discarded packets |
| A | 0 | 30967 | 2 |
| B | 0 | 32753 | 2 |
| C | 0 | 14237 | 2 |
| D | 0 | 24726 | 2 |
| Mode M9 | |||
|---|---|---|---|
| Quadrant | BADHDUFLAG | Total packets | Discarded packets |
| A | 0 | 16 | 0 |
| B | 0 | 16 | 0 |
| C | 0 | 16 | 0 |
| D | 0 | 16 | 0 |
| Mode SS | |||
|---|---|---|---|
| Quadrant | BADHDUFLAG | Total packets | Discarded packets |
| A | 0 | 142 | 0 |
| B | 0 | 142 | 0 |
| C | 0 | 142 | 0 |
| D | 0 | 142 | 0 |
| Quadrant | Total seconds | Saturated seconds | Saturation percentage |
|---|---|---|---|
| A | 6959 | 853 | 12.257508% |
| B | 6959 | 2016 | 28.969680% |
| C | 6959 | 25 | 0.359247% |
| D | 6960 | 965 | 13.864943% |
Noise dominated data is calculated using 1-second bins in cleaned event files. If a bin has >2000 counts, and if more than 50% of those come from <1% of pixels, then it is considered to be noise-dominated and hence unusable.
| Quadrant | # 1 sec bins | Bins with >0 counts | Bins with >2000 counts | High rate bins dominated by noise | Noise dominated (total time) | Noise dominated (detector-on time) | Marked lightcurve |
|---|---|---|---|---|---|---|---|
| A | 8564 | 6961 | 925 | 925 | 10.80% | 13.29% | 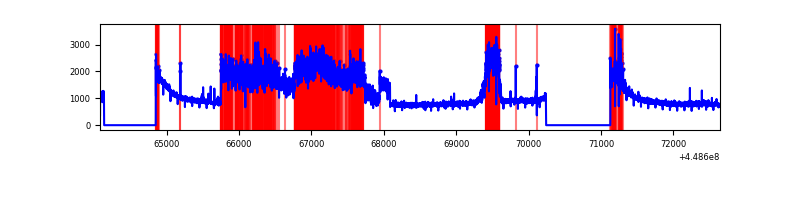 |
| B | 8564 | 6961 | 1417 | 1417 | 16.55% | 20.36% | 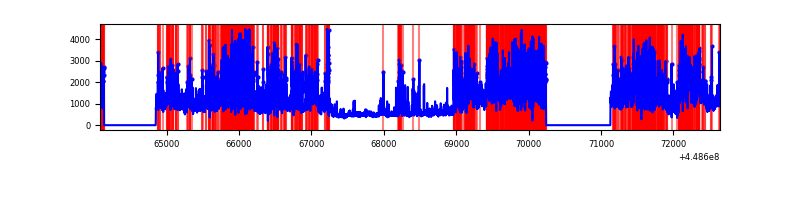 |
| C | 8564 | 6961 | 8 | 8 | 0.09% | 0.11% | 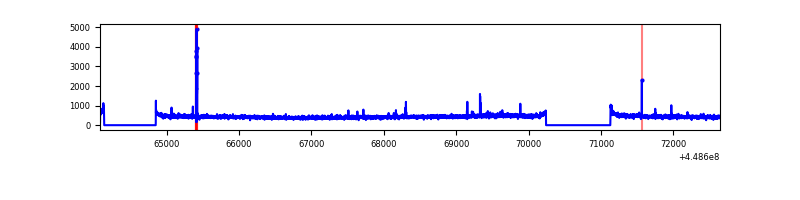 |
| D | 8565 | 6961 | 746 | 746 | 8.71% | 10.72% | 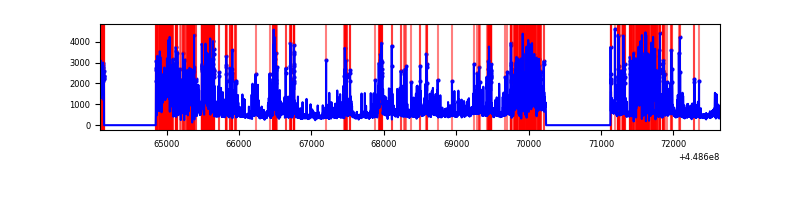 |
Top three noisy pixels from each quadrant. If the there are fewer than three noisy pixels in the level2.evt file, extra rows are filled as -1
| Pixel properties | Quadrant properties | ||||||
|---|---|---|---|---|---|---|---|
| Quadrant | DetID | PixID | Counts | Sigma | Mean | Median | Sigma |
| A | 10 | 83 | 2950171 | 18853.46 | 747 | 731 | 156.4 |
| A | 15 | 14 | 1710363 | 10928.34 | 747 | 731 | 156.4 |
| A | 0 | 247 | 1123535 | 7177.21 | 747 | 731 | 156.4 |
| B | 3 | 112 | 6204608 | 45911.76 | 682 | 661 | 135.1 |
| B | 0 | 189 | 174751 | 1288.34 | 682 | 661 | 135.1 |
| B | 4 | 171 | 135661 | 999.06 | 682 | 661 | 135.1 |
| C | 12 | 2 | 42913 | 230.75 | 768 | 771 | 182.6 |
| C | 12 | 249 | 21076 | 111.18 | 768 | 771 | 182.6 |
| C | 3 | 233 | 15346 | 79.81 | 768 | 771 | 182.6 |
| D | 13 | 249 | 2104674 | 11571.05 | 710 | 686 | 181.8 |
| D | 1 | 52 | 824876 | 4532.7 | 710 | 686 | 181.8 |
| D | 2 | 249 | 306400 | 1681.3 | 710 | 686 | 181.8 |
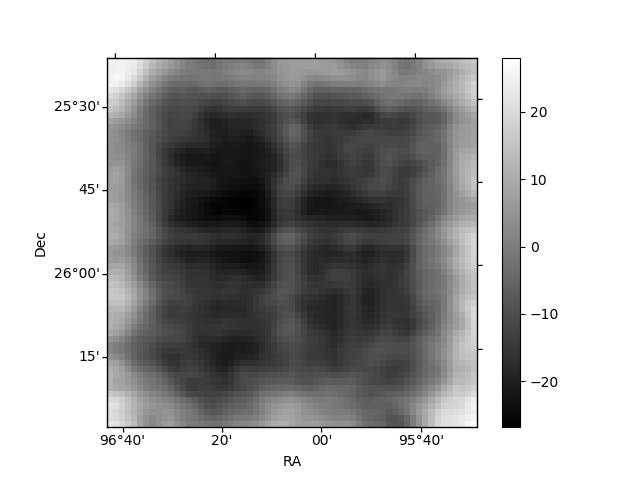
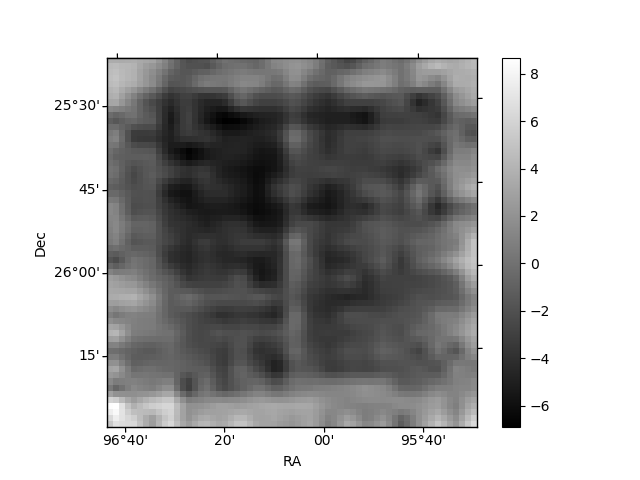
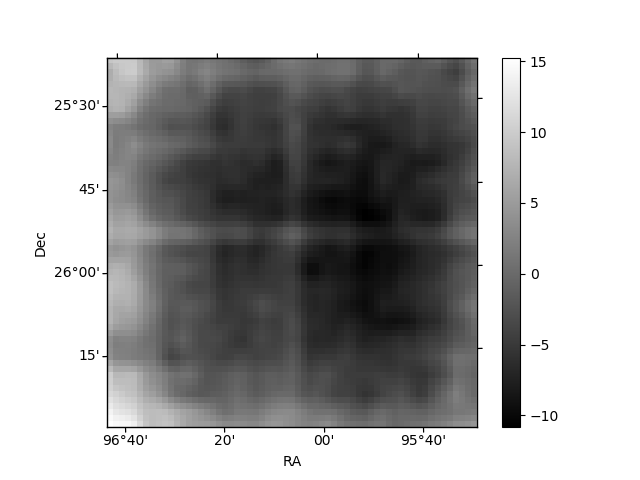
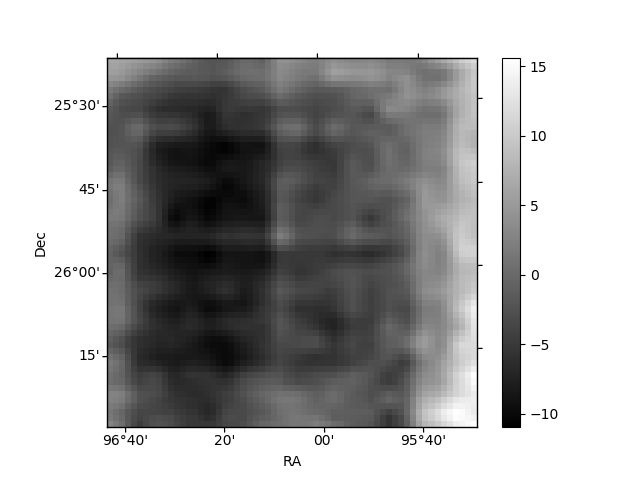
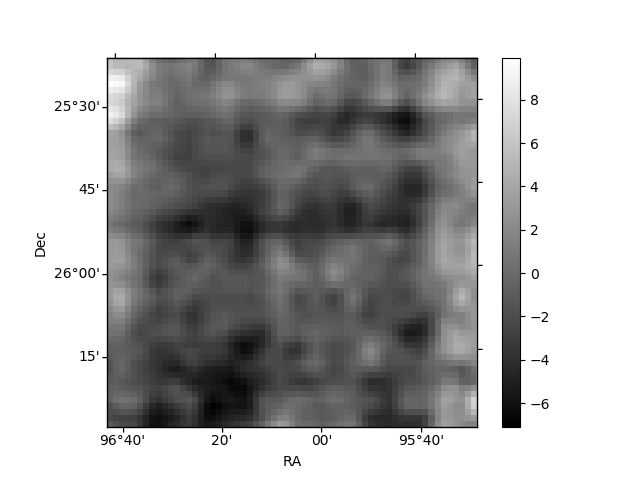
Histogram calculated using DETX and DETY for each event in the final _common_clean file
| Quadrant A | 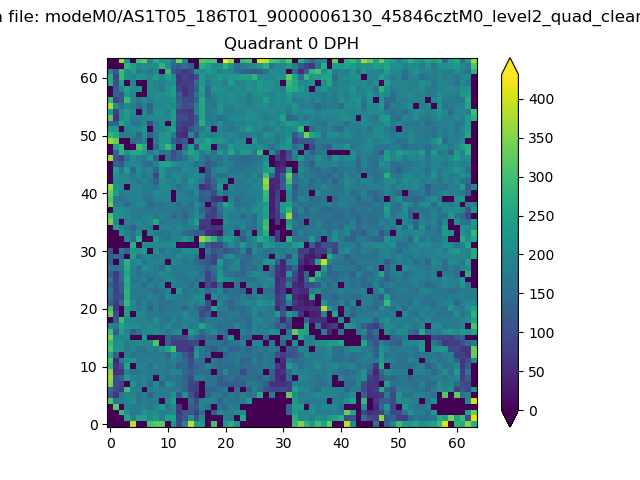 |
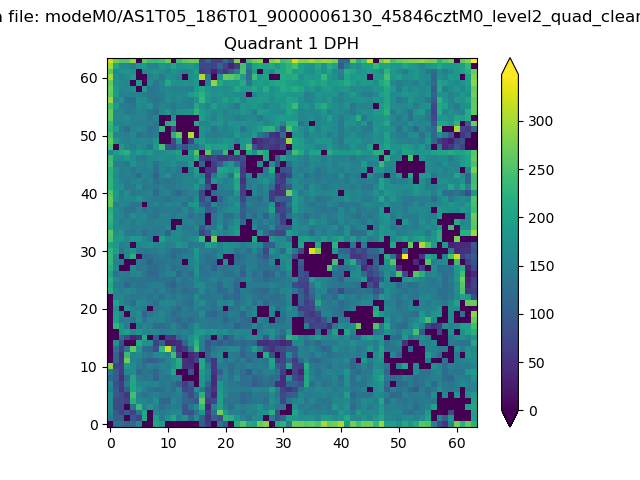 |
Quadrant B |
|---|---|---|---|
| Quadrant D | 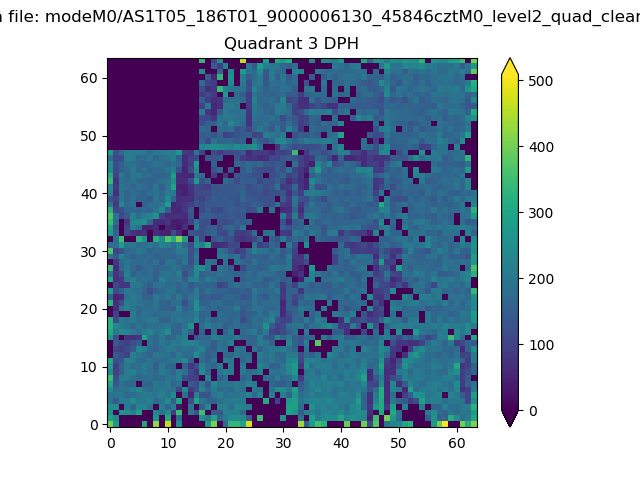 |
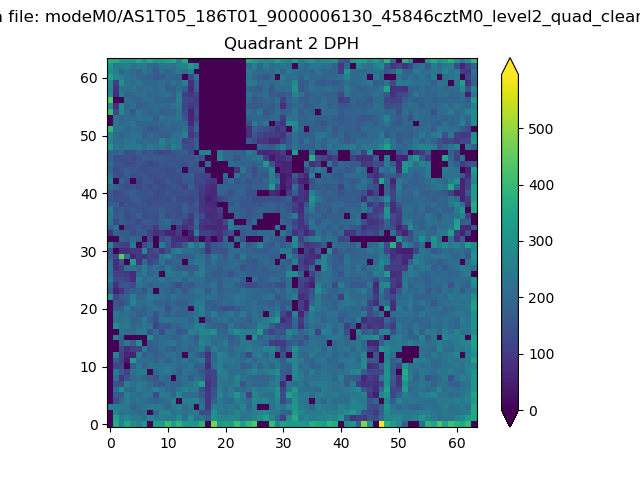 |
Quadrant C |
| Plot type | Count rate plots | Images |
|---|---|---|
| Comparison with Poisson distribution Blue bars denote a histogram of data divided into 1 sec bins. Red curve is a Poisson curve with rate = median count rate of data. |
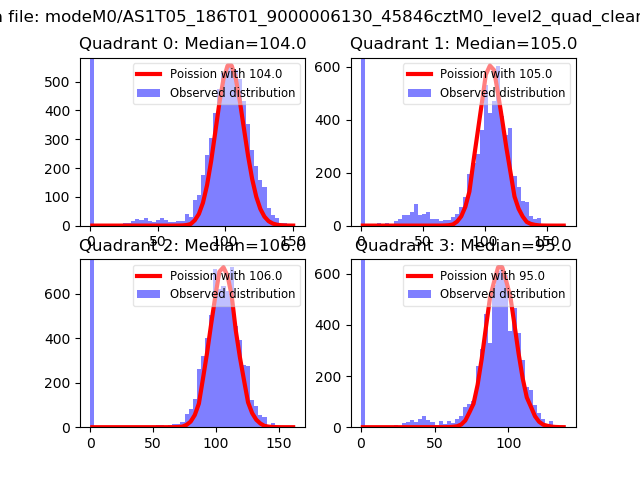 |
 |
| Quadrant-wise count rates Data is divided into 100 sec bins |
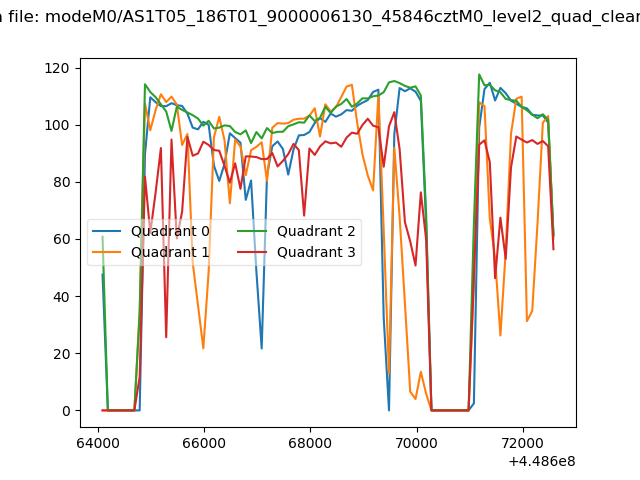 |
|
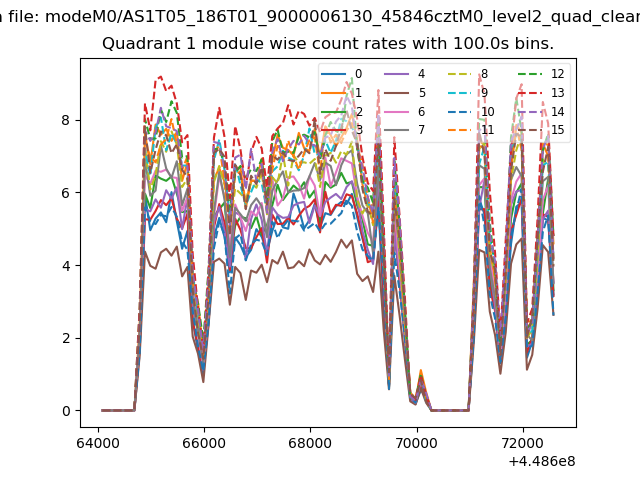
| Module-wise count rates for Quadrant A Data is divided into 100 sec bins |
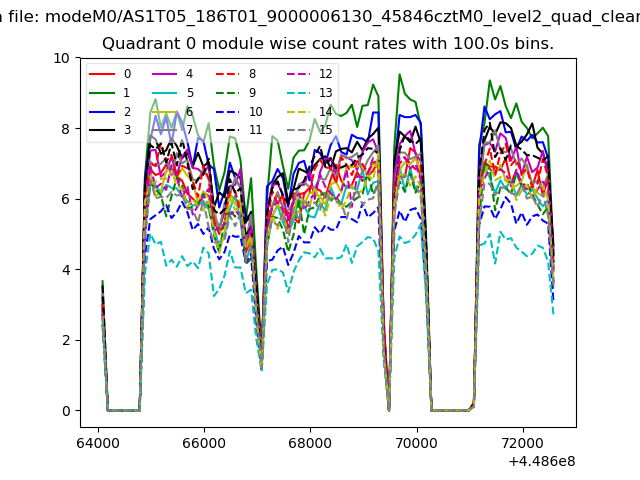 |
 |
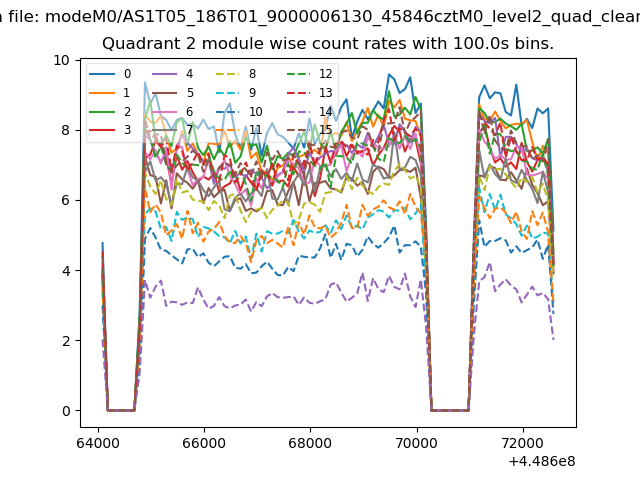
| Module-wise count rates for Quadrant B Data is divided into 100 sec bins |
 |
 |
| Module-wise count rates for Quadrant C Data is divided into 100 sec bins |
 |
 |
| Module-wise count rates for Quadrant D Data is divided into 100 sec bins |
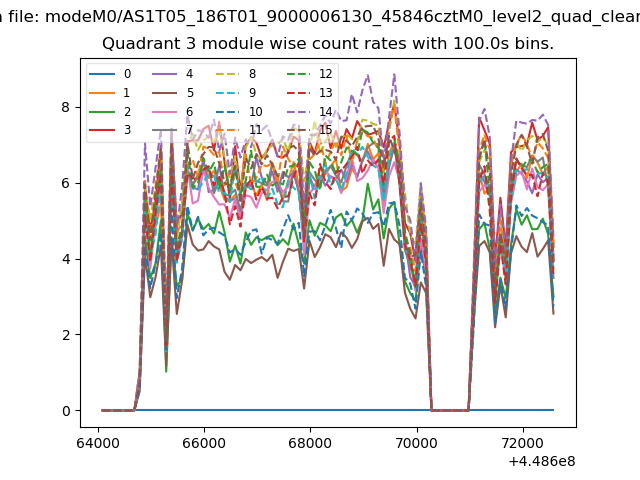 |
 |
| Parameter | Plot |
|---|---|
| CZT HV Monitor | 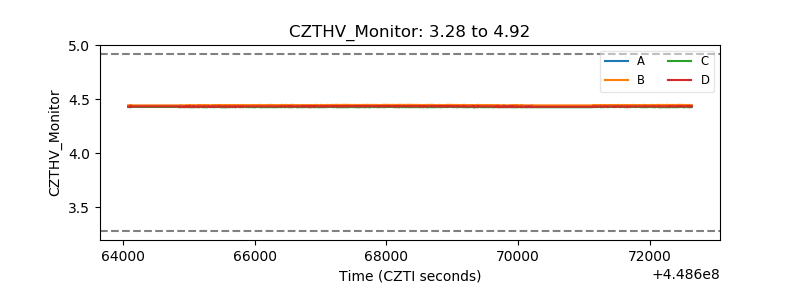 |
| D_VDD | 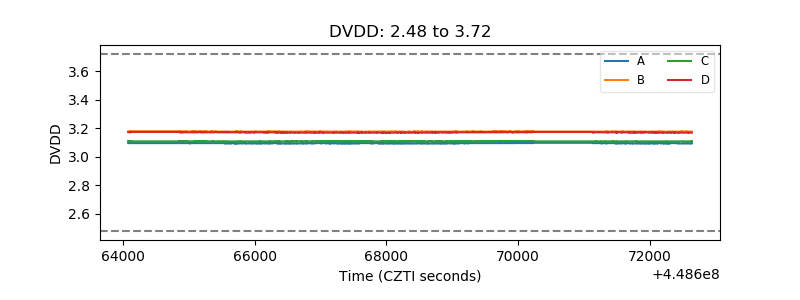 |
| Temperature 1 | 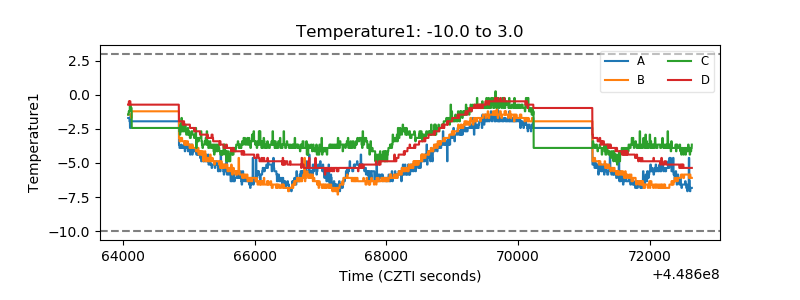 |
| Veto HV Monitor | 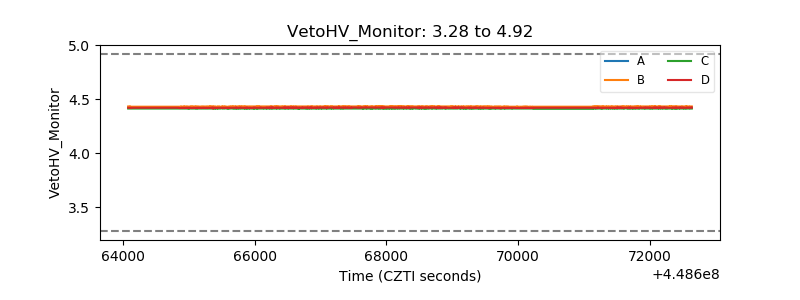 |
| Veto LLD | 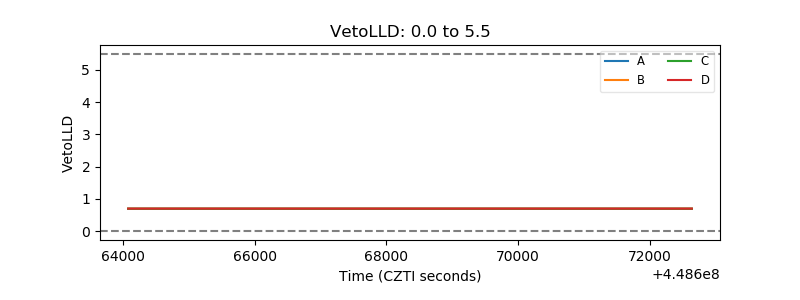 |
| Alpha Counter | 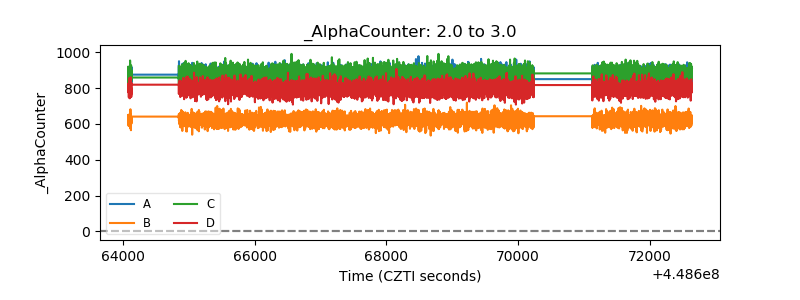 |
| _CPM_Rate | 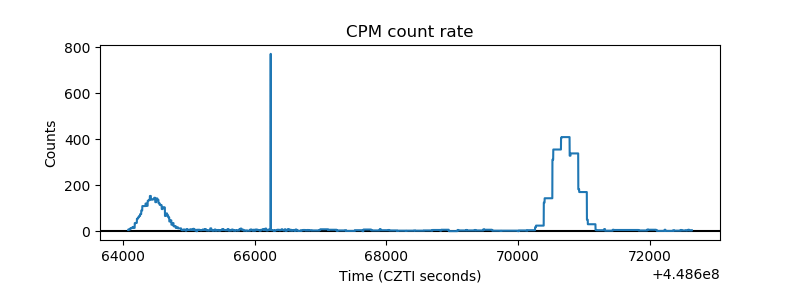 |
| CZT Counter | 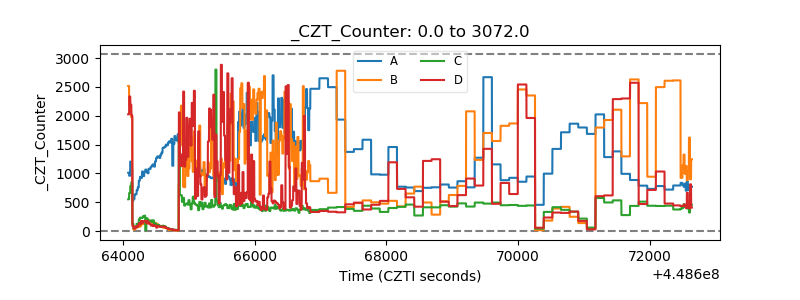 |
| +2.5 Volts monitor | 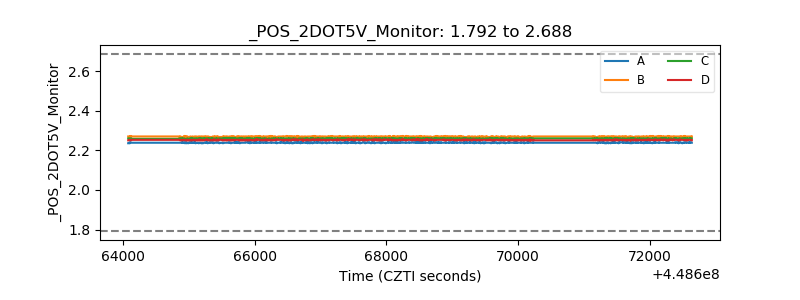 |
| +5 Volts monitor | 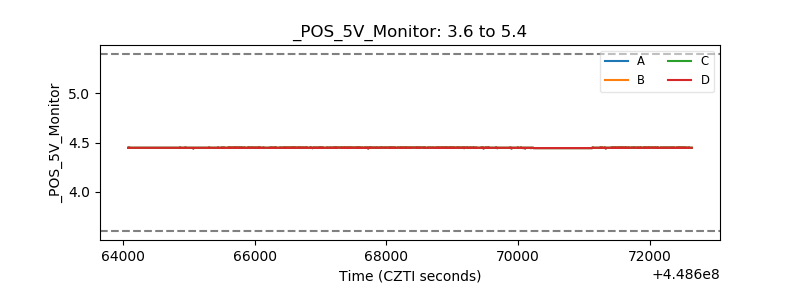 |
| _ROLL_ROT | 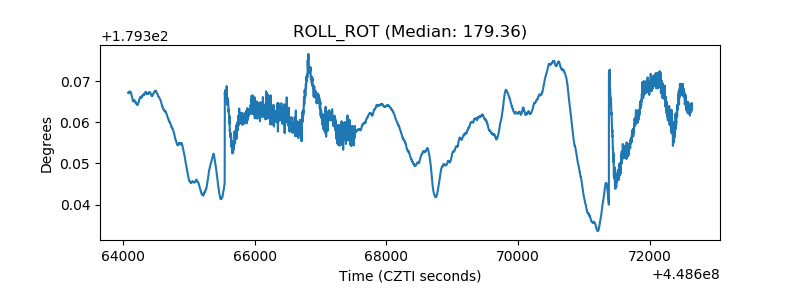 |
| _Roll_DEC | 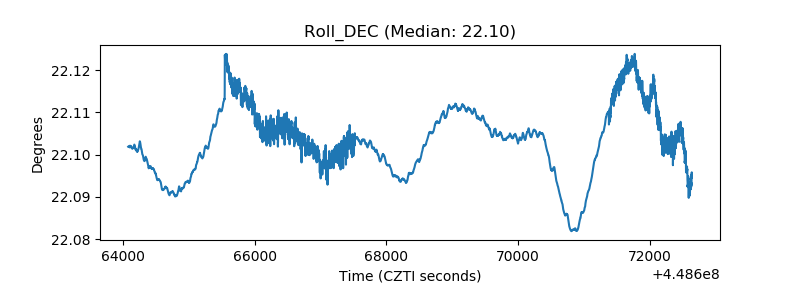 |
| _Roll_RA | 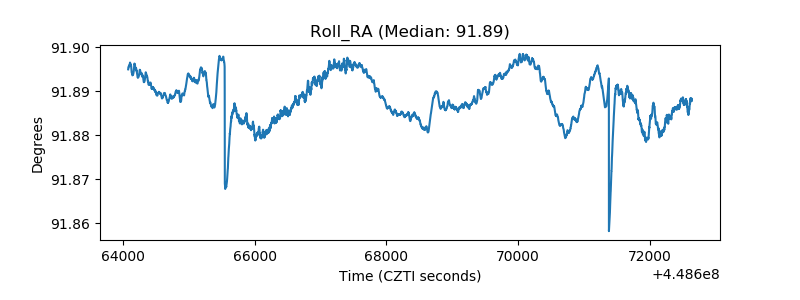 |
| Veto Counter | 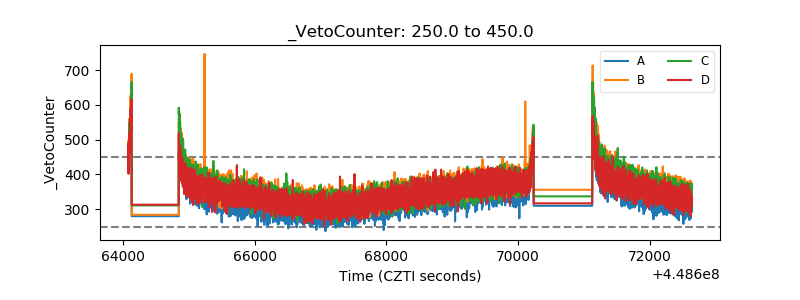 |