| Param | Original file | Final file |
|---|---|---|
| Filename | modeM0/AS1T05_186T01_9000006130_45848cztM0_level2.fits | modeM0/AS1T05_186T01_9000006130_45848cztM0_level2_quad_clean.evt |
| Size (bytes) | 667,054,080 | 105,134,400 |
| Size | 636.2 MB | 100.3 MB |
| Events in quadrant A | 6,439,142 | 714,385 |
| Events in quadrant B | 8,847,930 | 619,515 |
| Events in quadrant C | 3,138,636 | 748,626 |
| Events in quadrant D | 5,731,763 | 619,247 |
| Mode M0 | |||
|---|---|---|---|
| Quadrant | BADHDUFLAG | Total packets | Discarded packets |
| A | 0 | 23883 | 2 |
| B | 0 | 31136 | 2 |
| C | 0 | 14294 | 2 |
| D | 0 | 22033 | 2 |
| Mode M9 | |||
|---|---|---|---|
| Quadrant | BADHDUFLAG | Total packets | Discarded packets |
| A | 0 | 19 | 0 |
| B | 0 | 19 | 0 |
| C | 0 | 19 | 0 |
| D | 0 | 19 | 0 |
| Mode SS | |||
|---|---|---|---|
| Quadrant | BADHDUFLAG | Total packets | Discarded packets |
| A | 0 | 142 | 0 |
| B | 0 | 142 | 0 |
| C | 0 | 142 | 0 |
| D | 0 | 142 | 0 |
| Quadrant | Total seconds | Saturated seconds | Saturation percentage |
|---|---|---|---|
| A | 6907 | 371 | 5.371362% |
| B | 6907 | 1630 | 23.599247% |
| C | 6908 | 16 | 0.231616% |
| D | 6908 | 678 | 9.814708% |
Noise dominated data is calculated using 1-second bins in cleaned event files. If a bin has >2000 counts, and if more than 50% of those come from <1% of pixels, then it is considered to be noise-dominated and hence unusable.
| Quadrant | # 1 sec bins | Bins with >0 counts | Bins with >2000 counts | High rate bins dominated by noise | Noise dominated (total time) | Noise dominated (detector-on time) | Marked lightcurve |
|---|---|---|---|---|---|---|---|
| A | 8847 | 6909 | 197 | 197 | 2.23% | 2.85% | 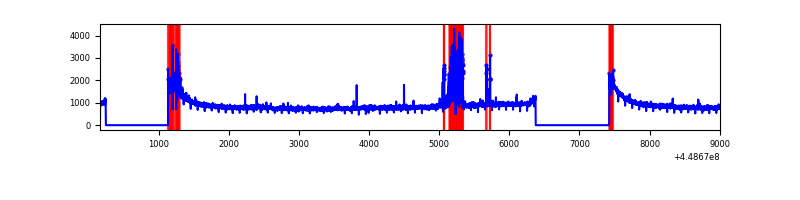 |
| B | 8847 | 6909 | 1096 | 1096 | 12.39% | 15.86% | 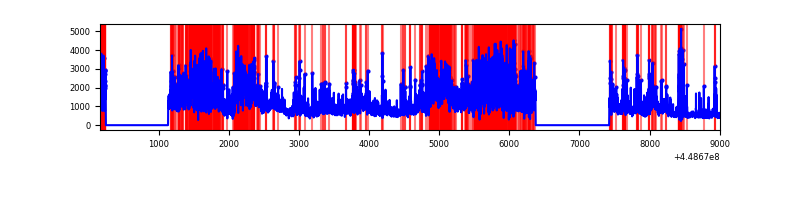 |
| C | 8848 | 6910 | 10 | 10 | 0.11% | 0.14% | 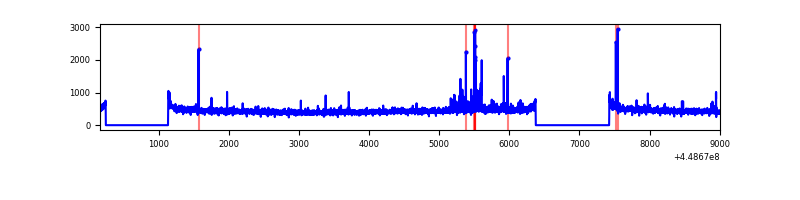 |
| D | 8848 | 6910 | 542 | 542 | 6.13% | 7.84% | 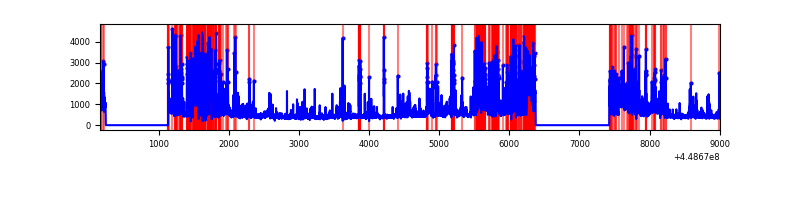 |
Top three noisy pixels from each quadrant. If the there are fewer than three noisy pixels in the level2.evt file, extra rows are filled as -1
| Pixel properties | Quadrant properties | ||||||
|---|---|---|---|---|---|---|---|
| Quadrant | DetID | PixID | Counts | Sigma | Mean | Median | Sigma |
| A | 10 | 83 | 3013461 | 18981.7 | 761 | 746 | 158.7 |
| A | 0 | 247 | 360017 | 2263.6 | 761 | 746 | 158.7 |
| A | 13 | 248 | 39932 | 246.89 | 761 | 746 | 158.7 |
| B | 3 | 112 | 5360319 | 38133.73 | 711 | 689 | 140.5 |
| B | 0 | 189 | 200835 | 1424.04 | 711 | 689 | 140.5 |
| B | 0 | 171 | 167362 | 1185.88 | 711 | 689 | 140.5 |
| C | 0 | 207 | 54672 | 294.07 | 771 | 778 | 183.3 |
| C | 12 | 249 | 39533 | 211.46 | 771 | 778 | 183.3 |
| C | 12 | 2 | 20056 | 105.19 | 771 | 778 | 183.3 |
| D | 13 | 249 | 1629305 | 8814.88 | 729 | 705 | 184.8 |
| D | 2 | 249 | 329167 | 1777.82 | 729 | 705 | 184.8 |
| D | 6 | 143 | 295720 | 1596.78 | 729 | 705 | 184.8 |
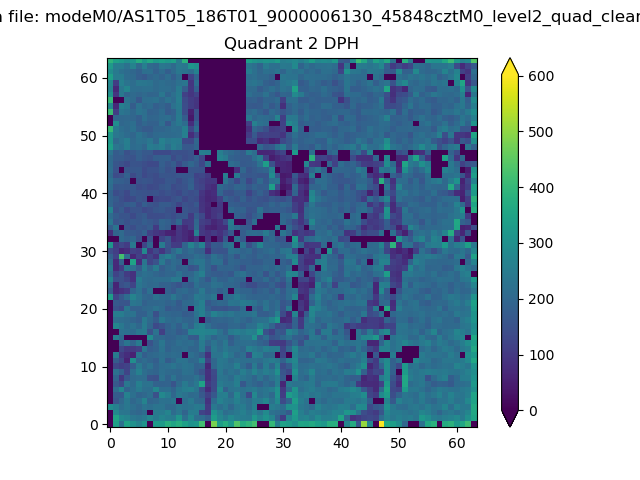
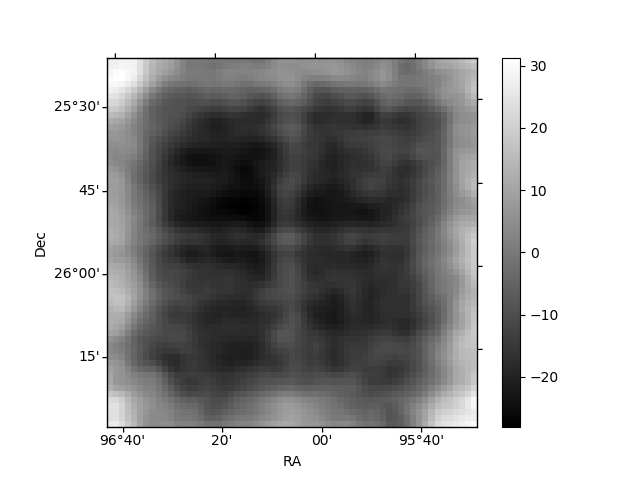
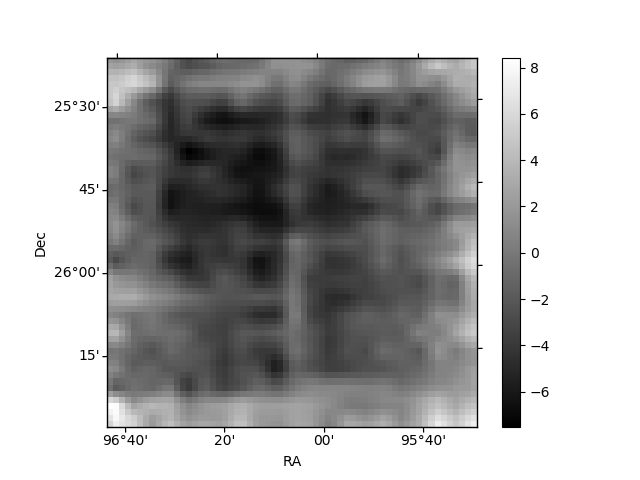
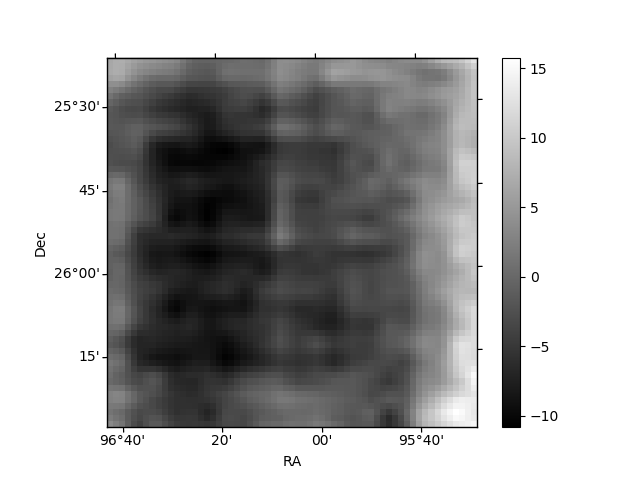
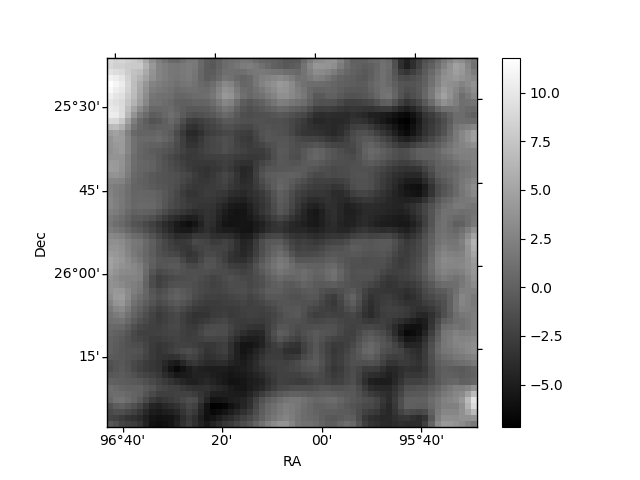
Histogram calculated using DETX and DETY for each event in the final _common_clean file
| Quadrant A | 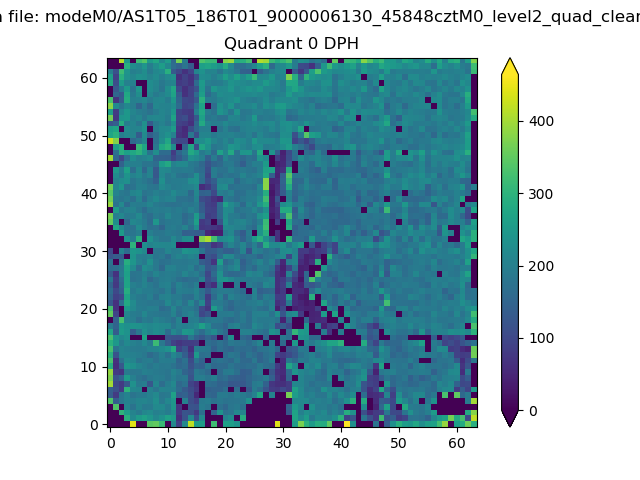 |
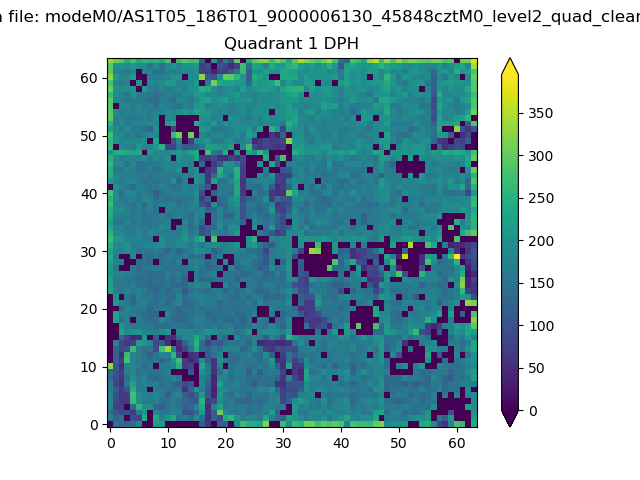 |
Quadrant B |
|---|---|---|---|
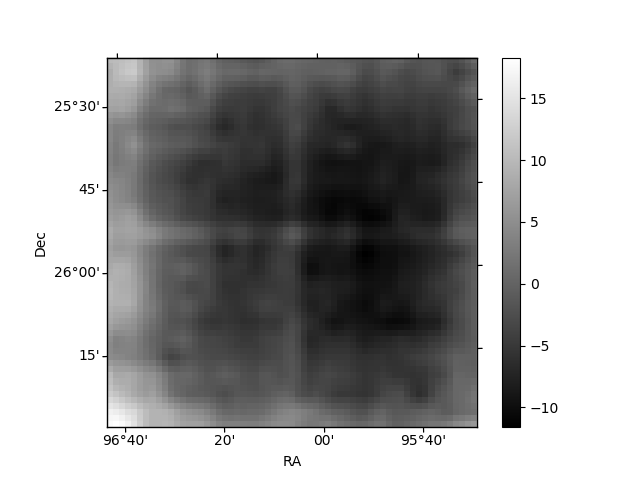
| Quadrant D | 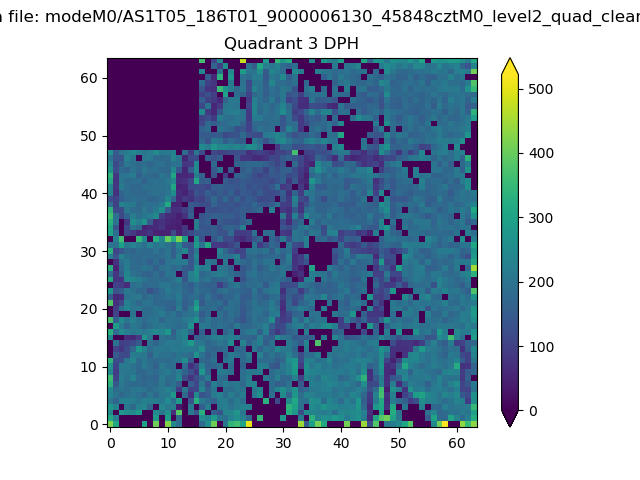 |
 |
Quadrant C |
| Plot type | Count rate plots | Images |
|---|---|---|
| Comparison with Poisson distribution Blue bars denote a histogram of data divided into 1 sec bins. Red curve is a Poisson curve with rate = median count rate of data. |
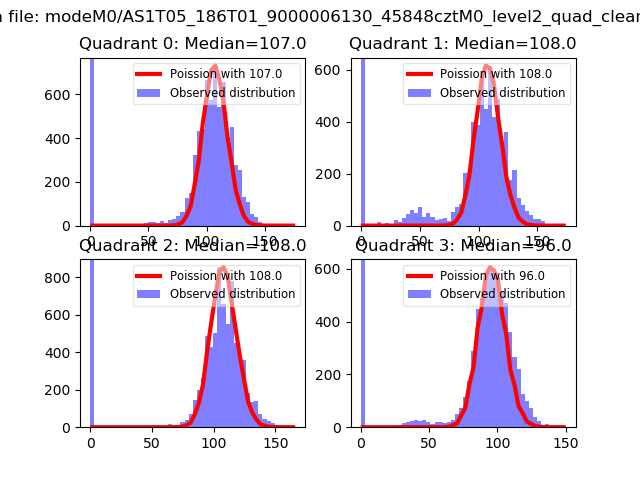 |
 |
| Quadrant-wise count rates Data is divided into 100 sec bins |
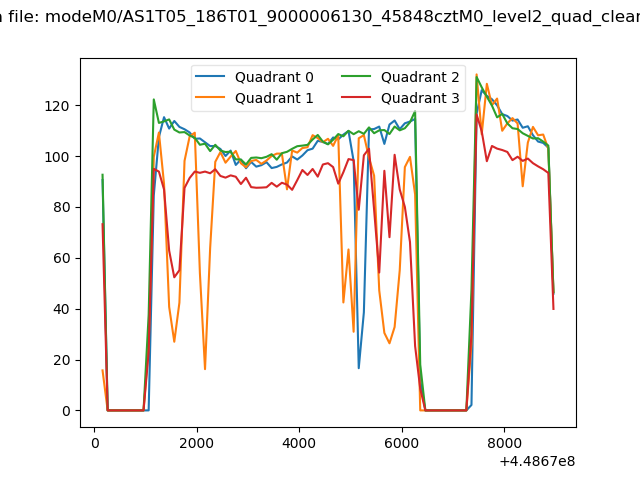 |
|
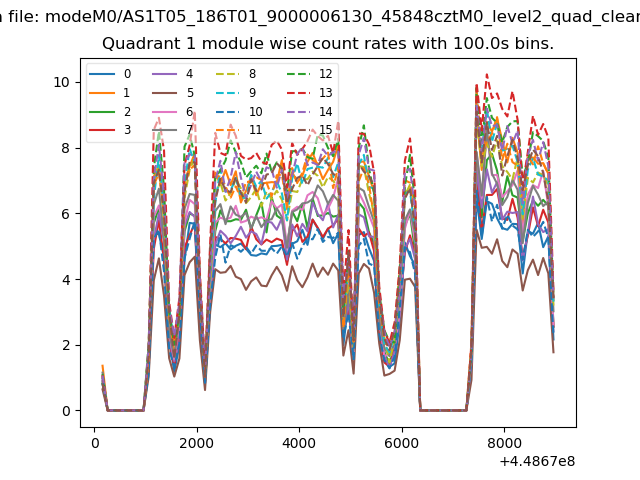
| Module-wise count rates for Quadrant A Data is divided into 100 sec bins |
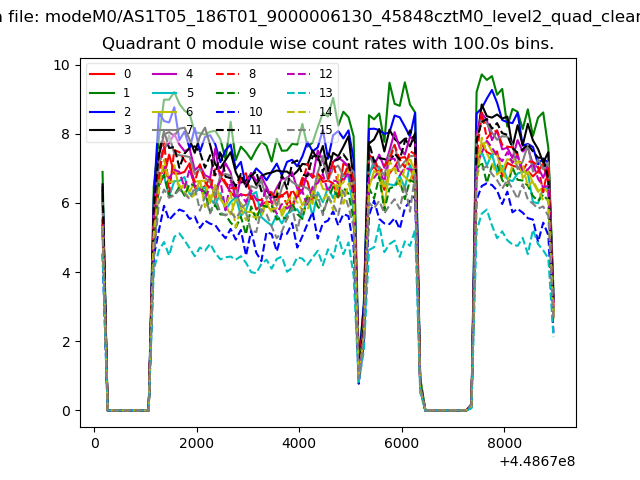 |
 |
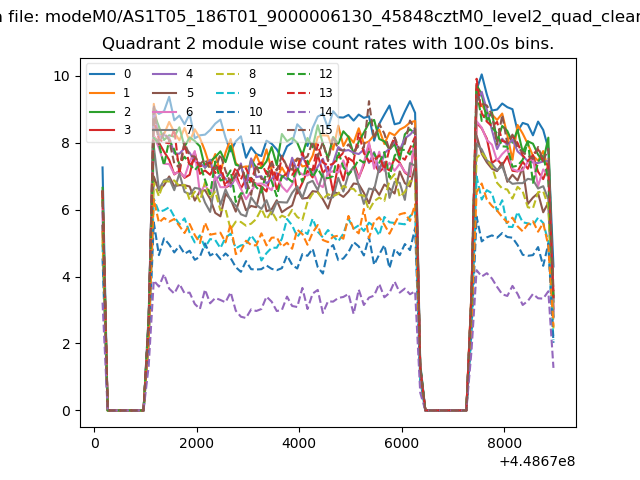
| Module-wise count rates for Quadrant B Data is divided into 100 sec bins |
 |
 |
| Module-wise count rates for Quadrant C Data is divided into 100 sec bins |
 |
 |
| Module-wise count rates for Quadrant D Data is divided into 100 sec bins |
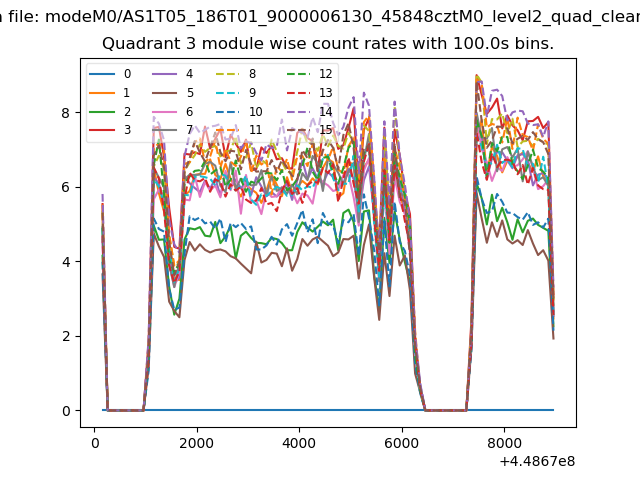 |
 |
| Parameter | Plot |
|---|---|
| CZT HV Monitor | 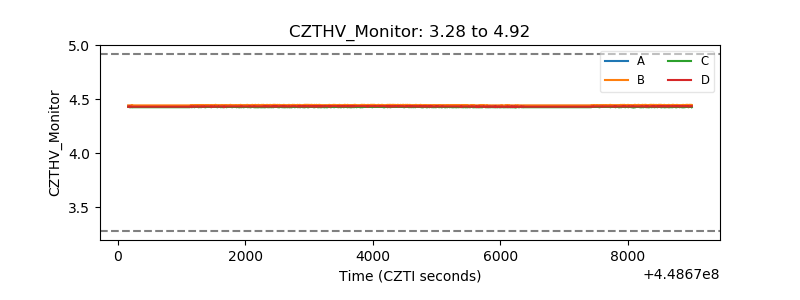 |
| D_VDD | 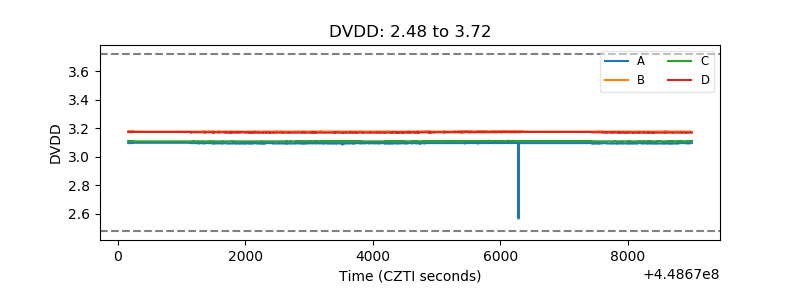 |
| Temperature 1 | 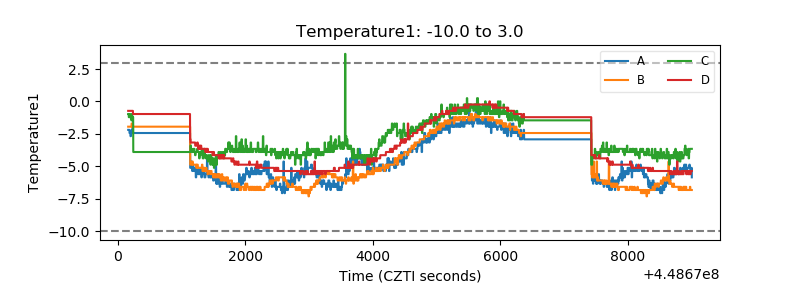 |
| Veto HV Monitor | 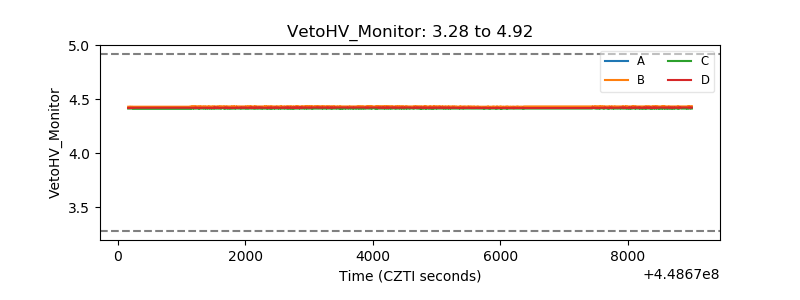 |
| Veto LLD | 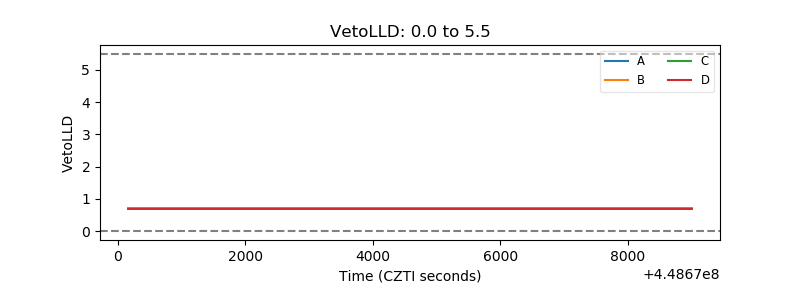 |
| Alpha Counter | 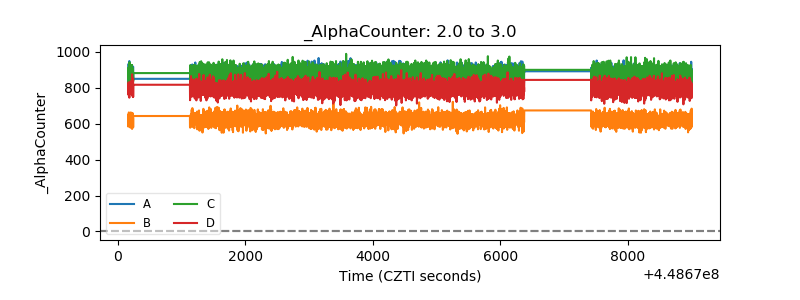 |
| _CPM_Rate | 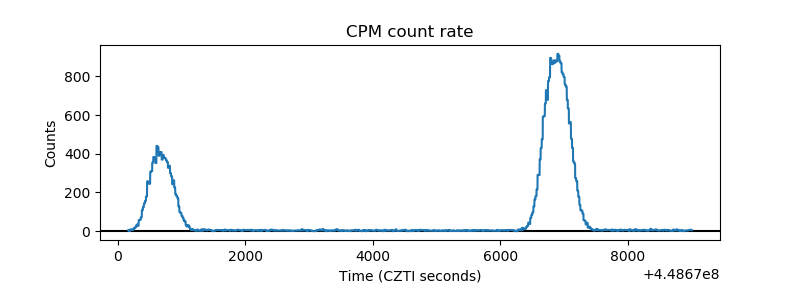 |
| CZT Counter | 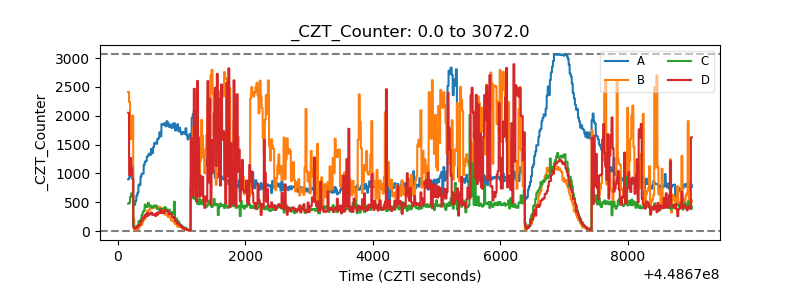 |
| +2.5 Volts monitor | 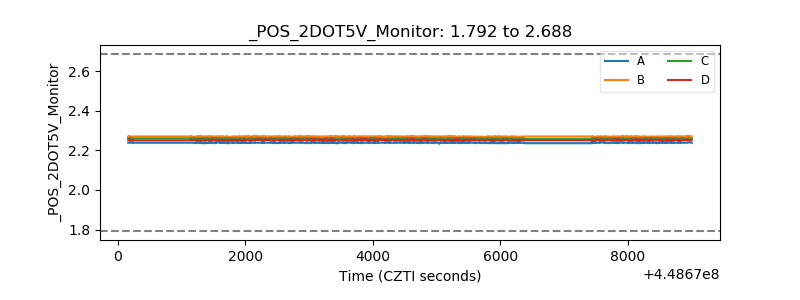 |
| +5 Volts monitor | 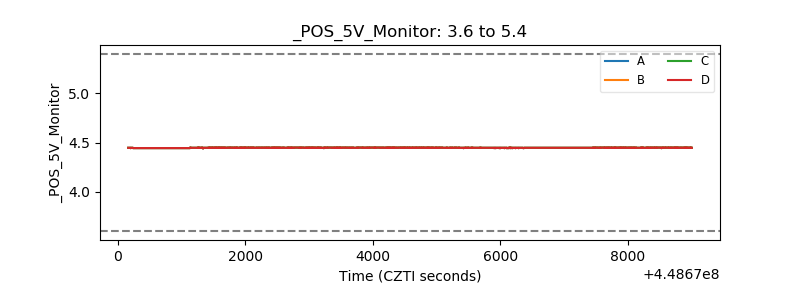 |
| _ROLL_ROT | 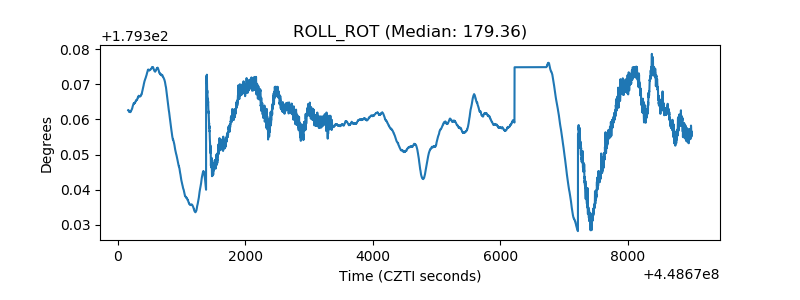 |
| _Roll_DEC | 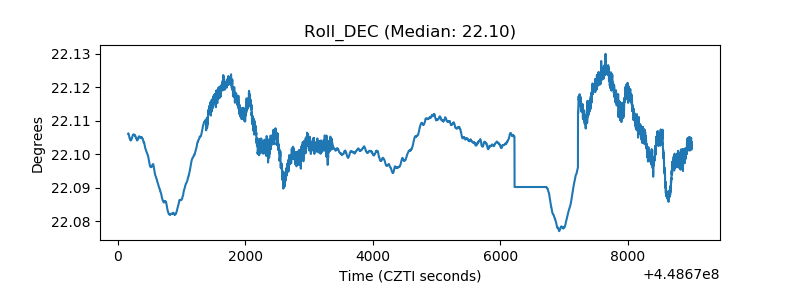 |
| _Roll_RA | 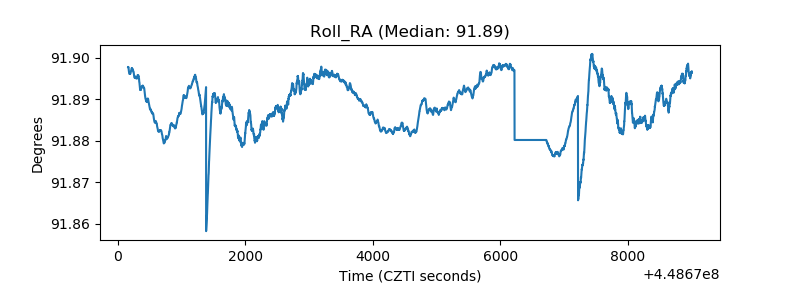 |
| Veto Counter | 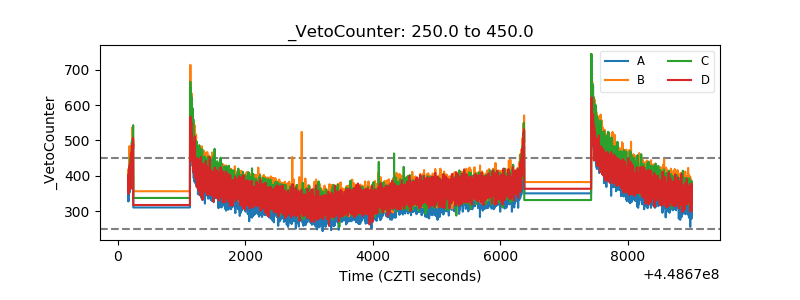 |