| Param | Original file | Final file |
|---|---|---|
| Filename | modeM0/AS1T05_186T01_9000006130_45849cztM0_level2.fits | modeM0/AS1T05_186T01_9000006130_45849cztM0_level2_quad_clean.evt |
| Size (bytes) | 588,703,680 | 107,864,640 |
| Size | 561.4 MB | 102.9 MB |
| Events in quadrant A | 5,967,241 | 735,090 |
| Events in quadrant B | 6,656,311 | 710,152 |
| Events in quadrant C | 3,060,660 | 750,048 |
| Events in quadrant D | 5,593,773 | 607,642 |
| Mode M0 | |||
|---|---|---|---|
| Quadrant | BADHDUFLAG | Total packets | Discarded packets |
| A | 0 | 22083 | 2 |
| B | 0 | 24332 | 2 |
| C | 0 | 13705 | 2 |
| D | 0 | 21280 | 2 |
| Mode M9 | |||
|---|---|---|---|
| Quadrant | BADHDUFLAG | Total packets | Discarded packets |
| A | 0 | 17 | 0 |
| B | 0 | 18 | 0 |
| C | 0 | 18 | 0 |
| D | 0 | 18 | 0 |
| Mode SS | |||
|---|---|---|---|
| Quadrant | BADHDUFLAG | Total packets | Discarded packets |
| A | 0 | 136 | 0 |
| B | 0 | 136 | 0 |
| C | 0 | 136 | 0 |
| D | 0 | 136 | 0 |
| Quadrant | Total seconds | Saturated seconds | Saturation percentage |
|---|---|---|---|
| A | 6637 | 190 | 2.862739% |
| B | 6637 | 855 | 12.882326% |
| C | 6636 | 38 | 0.572634% |
| D | 6636 | 758 | 11.422544% |
Noise dominated data is calculated using 1-second bins in cleaned event files. If a bin has >2000 counts, and if more than 50% of those come from <1% of pixels, then it is considered to be noise-dominated and hence unusable.
| Quadrant | # 1 sec bins | Bins with >0 counts | Bins with >2000 counts | High rate bins dominated by noise | Noise dominated (total time) | Noise dominated (detector-on time) | Marked lightcurve |
|---|---|---|---|---|---|---|---|
| A | 7742 | 6638 | 31 | 31 | 0.40% | 0.47% | 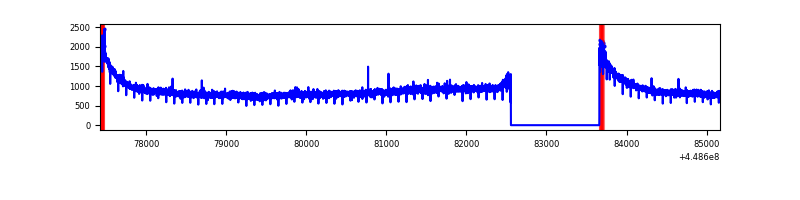 |
| B | 7742 | 6638 | 522 | 522 | 6.74% | 7.86% | 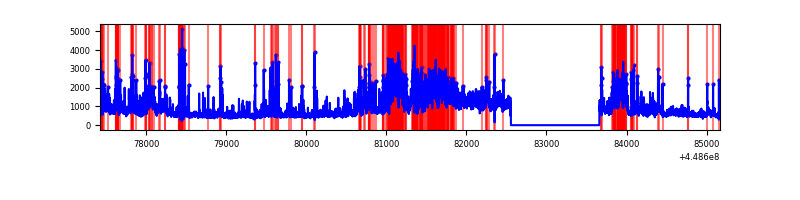 |
| C | 7741 | 6637 | 5 | 5 | 0.06% | 0.08% | 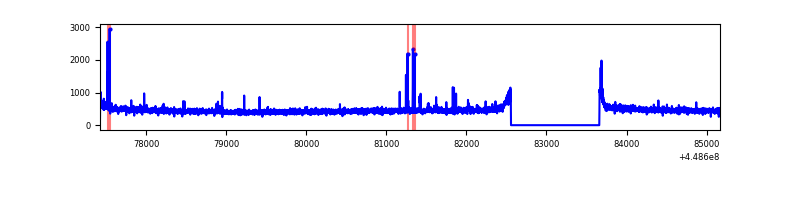 |
| D | 7741 | 6637 | 573 | 573 | 7.40% | 8.63% | 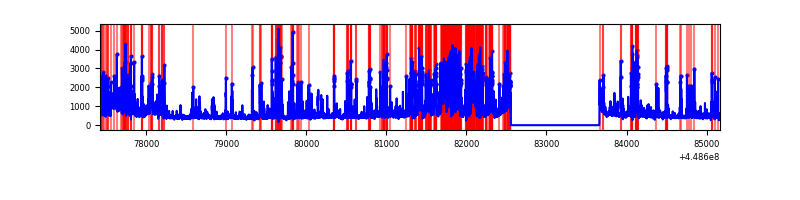 |
Top three noisy pixels from each quadrant. If the there are fewer than three noisy pixels in the level2.evt file, extra rows are filled as -1
| Pixel properties | Quadrant properties | ||||||
|---|---|---|---|---|---|---|---|
| Quadrant | DetID | PixID | Counts | Sigma | Mean | Median | Sigma |
| A | 10 | 83 | 2985544 | 18527.05 | 768 | 751 | 161.1 |
| A | 13 | 254 | 9882 | 56.68 | 768 | 751 | 161.1 |
| A | 3 | 137 | 8587 | 48.64 | 768 | 751 | 161.1 |
| B | 3 | 112 | 3079002 | 20917.08 | 748 | 726 | 147.2 |
| B | 0 | 189 | 256787 | 1739.95 | 748 | 726 | 147.2 |
| B | 0 | 171 | 147631 | 998.23 | 748 | 726 | 147.2 |
| C | 3 | 233 | 33796 | 182.33 | 764 | 769 | 181.1 |
| C | 12 | 249 | 19474 | 103.26 | 764 | 769 | 181.1 |
| C | 12 | 2 | 15733 | 82.61 | 764 | 769 | 181.1 |
| D | 13 | 249 | 1214824 | 6704.14 | 711 | 690 | 181.1 |
| D | 1 | 52 | 296171 | 1631.57 | 711 | 690 | 181.1 |
| D | 2 | 249 | 293687 | 1617.86 | 711 | 690 | 181.1 |
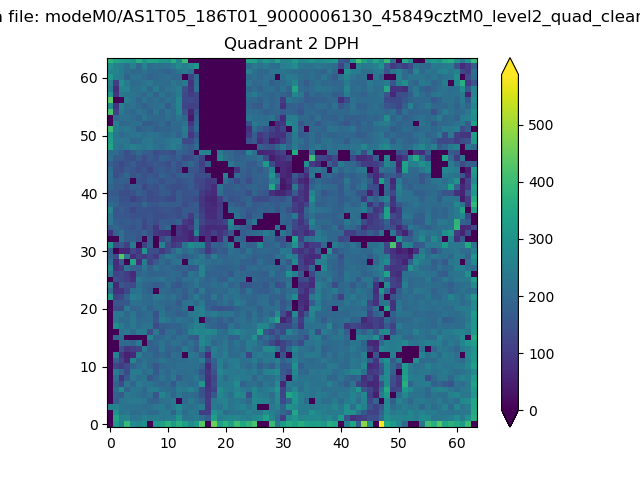
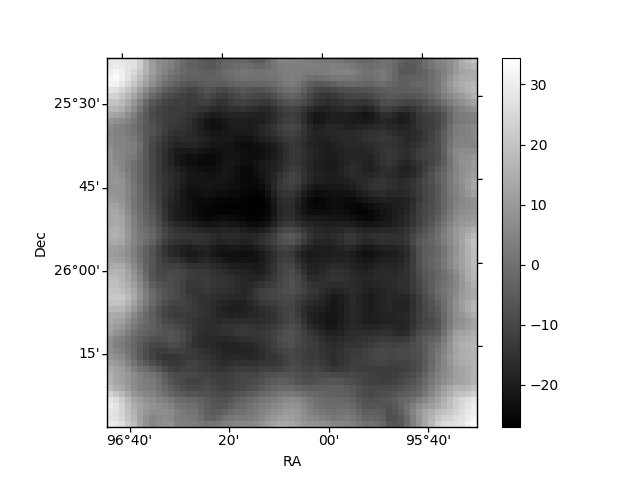
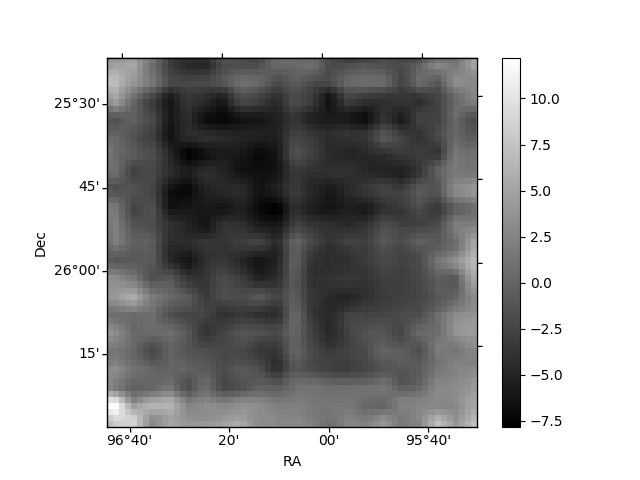
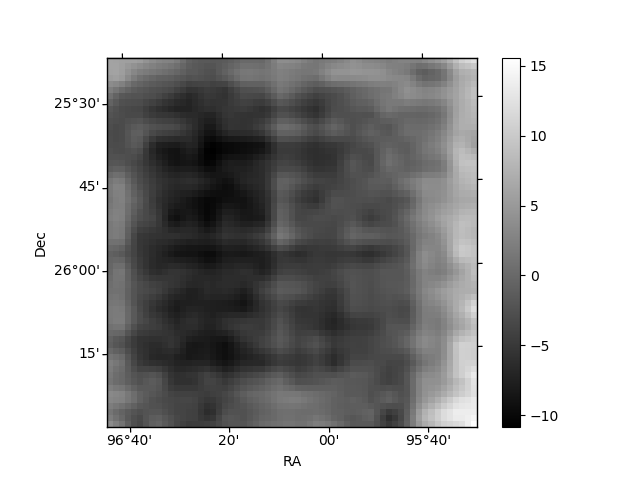
Histogram calculated using DETX and DETY for each event in the final _common_clean file
| Quadrant A | 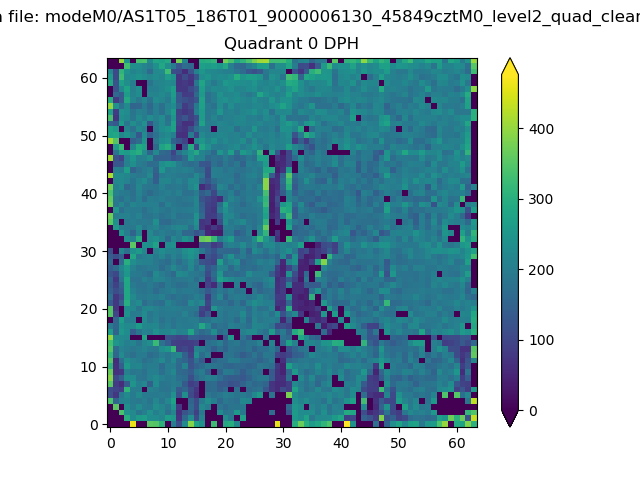 |
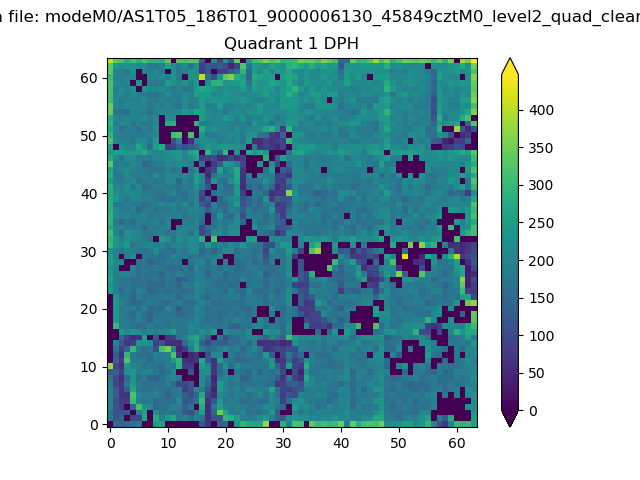 |
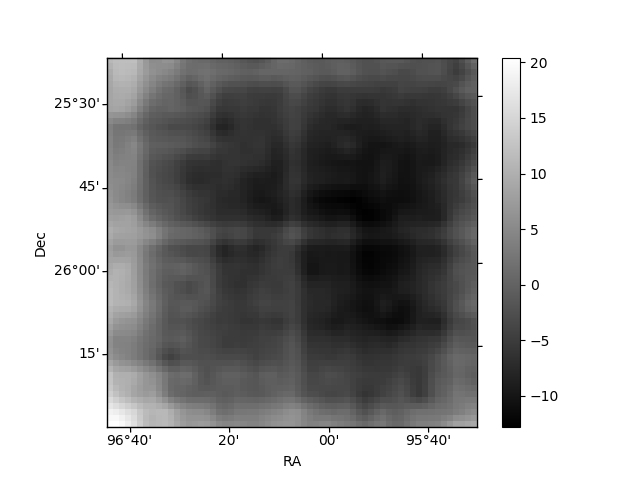
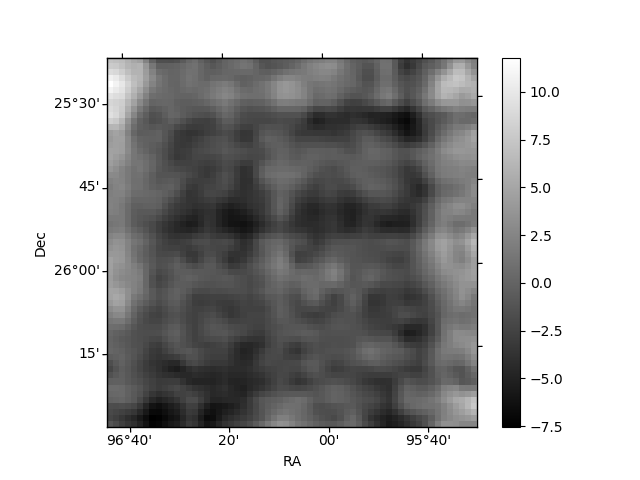
Quadrant B |
|---|---|---|---|
| Quadrant D | 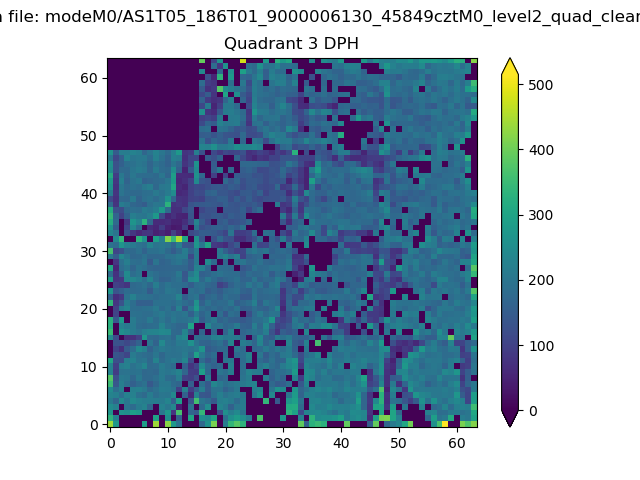 |
 |
Quadrant C |
| Plot type | Count rate plots | Images |
|---|---|---|
| Comparison with Poisson distribution Blue bars denote a histogram of data divided into 1 sec bins. Red curve is a Poisson curve with rate = median count rate of data. |
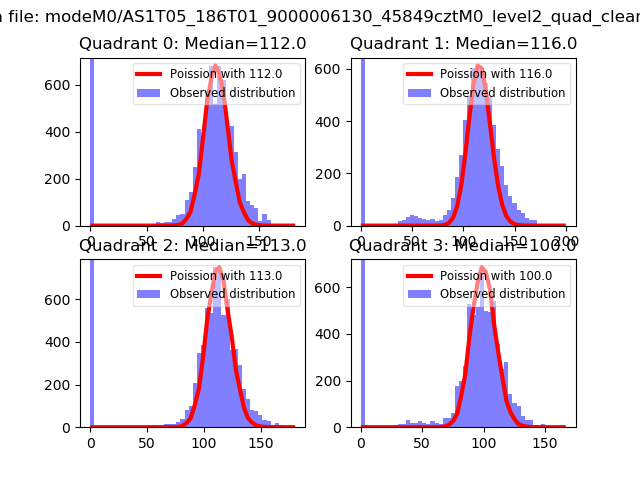 |
 |
| Quadrant-wise count rates Data is divided into 100 sec bins |
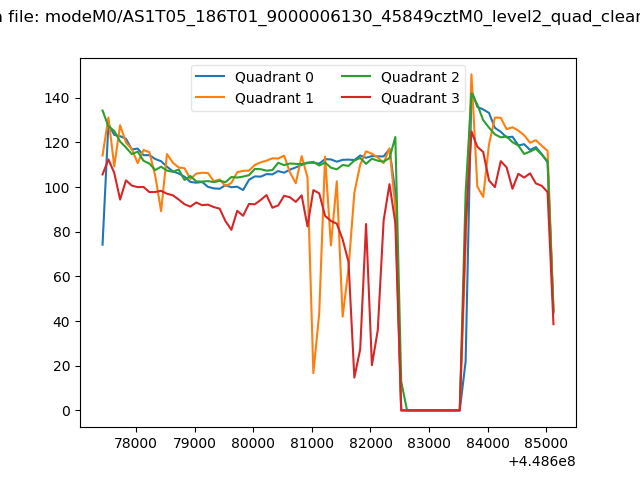 |
|
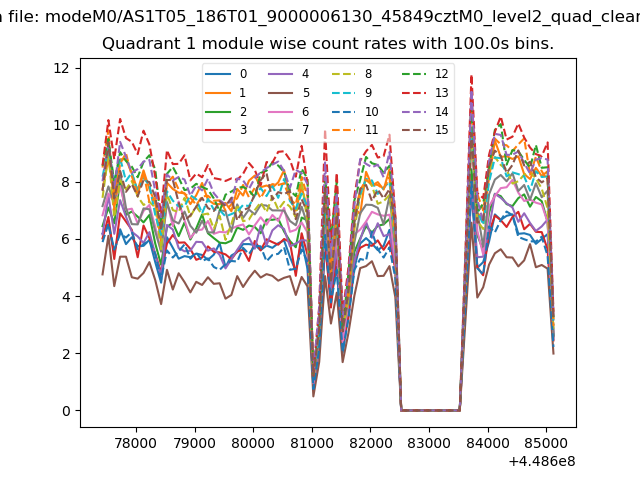
| Module-wise count rates for Quadrant A Data is divided into 100 sec bins |
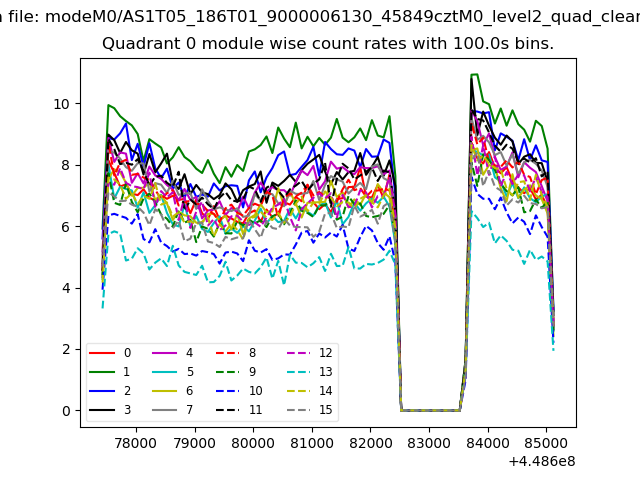 |
 |
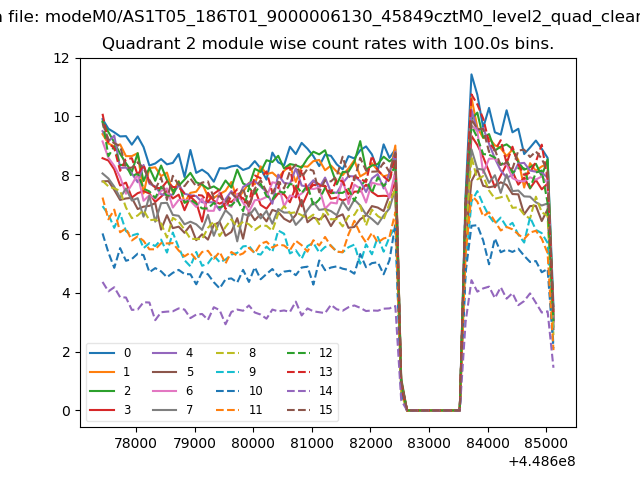
| Module-wise count rates for Quadrant B Data is divided into 100 sec bins |
 |
 |
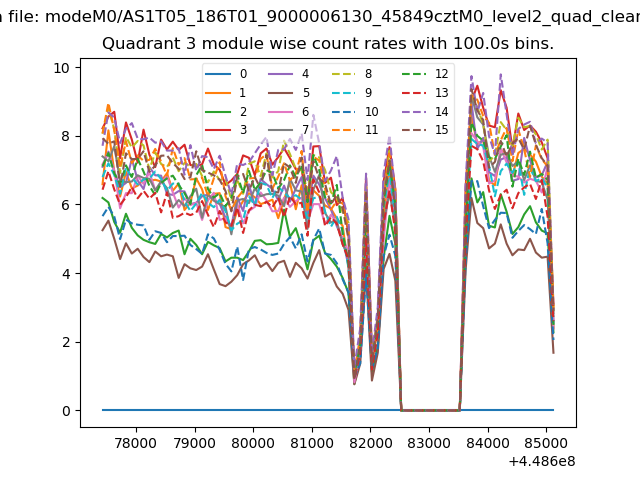
| Module-wise count rates for Quadrant C Data is divided into 100 sec bins |
 |
 |
| Module-wise count rates for Quadrant D Data is divided into 100 sec bins |
 |
 |
| Parameter | Plot |
|---|---|
| CZT HV Monitor | 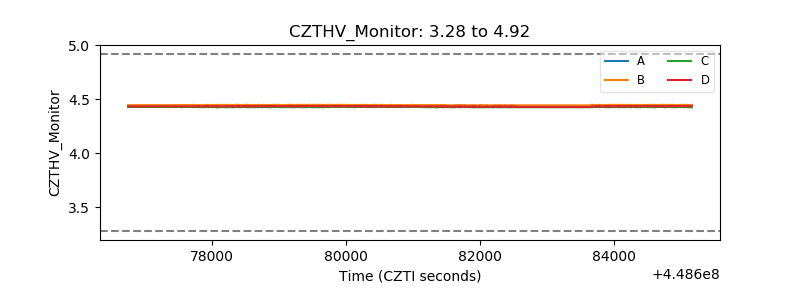 |
| D_VDD | 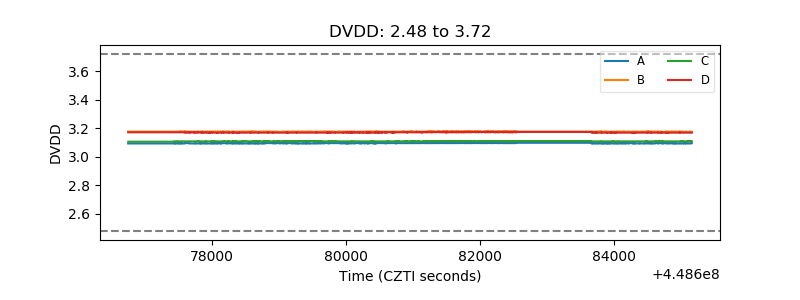 |
| Temperature 1 | 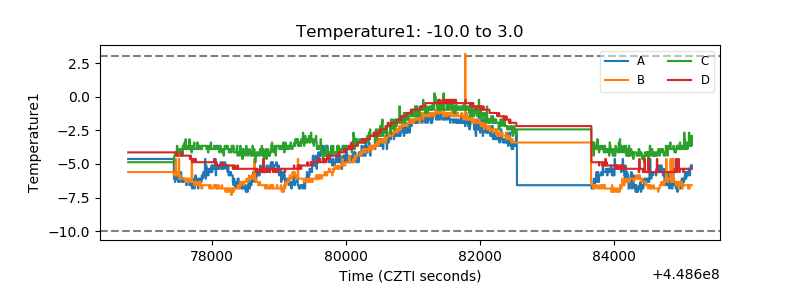 |
| Veto HV Monitor | 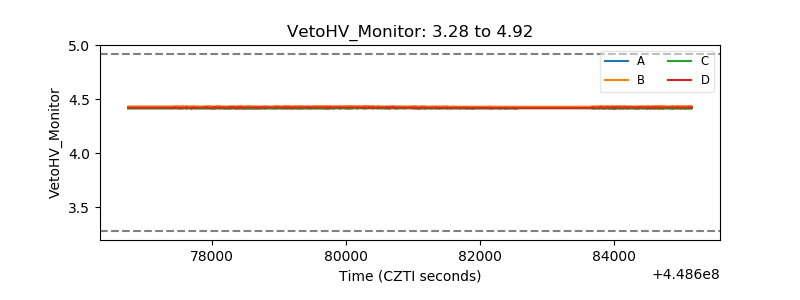 |
| Veto LLD | 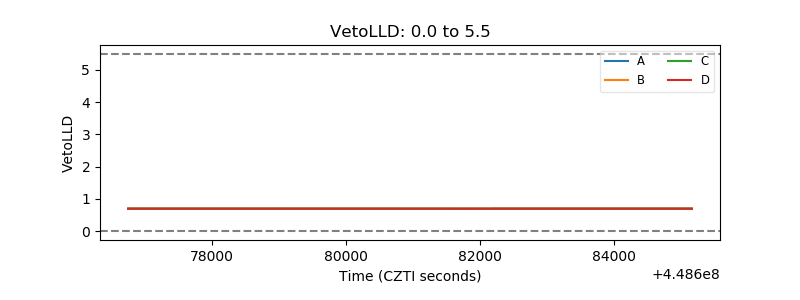 |
| Alpha Counter | 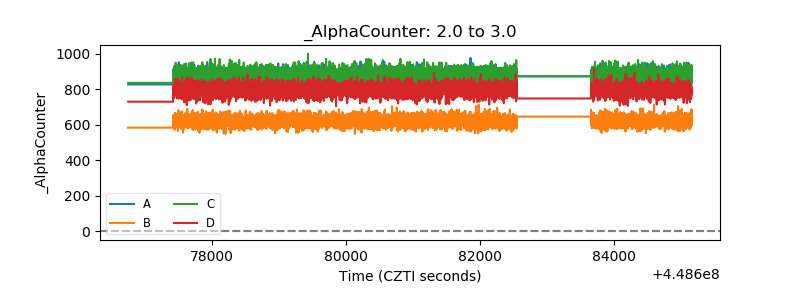 |
| _CPM_Rate | 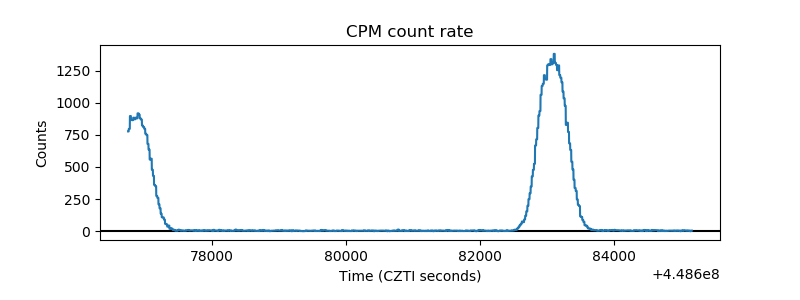 |
| CZT Counter | 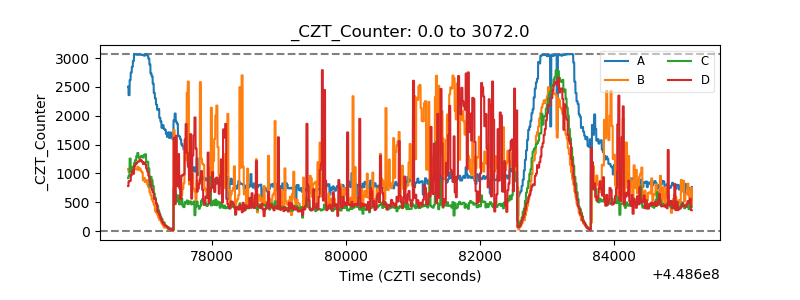 |
| +2.5 Volts monitor | 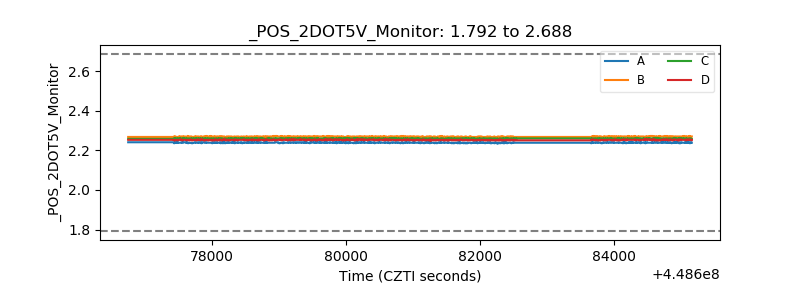 |
| +5 Volts monitor | 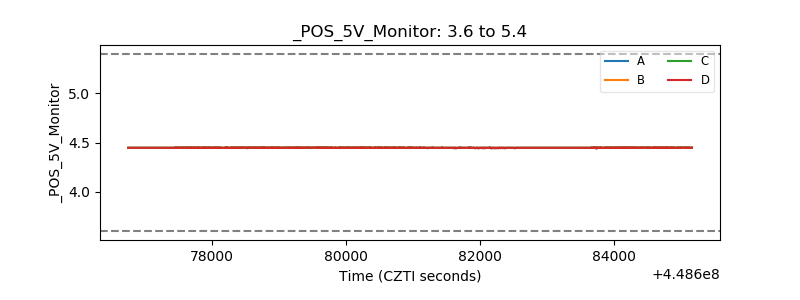 |
| _ROLL_ROT | 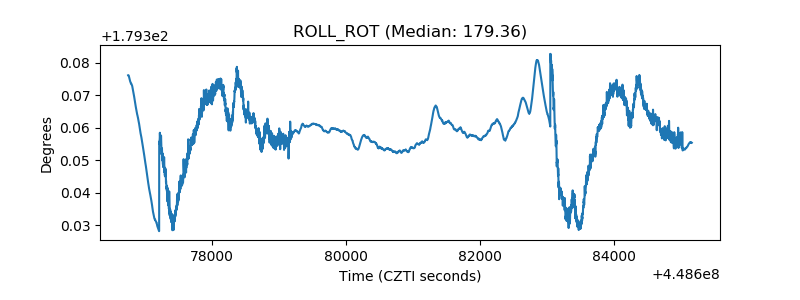 |
| _Roll_DEC | 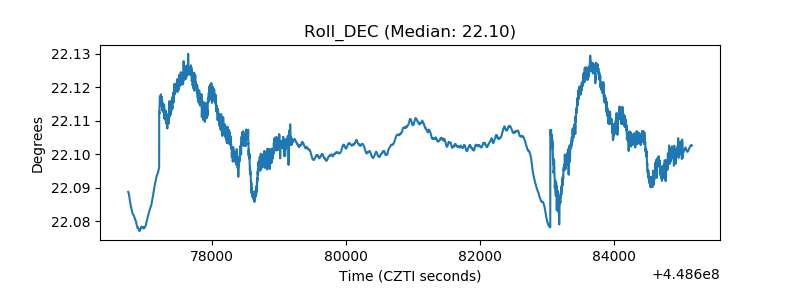 |
| _Roll_RA | 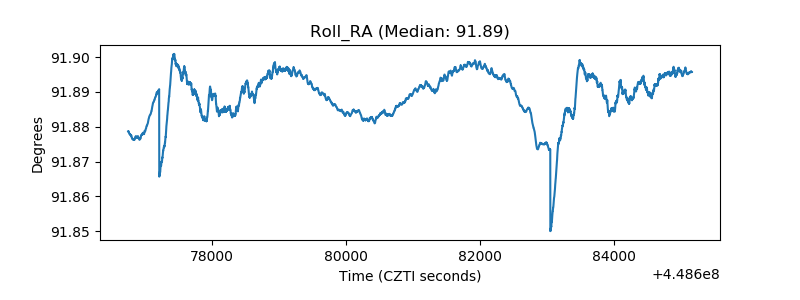 |
| Veto Counter | 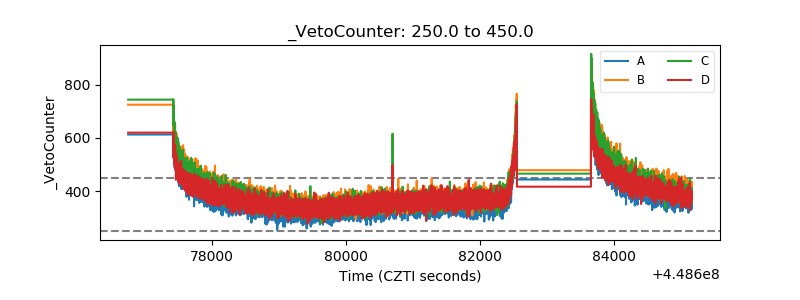 |