| Param | Original file | Final file |
|---|---|---|
| Filename | modeM0/AS1T05_186T01_9000006130_45850cztM0_level2.fits | modeM0/AS1T05_186T01_9000006130_45850cztM0_level2_quad_clean.evt |
| Size (bytes) | 572,005,440 | 109,964,160 |
| Size | 545.5 MB | 104.9 MB |
| Events in quadrant A | 5,892,842 | 748,371 |
| Events in quadrant B | 6,713,966 | 718,127 |
| Events in quadrant C | 3,114,157 | 760,246 |
| Events in quadrant D | 4,956,078 | 655,506 |
| Mode M0 | |||
|---|---|---|---|
| Quadrant | BADHDUFLAG | Total packets | Discarded packets |
| A | 0 | 21627 | 2 |
| B | 0 | 24411 | 2 |
| C | 0 | 13504 | 2 |
| D | 0 | 19112 | 2 |
| Mode M9 | |||
|---|---|---|---|
| Quadrant | BADHDUFLAG | Total packets | Discarded packets |
| A | 0 | 16 | 0 |
| B | 0 | 17 | 0 |
| C | 0 | 17 | 0 |
| D | 0 | 17 | 0 |
| Mode SS | |||
|---|---|---|---|
| Quadrant | BADHDUFLAG | Total packets | Discarded packets |
| A | 0 | 130 | 0 |
| B | 0 | 130 | 0 |
| C | 0 | 130 | 0 |
| D | 0 | 130 | 0 |
| Quadrant | Total seconds | Saturated seconds | Saturation percentage |
|---|---|---|---|
| A | 6414 | 193 | 3.009043% |
| B | 6414 | 906 | 14.125351% |
| C | 6414 | 28 | 0.436545% |
| D | 6414 | 432 | 6.735267% |
Noise dominated data is calculated using 1-second bins in cleaned event files. If a bin has >2000 counts, and if more than 50% of those come from <1% of pixels, then it is considered to be noise-dominated and hence unusable.
| Quadrant | # 1 sec bins | Bins with >0 counts | Bins with >2000 counts | High rate bins dominated by noise | Noise dominated (total time) | Noise dominated (detector-on time) | Marked lightcurve |
|---|---|---|---|---|---|---|---|
| A | 7624 | 6415 | 19 | 19 | 0.25% | 0.30% | 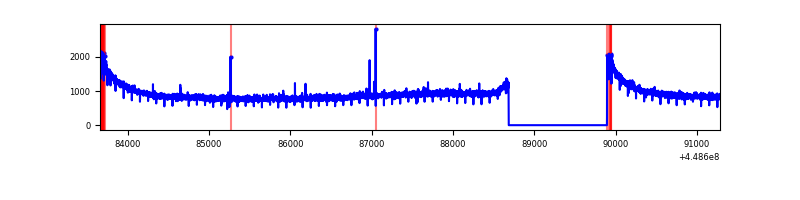 |
| B | 7624 | 6415 | 592 | 592 | 7.76% | 9.23% | 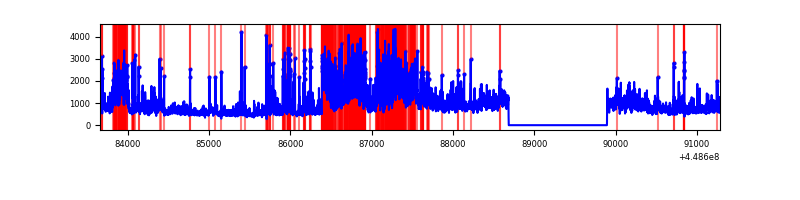 |
| C | 7624 | 6415 | 7 | 7 | 0.09% | 0.11% | 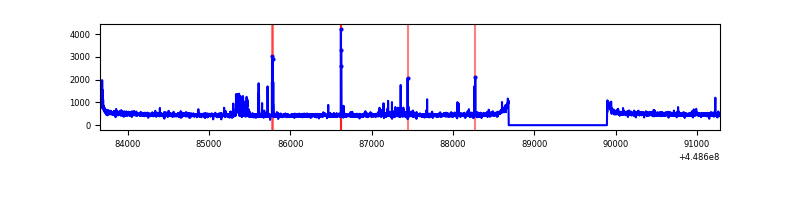 |
| D | 7624 | 6415 | 362 | 362 | 4.75% | 5.64% | 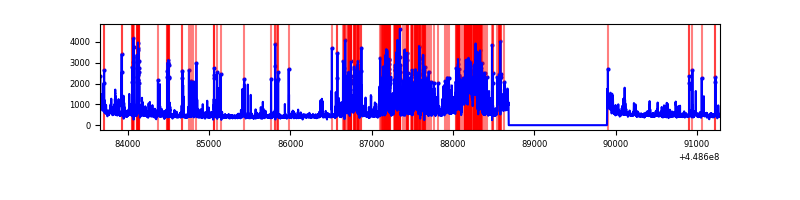 |
Top three noisy pixels from each quadrant. If the there are fewer than three noisy pixels in the level2.evt file, extra rows are filled as -1
| Pixel properties | Quadrant properties | ||||||
|---|---|---|---|---|---|---|---|
| Quadrant | DetID | PixID | Counts | Sigma | Mean | Median | Sigma |
| A | 10 | 83 | 2898733 | 18045.51 | 768 | 754 | 160.6 |
| A | 13 | 254 | 10749 | 62.24 | 768 | 754 | 160.6 |
| A | 3 | 137 | 8316 | 47.09 | 768 | 754 | 160.6 |
| B | 3 | 112 | 3376996 | 23166.22 | 748 | 727 | 145.7 |
| B | 0 | 189 | 134833 | 920.17 | 748 | 727 | 145.7 |
| B | 0 | 171 | 77237 | 524.97 | 748 | 727 | 145.7 |
| C | 3 | 233 | 68961 | 383.92 | 760 | 766 | 177.6 |
| C | 12 | 249 | 43345 | 239.71 | 760 | 766 | 177.6 |
| C | 12 | 2 | 26448 | 144.58 | 760 | 766 | 177.6 |
| D | 12 | 2 | 601402 | 3246.59 | 736 | 714 | 185.0 |
| D | 13 | 249 | 575557 | 3106.9 | 736 | 714 | 185.0 |
| D | 2 | 249 | 219330 | 1181.57 | 736 | 714 | 185.0 |
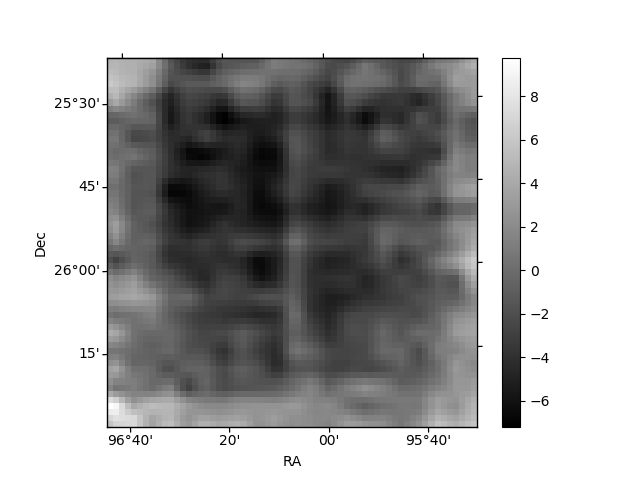
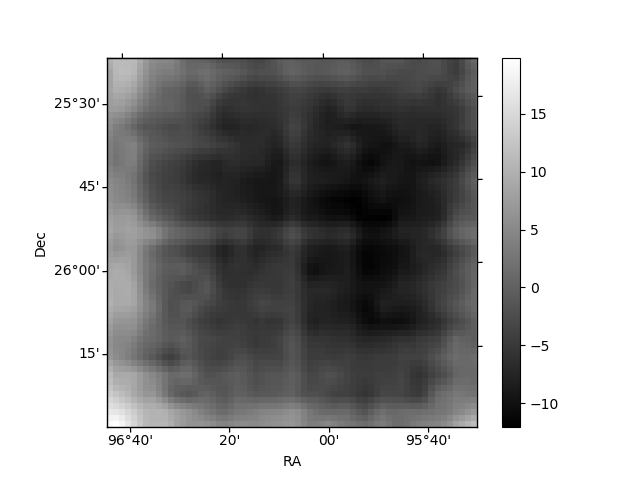
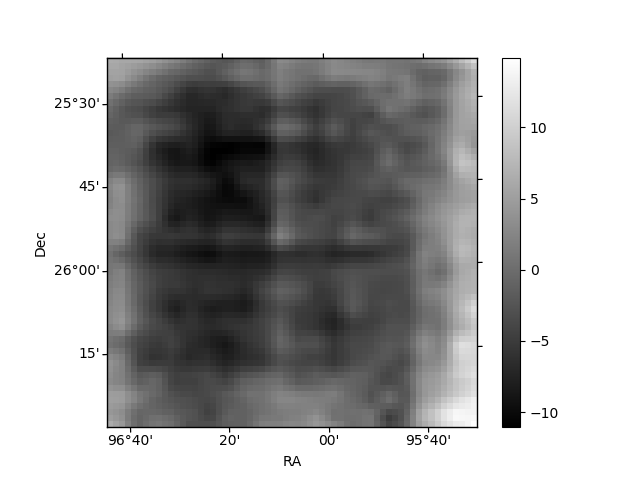
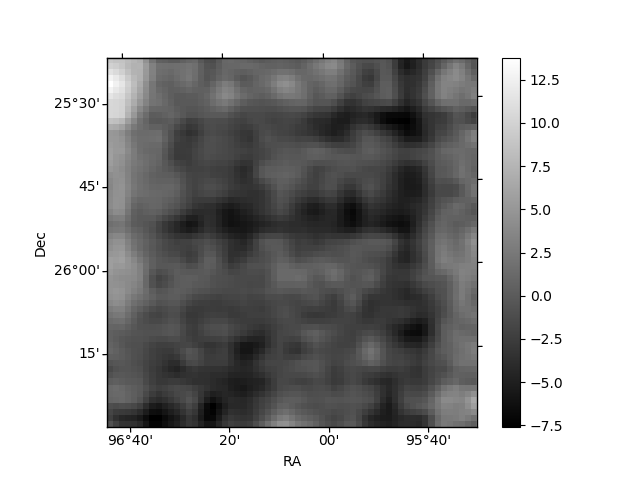
Histogram calculated using DETX and DETY for each event in the final _common_clean file
| Quadrant A | 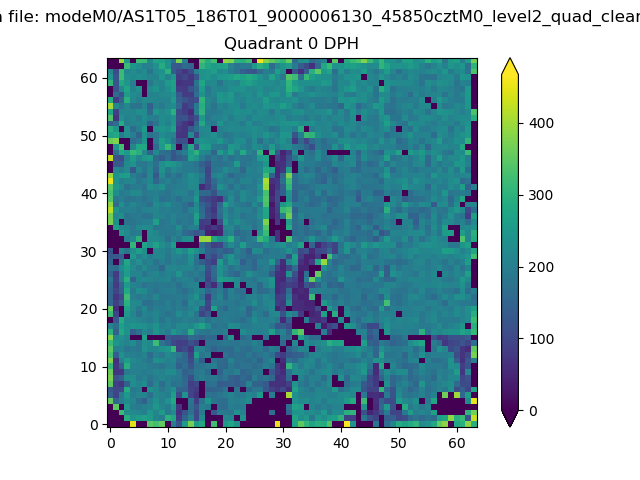 |
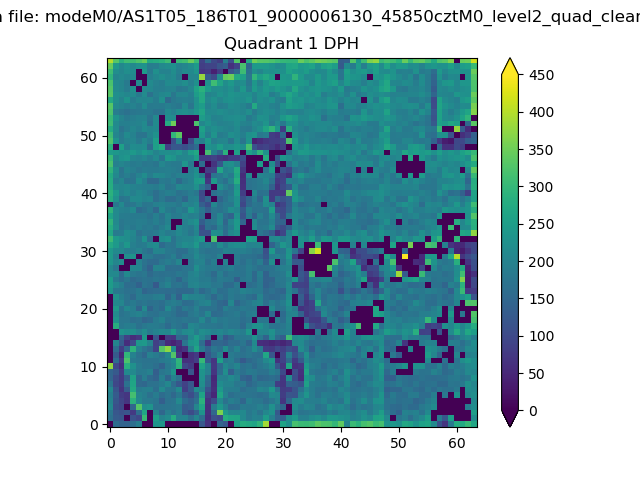 |
Quadrant B |
|---|---|---|---|
| Quadrant D | 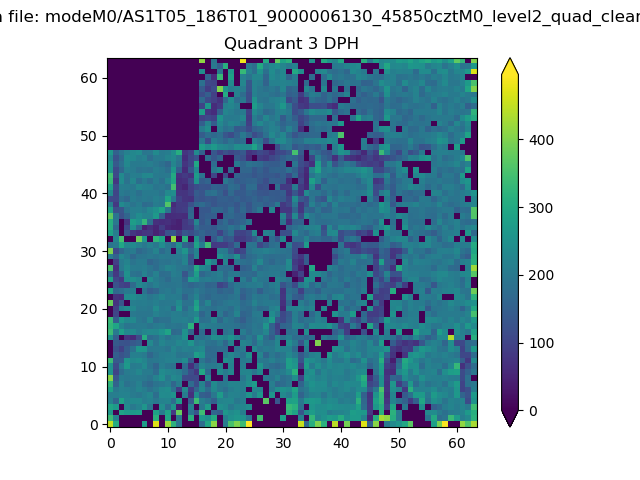 |
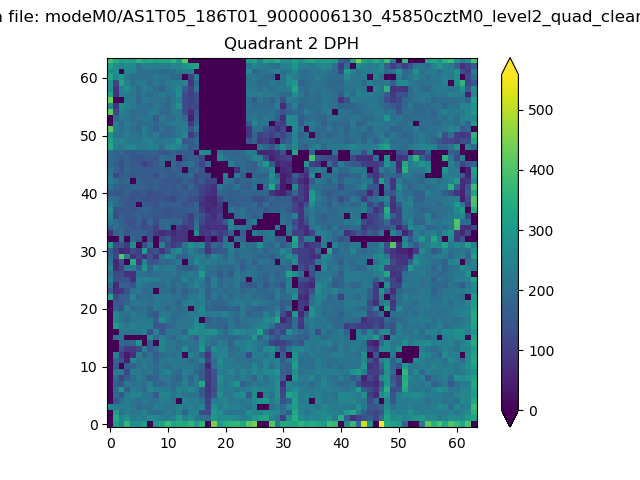 |
Quadrant C |
| Plot type | Count rate plots | Images |
|---|---|---|
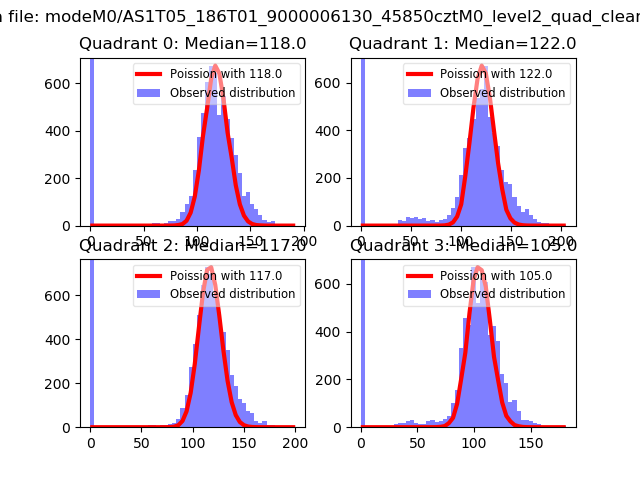
| Comparison with Poisson distribution Blue bars denote a histogram of data divided into 1 sec bins. Red curve is a Poisson curve with rate = median count rate of data. |
 |
 |
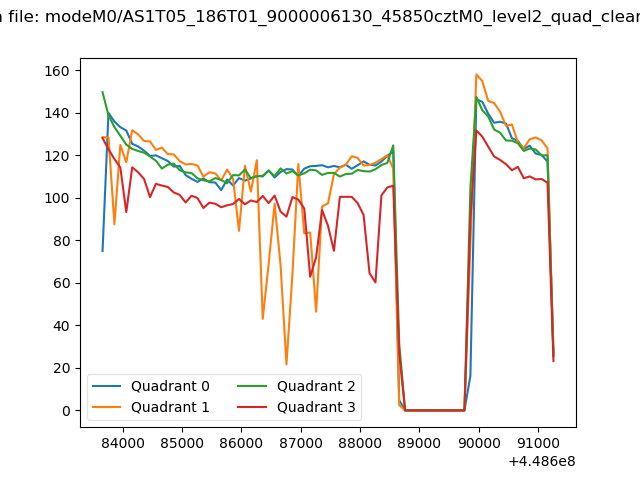
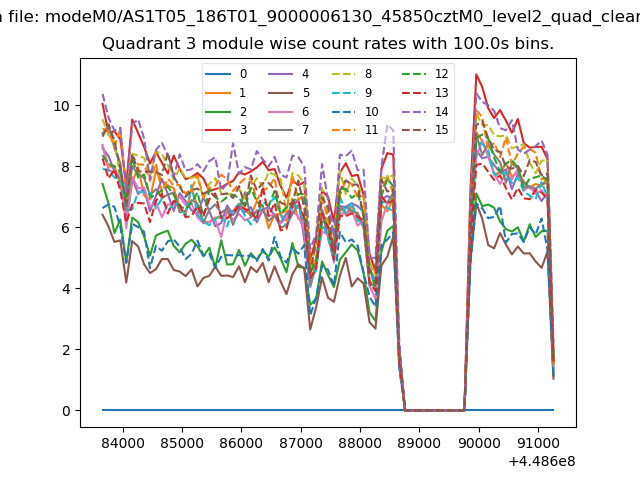
| Quadrant-wise count rates Data is divided into 100 sec bins |
 |
|
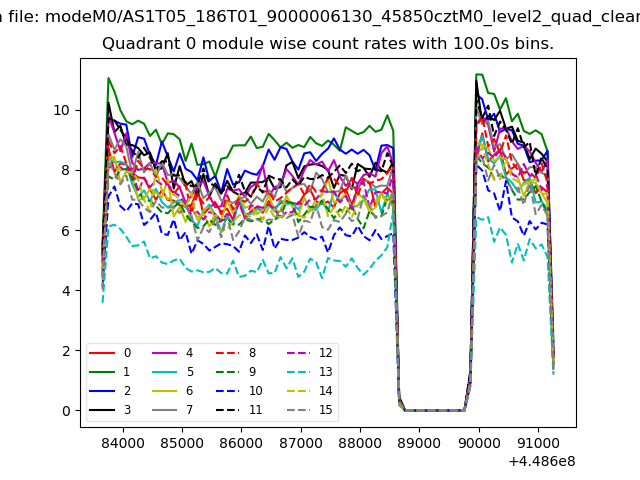
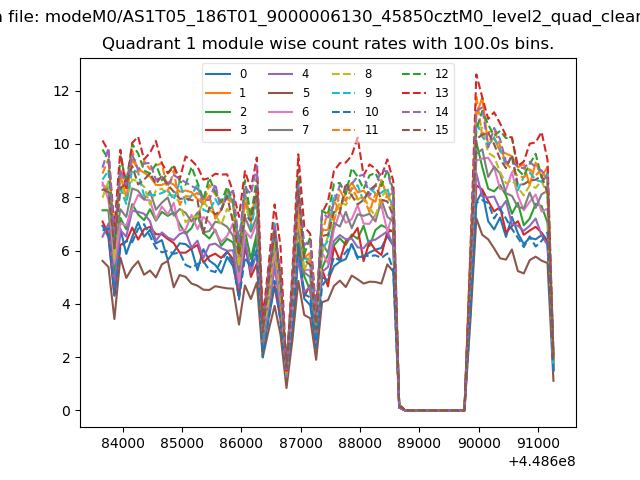
| Module-wise count rates for Quadrant A Data is divided into 100 sec bins |
 |
 |
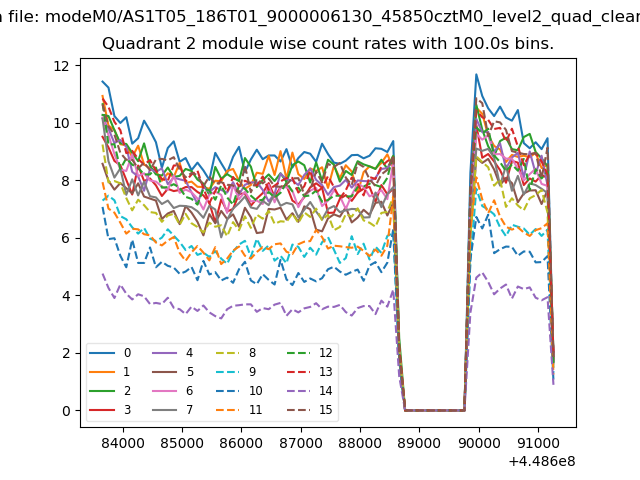
| Module-wise count rates for Quadrant B Data is divided into 100 sec bins |
 |
 |
| Module-wise count rates for Quadrant C Data is divided into 100 sec bins |
 |
 |
| Module-wise count rates for Quadrant D Data is divided into 100 sec bins |
 |
 |
| Parameter | Plot |
|---|---|
| CZT HV Monitor | 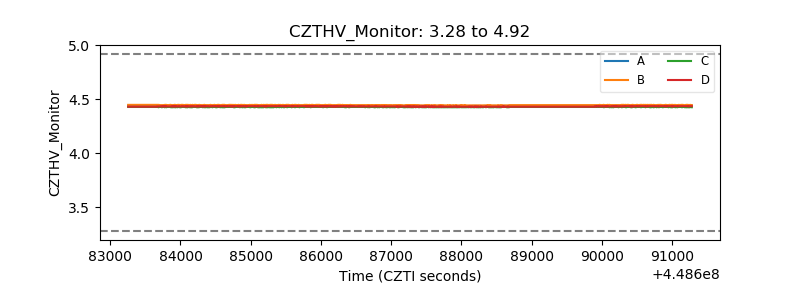 |
| D_VDD | 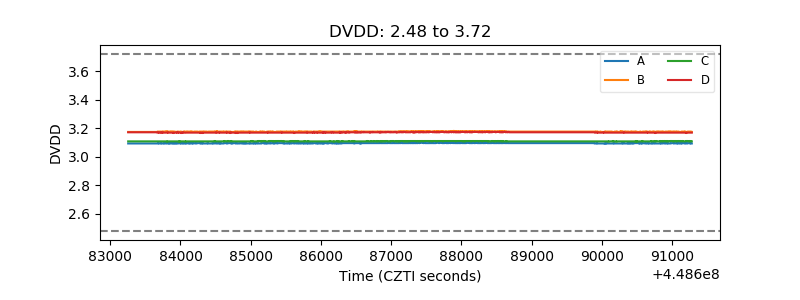 |
| Temperature 1 | 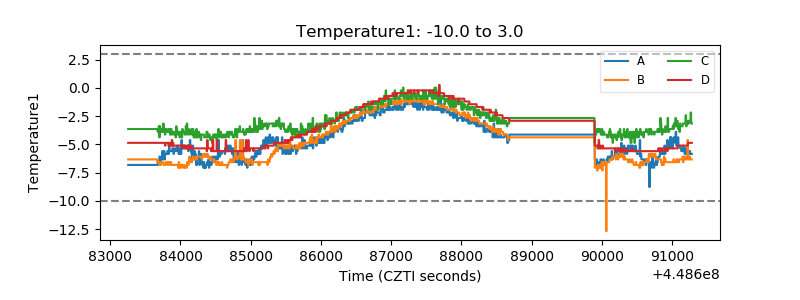 |
| Veto HV Monitor | 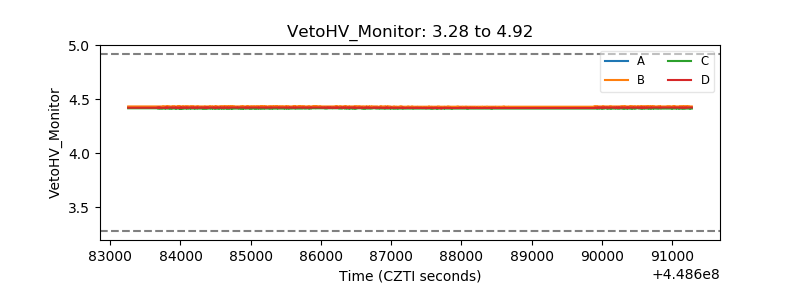 |
| Veto LLD | 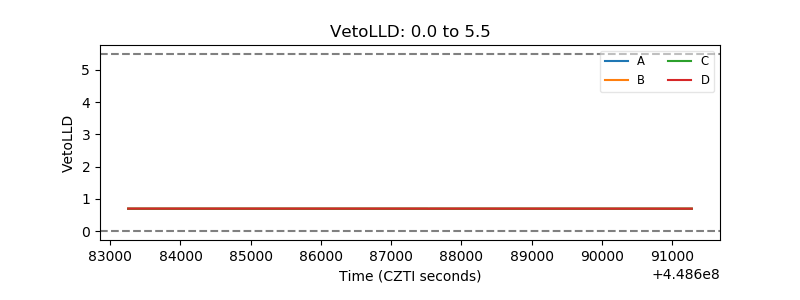 |
| Alpha Counter | 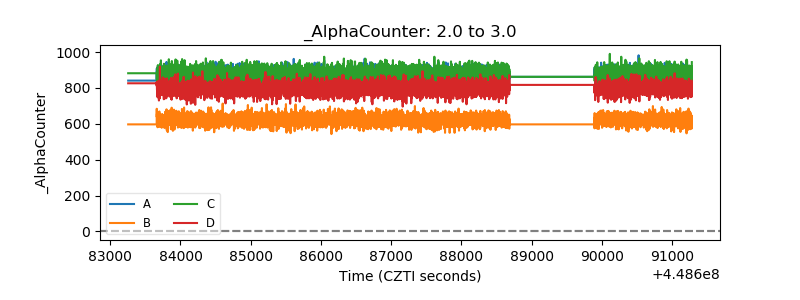 |
| _CPM_Rate | 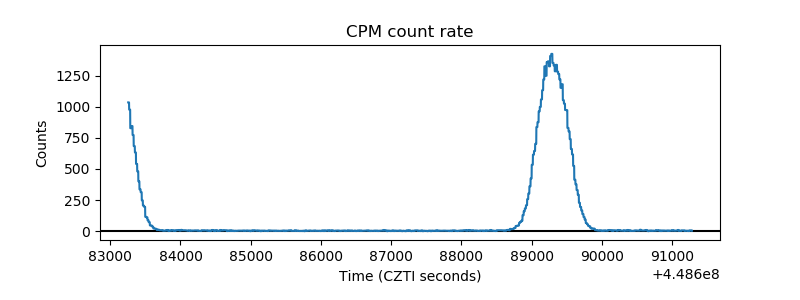 |
| CZT Counter | 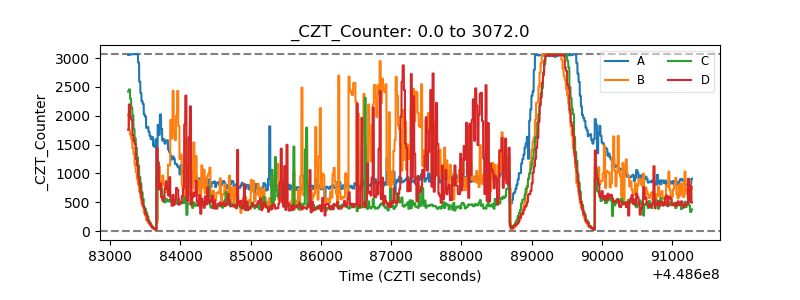 |
| +2.5 Volts monitor | 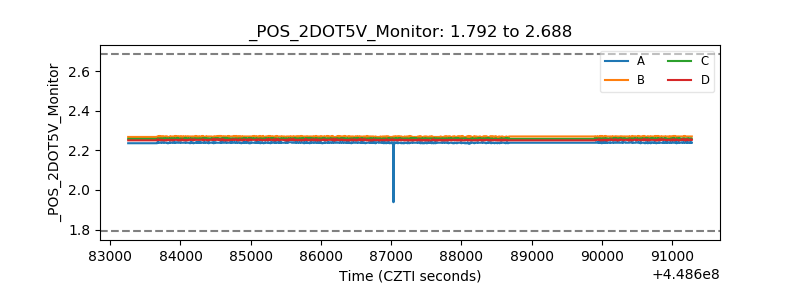 |
| +5 Volts monitor | 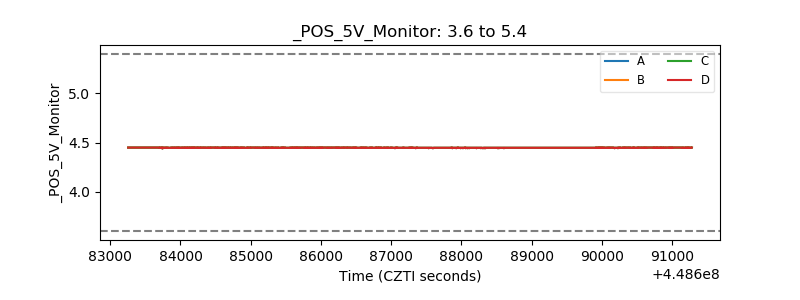 |
| _ROLL_ROT | 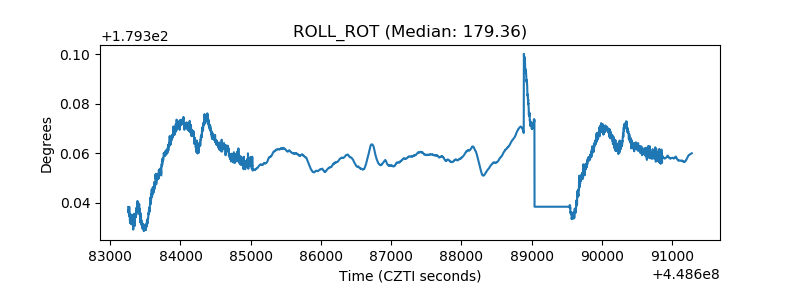 |
| _Roll_DEC | 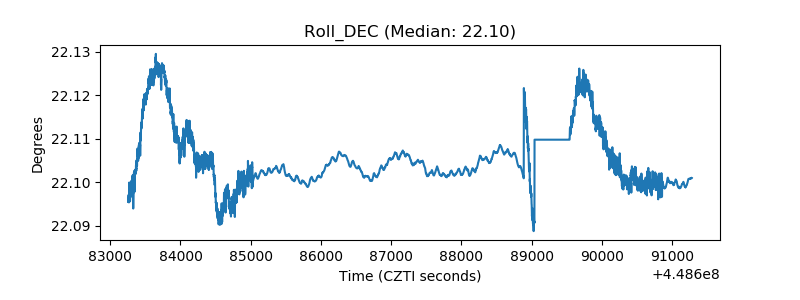 |
| _Roll_RA | 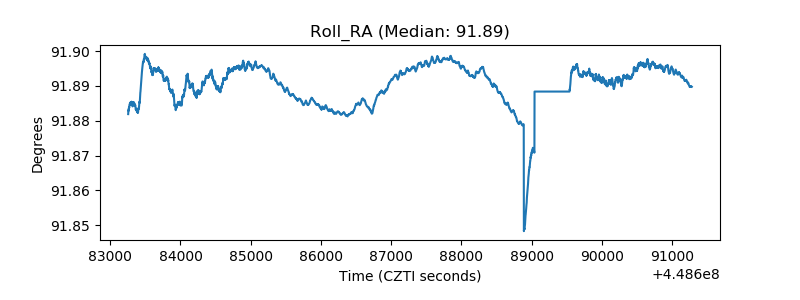 |
| Veto Counter | 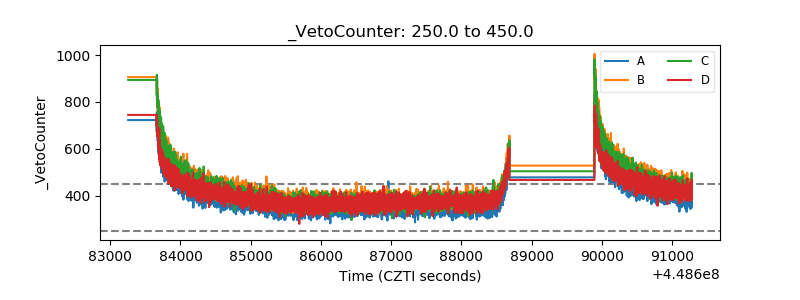 |