| Param | Original file | Final file |
|---|---|---|
| Filename | modeM0/AS1T05_186T01_9000006130_45852cztM0_level2.fits | modeM0/AS1T05_186T01_9000006130_45852cztM0_level2_quad_clean.evt |
| Size (bytes) | 671,071,680 | 105,819,840 |
| Size | 640.0 MB | 100.9 MB |
| Events in quadrant A | 6,075,897 | 750,012 |
| Events in quadrant B | 9,905,208 | 583,557 |
| Events in quadrant C | 3,127,189 | 761,465 |
| Events in quadrant D | 5,227,807 | 653,869 |
| Mode M0 | |||
|---|---|---|---|
| Quadrant | BADHDUFLAG | Total packets | Discarded packets |
| A | 0 | 21940 | 2 |
| B | 0 | 33985 | 4 |
| C | 0 | 13668 | 2 |
| D | 0 | 19844 | 2 |
| Mode M9 | |||
|---|---|---|---|
| Quadrant | BADHDUFLAG | Total packets | Discarded packets |
| A | 0 | 13 | 0 |
| B | 0 | 14 | 0 |
| C | 0 | 14 | 0 |
| D | 0 | 14 | 0 |
| Mode SS | |||
|---|---|---|---|
| Quadrant | BADHDUFLAG | Total packets | Discarded packets |
| A | 0 | 134 | 0 |
| B | 0 | 134 | 0 |
| C | 0 | 134 | 0 |
| D | 0 | 134 | 0 |
| Quadrant | Total seconds | Saturated seconds | Saturation percentage |
|---|---|---|---|
| A | 6521 | 296 | 4.539181% |
| B | 6520 | 2362 | 36.226994% |
| C | 6520 | 92 | 1.411043% |
| D | 6520 | 496 | 7.607362% |
Noise dominated data is calculated using 1-second bins in cleaned event files. If a bin has >2000 counts, and if more than 50% of those come from <1% of pixels, then it is considered to be noise-dominated and hence unusable.
| Quadrant | # 1 sec bins | Bins with >0 counts | Bins with >2000 counts | High rate bins dominated by noise | Noise dominated (total time) | Noise dominated (detector-on time) | Marked lightcurve |
|---|---|---|---|---|---|---|---|
| A | 7666 | 6524 | 6 | 6 | 0.08% | 0.09% | 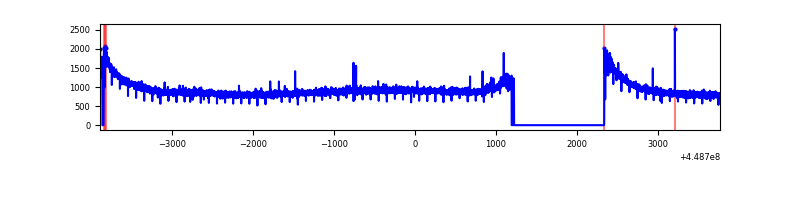 |
| B | 7665 | 6522 | 1573 | 1573 | 20.52% | 24.12% | 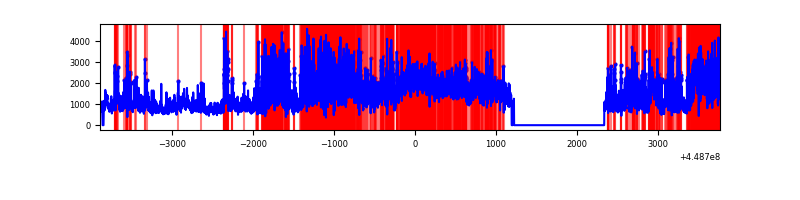 |
| C | 7665 | 6523 | 8 | 8 | 0.10% | 0.12% | 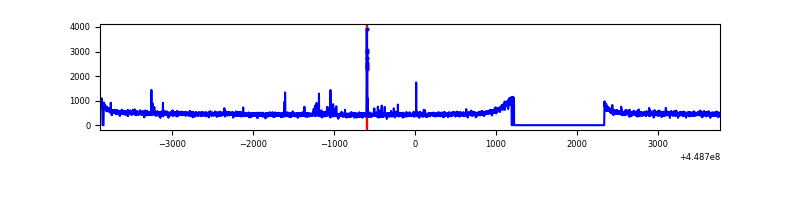 |
| D | 7665 | 6523 | 310 | 310 | 4.04% | 4.75% | 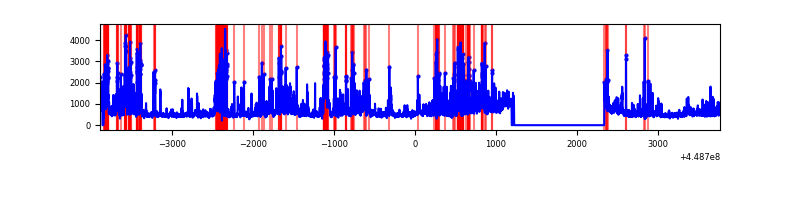 |
Top three noisy pixels from each quadrant. If the there are fewer than three noisy pixels in the level2.evt file, extra rows are filled as -1
| Pixel properties | Quadrant properties | ||||||
|---|---|---|---|---|---|---|---|
| Quadrant | DetID | PixID | Counts | Sigma | Mean | Median | Sigma |
| A | 10 | 83 | 2992617 | 18376.7 | 790 | 775 | 162.8 |
| A | 14 | 235 | 13329 | 77.11 | 790 | 775 | 162.8 |
| A | 13 | 254 | 8734 | 48.89 | 790 | 775 | 162.8 |
| B | 3 | 112 | 6336549 | 44792.13 | 719 | 699 | 141.5 |
| B | 0 | 189 | 271194 | 1912.3 | 719 | 699 | 141.5 |
| B | 0 | 171 | 147381 | 1036.99 | 719 | 699 | 141.5 |
| C | 12 | 249 | 48004 | 258.62 | 782 | 787 | 182.6 |
| C | 12 | 2 | 12670 | 65.09 | 782 | 787 | 182.6 |
| C | 3 | 233 | 12482 | 64.06 | 782 | 787 | 182.6 |
| D | 1 | 52 | 726811 | 3828.38 | 756 | 732 | 189.7 |
| D | 12 | 2 | 489208 | 2575.57 | 756 | 732 | 189.7 |
| D | 13 | 249 | 480017 | 2527.11 | 756 | 732 | 189.7 |
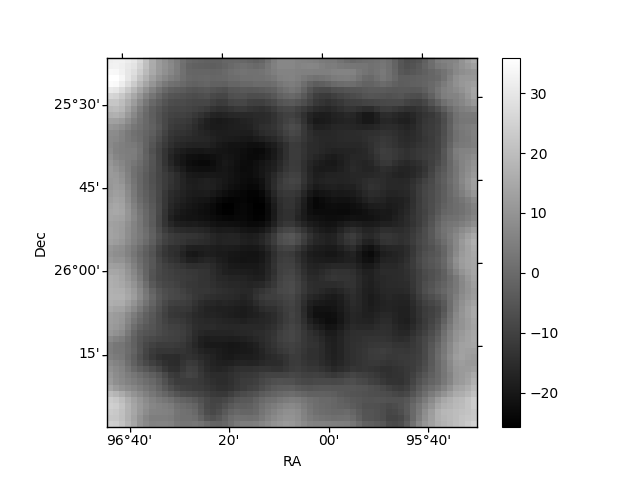
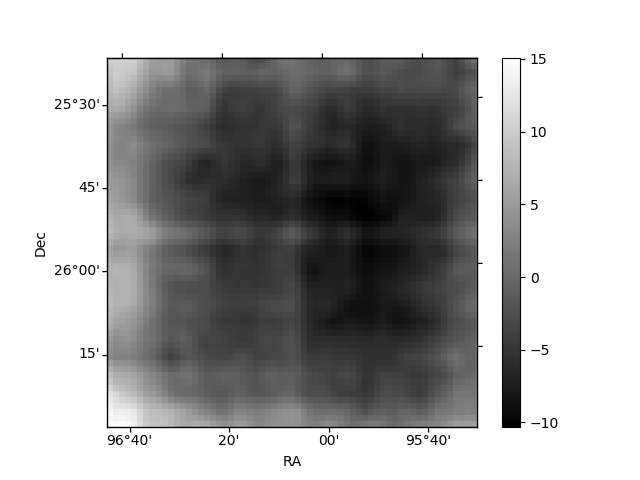
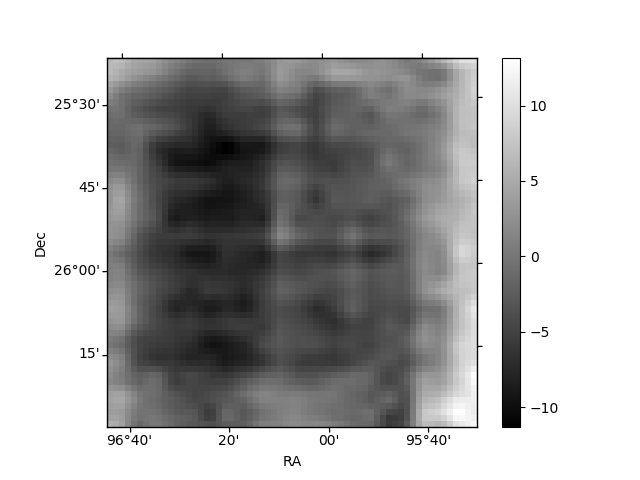
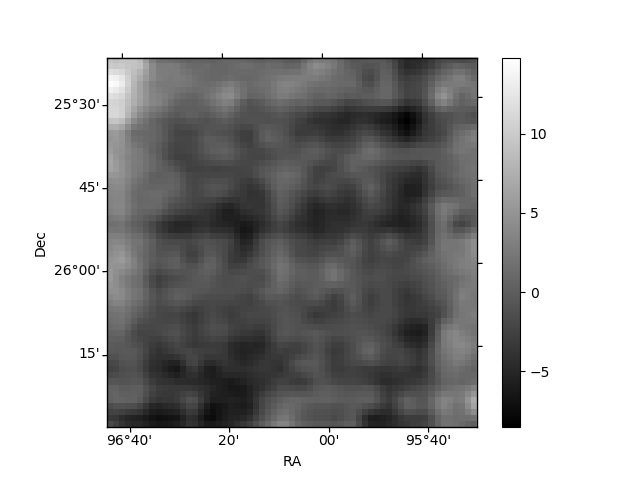
Histogram calculated using DETX and DETY for each event in the final _common_clean file
| Quadrant A | 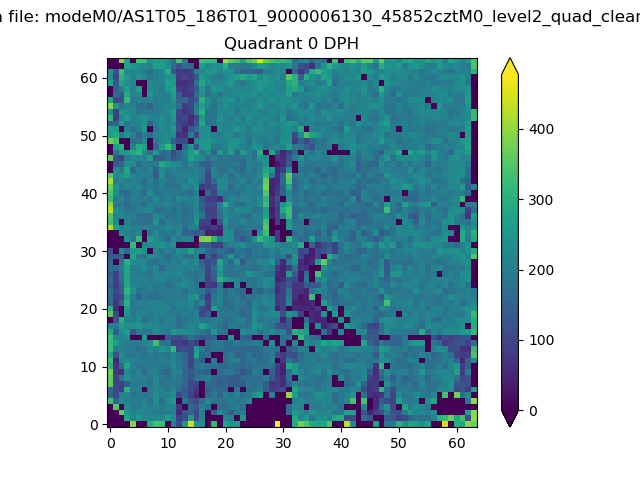 |
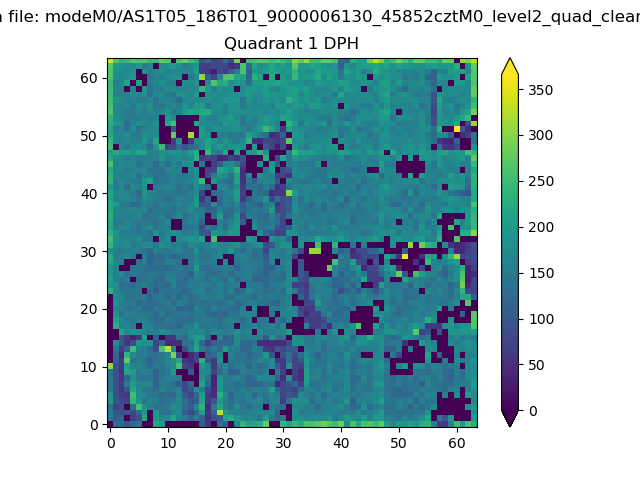 |
Quadrant B |
|---|---|---|---|
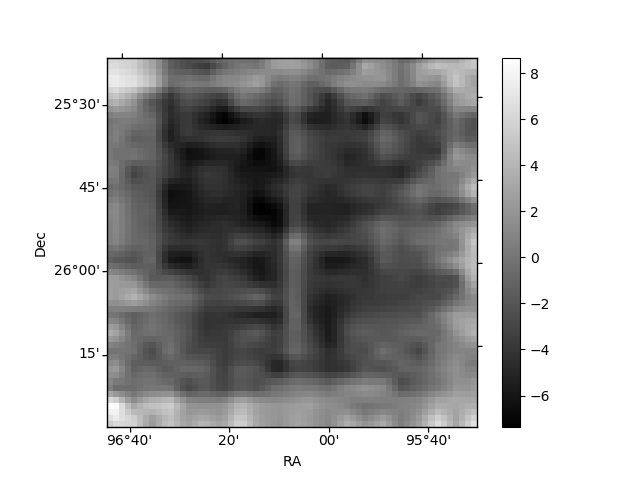
| Quadrant D | 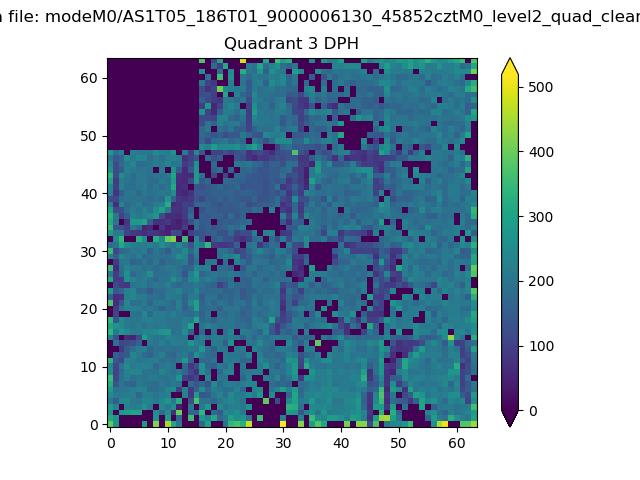 |
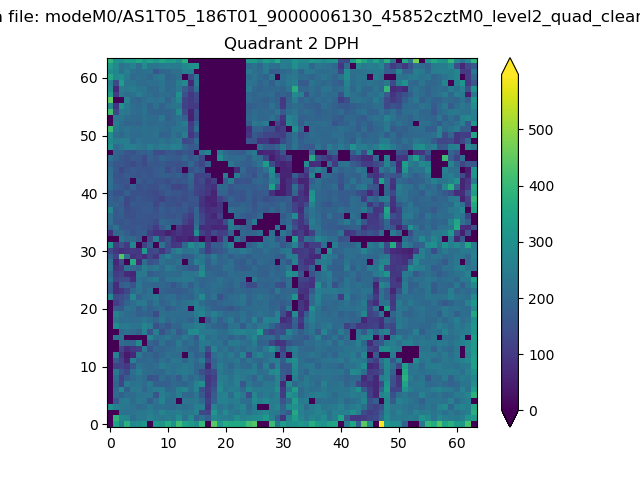 |
Quadrant C |
| Plot type | Count rate plots | Images |
|---|---|---|
| Comparison with Poisson distribution Blue bars denote a histogram of data divided into 1 sec bins. Red curve is a Poisson curve with rate = median count rate of data. |
 |
 |
| Quadrant-wise count rates Data is divided into 100 sec bins |
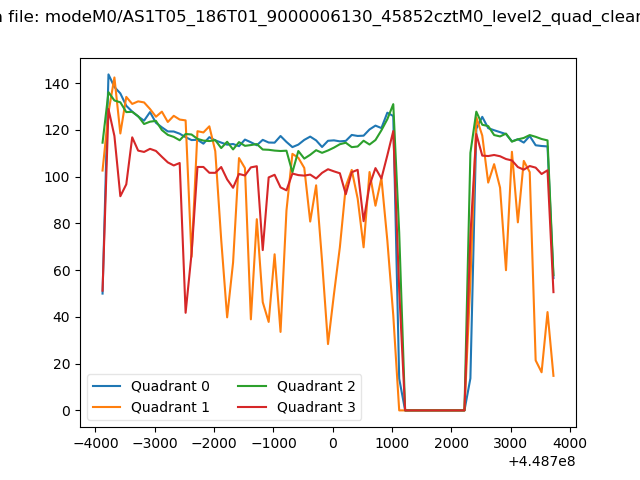 |
|
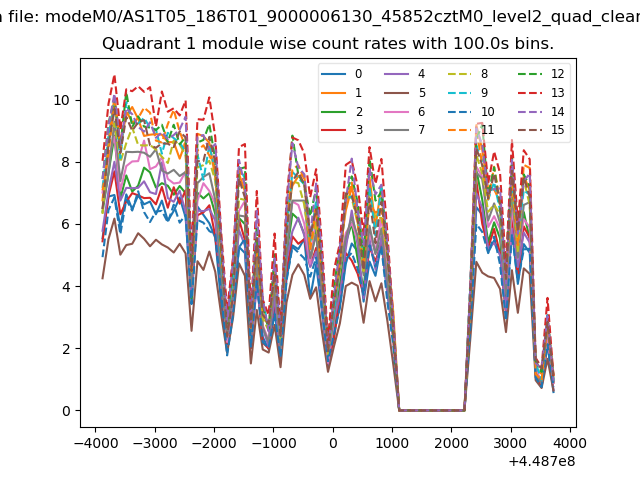
| Module-wise count rates for Quadrant A Data is divided into 100 sec bins |
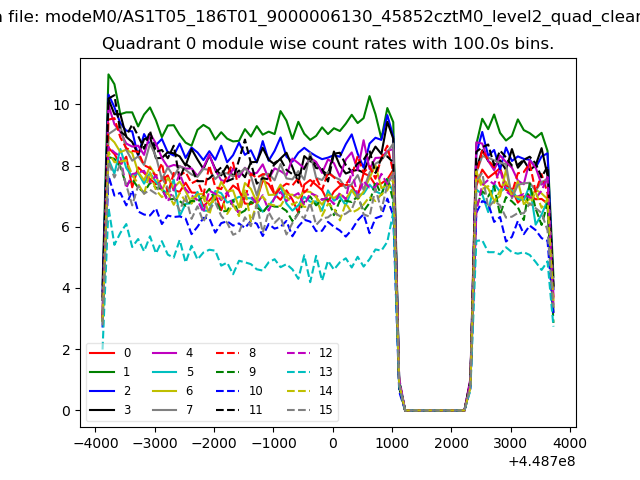 |
 |
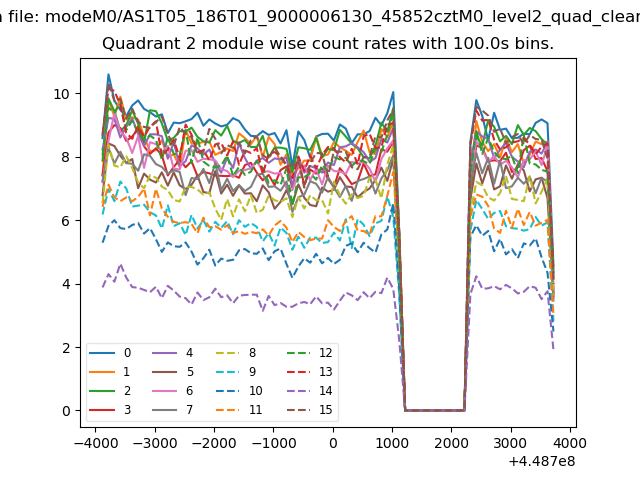
| Module-wise count rates for Quadrant B Data is divided into 100 sec bins |
 |
 |
| Module-wise count rates for Quadrant C Data is divided into 100 sec bins |
 |
 |
| Module-wise count rates for Quadrant D Data is divided into 100 sec bins |
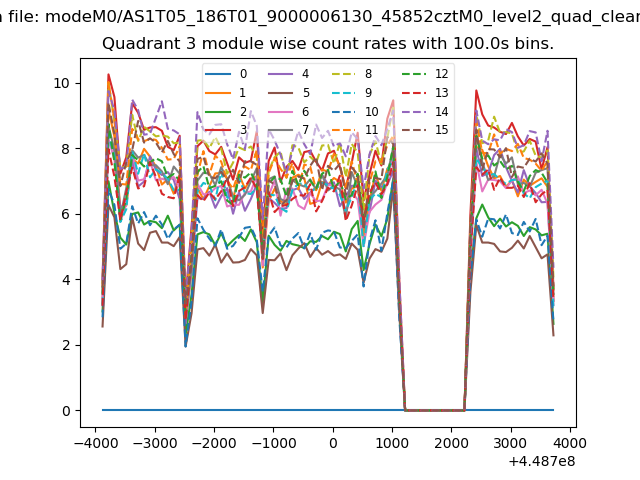 |
 |
| Parameter | Plot |
|---|---|
| CZT HV Monitor | 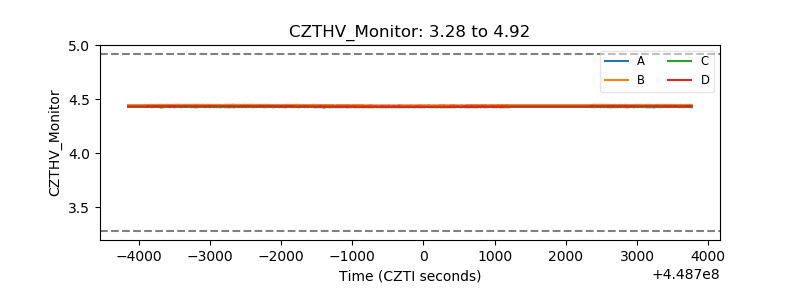 |
| D_VDD | 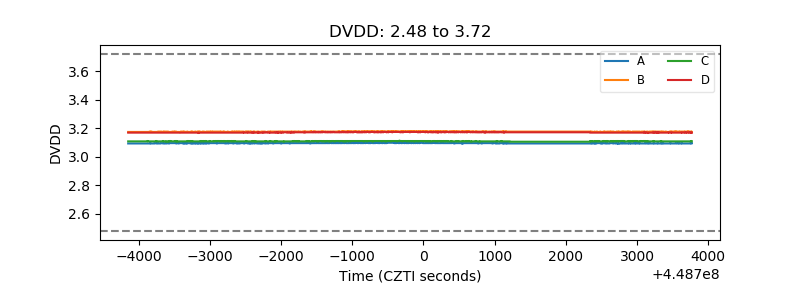 |
| Temperature 1 | 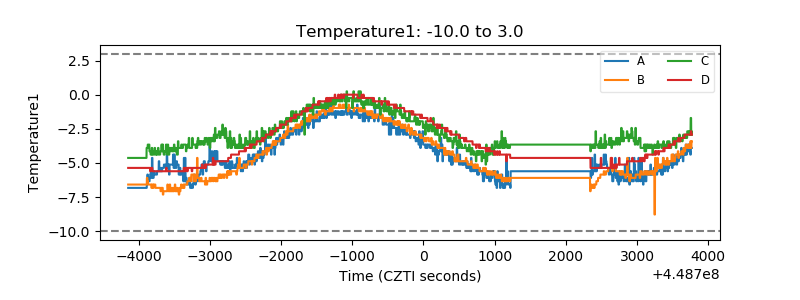 |
| Veto HV Monitor | 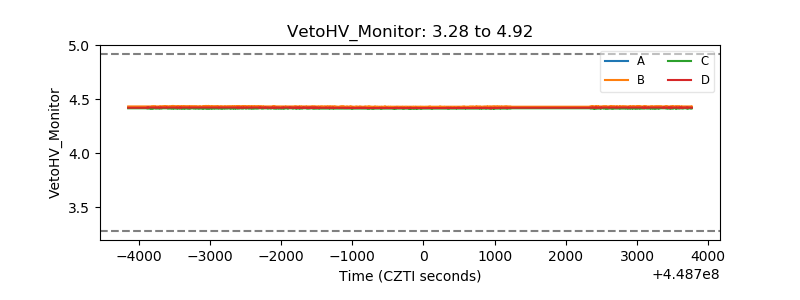 |
| Veto LLD | 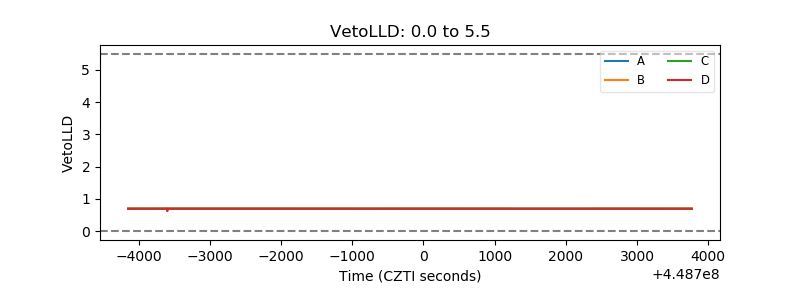 |
| Alpha Counter | 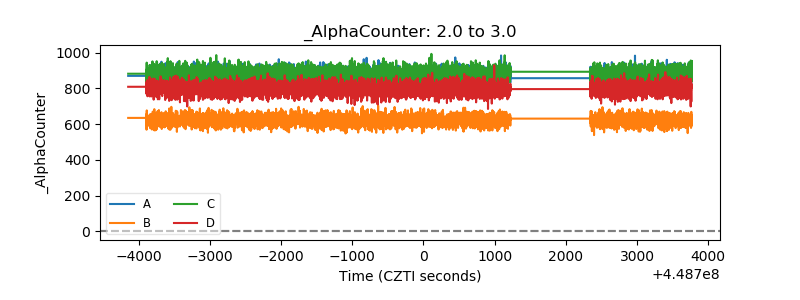 |
| _CPM_Rate | 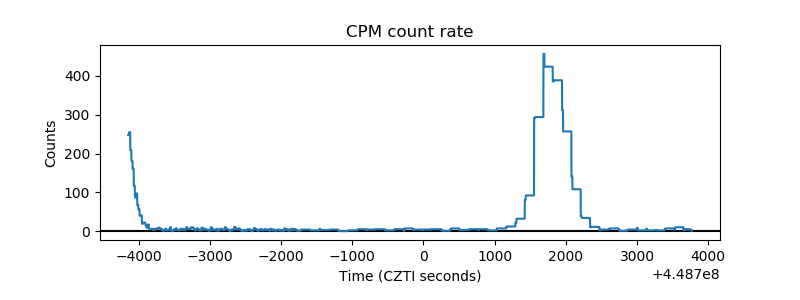 |
| CZT Counter | 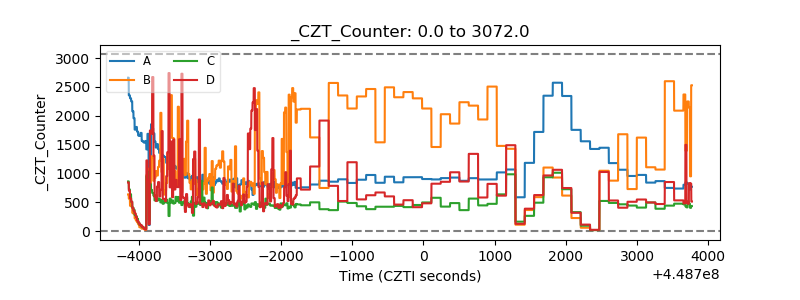 |
| +2.5 Volts monitor | 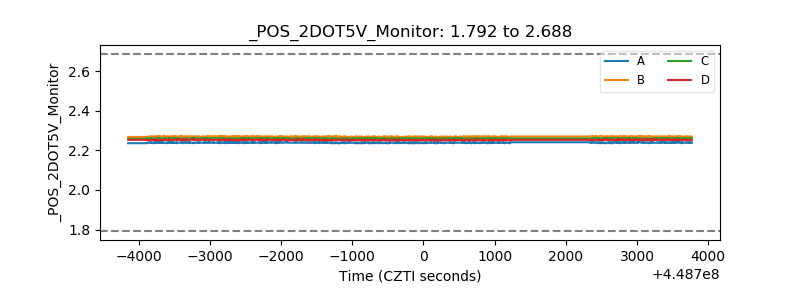 |
| +5 Volts monitor | 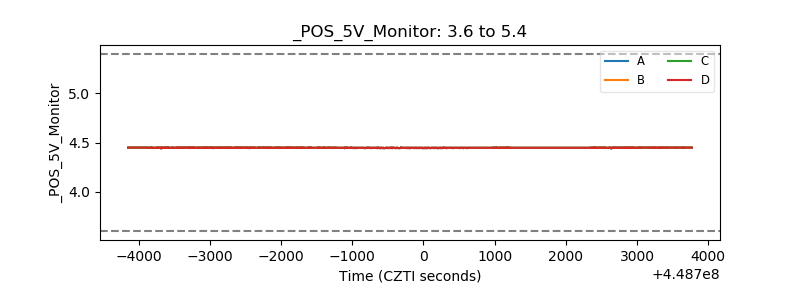 |
| _ROLL_ROT | 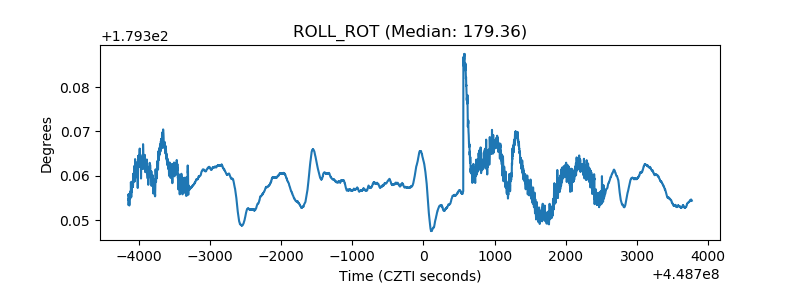 |
| _Roll_DEC | 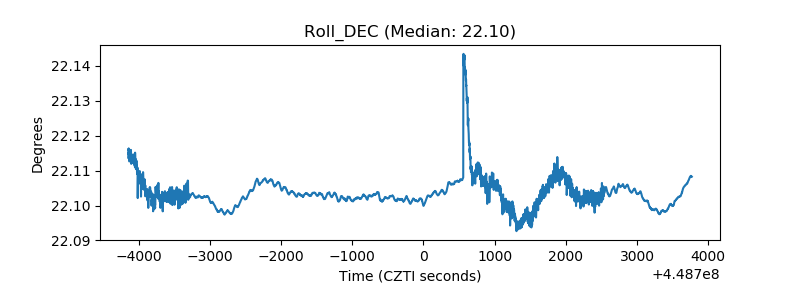 |
| _Roll_RA | 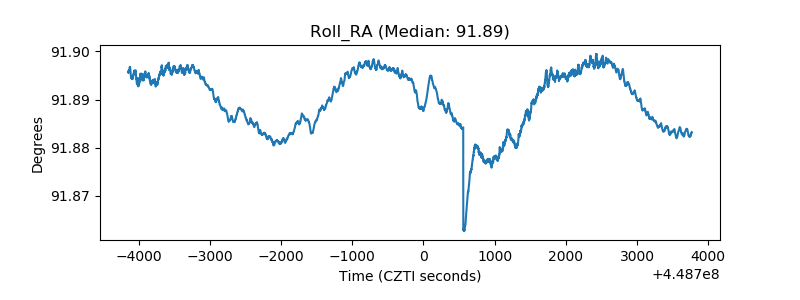 |
| Veto Counter | 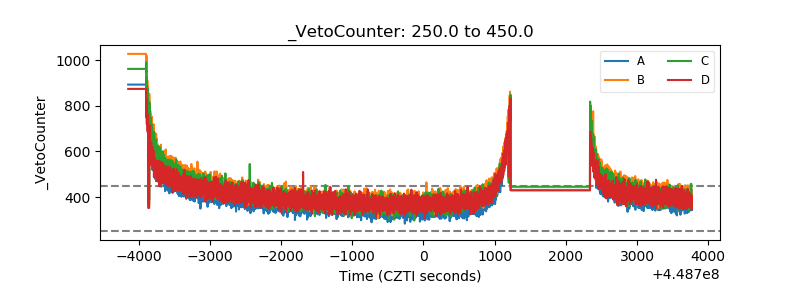 |