| Param | Original file | Final file |
|---|---|---|
| Filename | modeM0/AS1T05_186T01_9000006130_45853cztM0_level2.fits | modeM0/AS1T05_186T01_9000006130_45853cztM0_level2_quad_clean.evt |
| Size (bytes) | 310,639,680 | 44,930,880 |
| Size | 296.2 MB | 42.8 MB |
| Events in quadrant A | 2,591,864 | 321,825 |
| Events in quadrant B | 4,795,172 | 228,337 |
| Events in quadrant C | 1,302,969 | 329,452 |
| Events in quadrant D | 2,584,308 | 275,646 |
| Mode M0 | |||
|---|---|---|---|
| Quadrant | BADHDUFLAG | Total packets | Discarded packets |
| A | 0 | 9463 | 1 |
| B | 0 | 16251 | 1 |
| C | 0 | 5857 | 1 |
| D | 0 | 9583 | 1 |
| Mode M9 | |||
|---|---|---|---|
| Quadrant | BADHDUFLAG | Total packets | Discarded packets |
| A | 0 | 1 | 0 |
| B | 0 | 2 | 0 |
| C | 0 | 2 | 0 |
| D | 0 | 2 | 0 |
| Mode SS | |||
|---|---|---|---|
| Quadrant | BADHDUFLAG | Total packets | Discarded packets |
| A | 0 | 58 | 0 |
| B | 0 | 58 | 0 |
| C | 0 | 58 | 0 |
| D | 0 | 58 | 0 |
| Quadrant | Total seconds | Saturated seconds | Saturation percentage |
|---|---|---|---|
| A | 2875 | 102 | 3.547826% |
| B | 2875 | 1242 | 43.200000% |
| C | 2875 | 8 | 0.278261% |
| D | 2875 | 300 | 10.434783% |
Noise dominated data is calculated using 1-second bins in cleaned event files. If a bin has >2000 counts, and if more than 50% of those come from <1% of pixels, then it is considered to be noise-dominated and hence unusable.
| Quadrant | # 1 sec bins | Bins with >0 counts | Bins with >2000 counts | High rate bins dominated by noise | Noise dominated (total time) | Noise dominated (detector-on time) | Marked lightcurve |
|---|---|---|---|---|---|---|---|
| A | 2875 | 2875 | 2 | 2 | 0.07% | 0.07% | 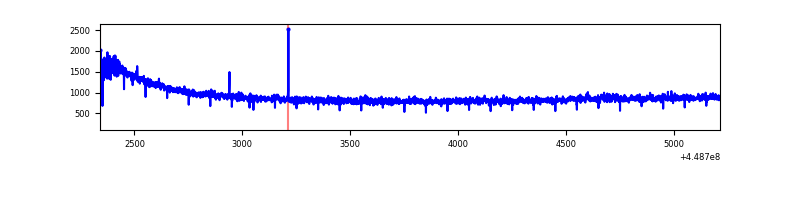 |
| B | 2875 | 2875 | 847 | 847 | 29.46% | 29.46% | 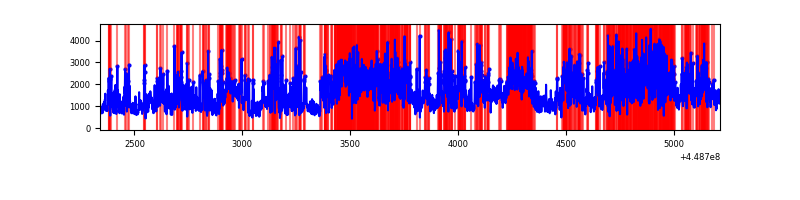 |
| C | 2875 | 2875 | 0 | 0 | 0.00% | 0.00% | 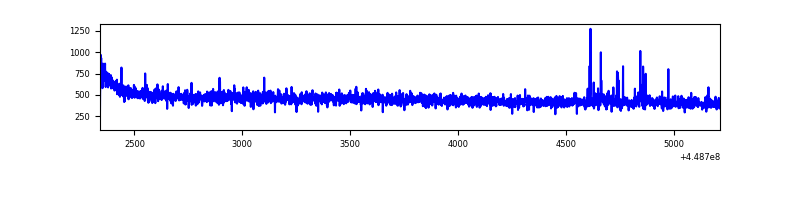 |
| D | 2875 | 2875 | 241 | 241 | 8.38% | 8.38% | 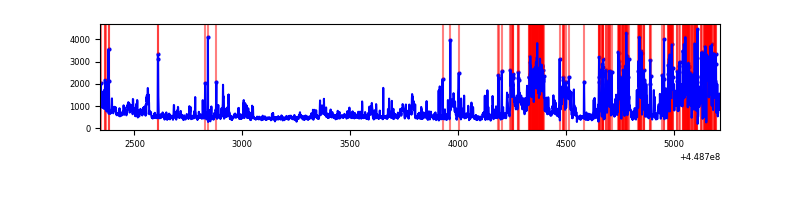 |
Top three noisy pixels from each quadrant. If the there are fewer than three noisy pixels in the level2.evt file, extra rows are filled as -1
| Pixel properties | Quadrant properties | ||||||
|---|---|---|---|---|---|---|---|
| Quadrant | DetID | PixID | Counts | Sigma | Mean | Median | Sigma |
| A | 10 | 83 | 1268366 | 17813.68 | 337 | 331 | 71.2 |
| A | 12 | 189 | 9444 | 128.02 | 337 | 331 | 71.2 |
| A | 13 | 254 | 3781 | 48.47 | 337 | 331 | 71.2 |
| B | 3 | 112 | 3425953 | 58969.17 | 292 | 283 | 58.1 |
| B | 0 | 190 | 80562 | 1381.92 | 292 | 283 | 58.1 |
| B | 0 | 171 | 34163 | 583.21 | 292 | 283 | 58.1 |
| C | 12 | 249 | 11679 | 142.57 | 331 | 332 | 79.6 |
| C | 13 | 61 | 2271 | 24.36 | 331 | 332 | 79.6 |
| C | 3 | 233 | 1754 | 17.87 | 331 | 332 | 79.6 |
| D | 1 | 52 | 584692 | 7037.01 | 320 | 309 | 83.0 |
| D | 12 | 2 | 492382 | 5925.44 | 320 | 309 | 83.0 |
| D | 2 | 249 | 54203 | 648.98 | 320 | 309 | 83.0 |
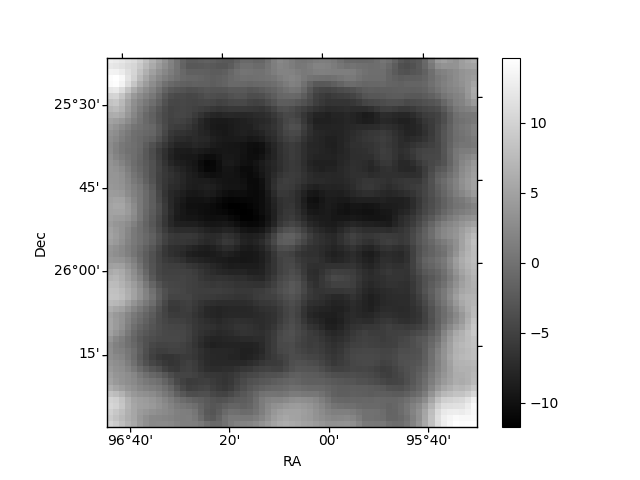
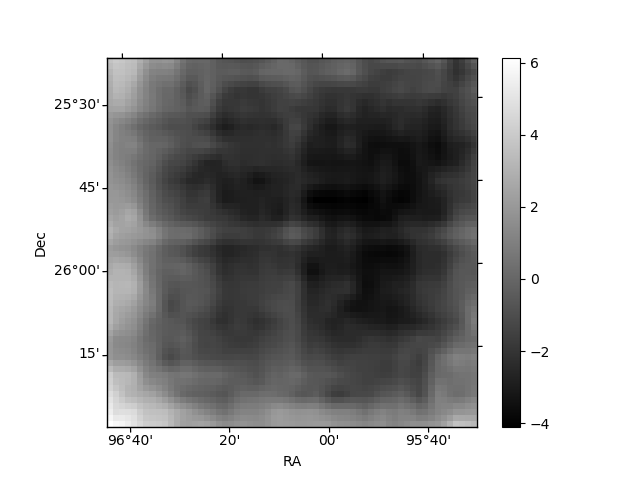
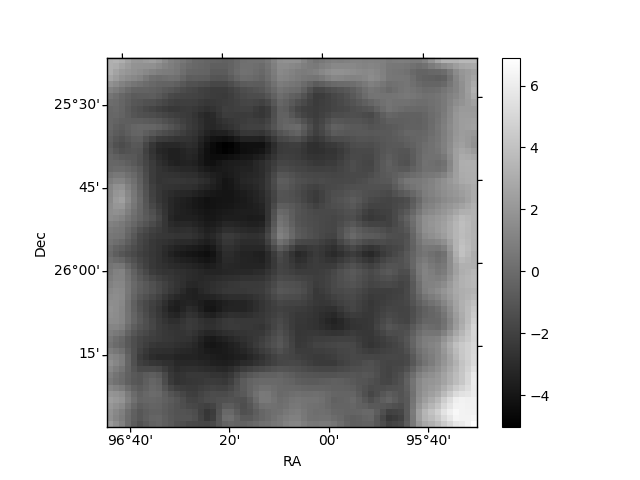
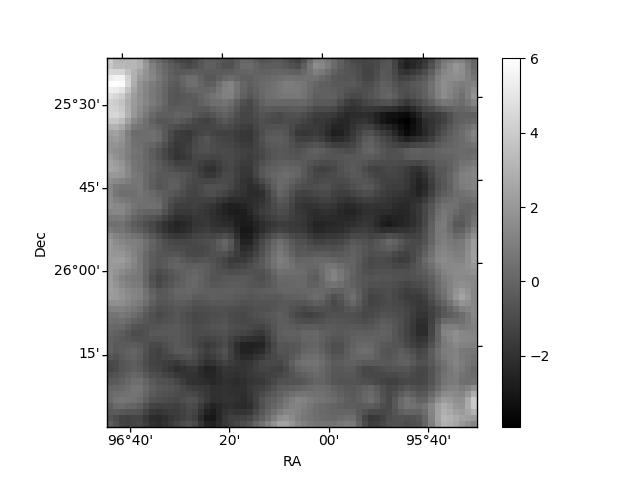
Histogram calculated using DETX and DETY for each event in the final _common_clean file
| Quadrant A | 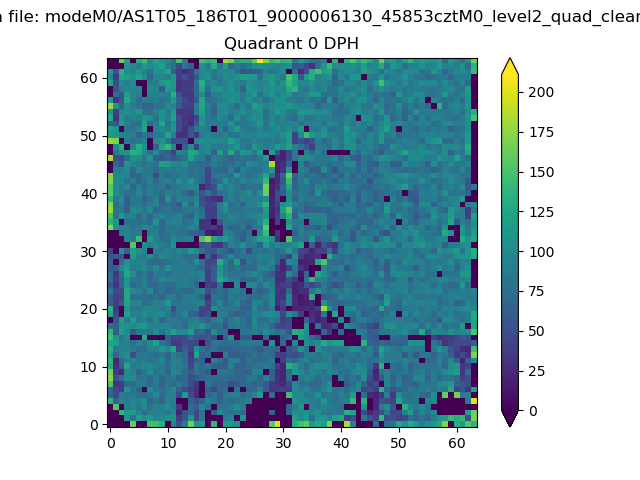 |
 |
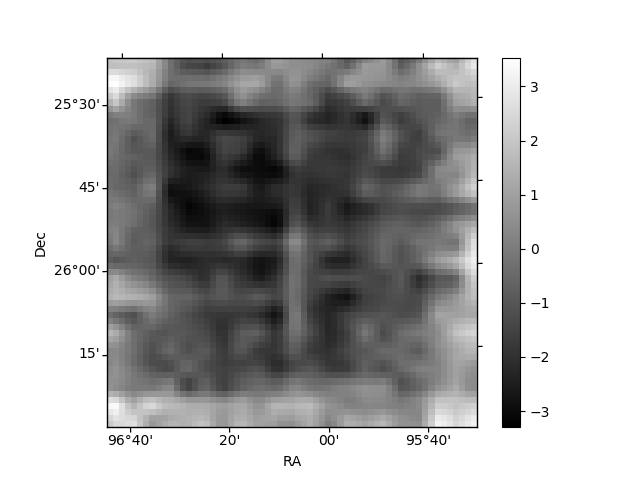
Quadrant B |
|---|---|---|---|
| Quadrant D | 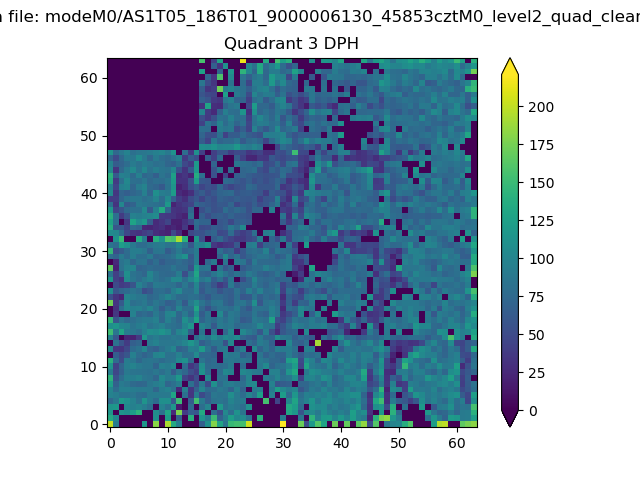 |
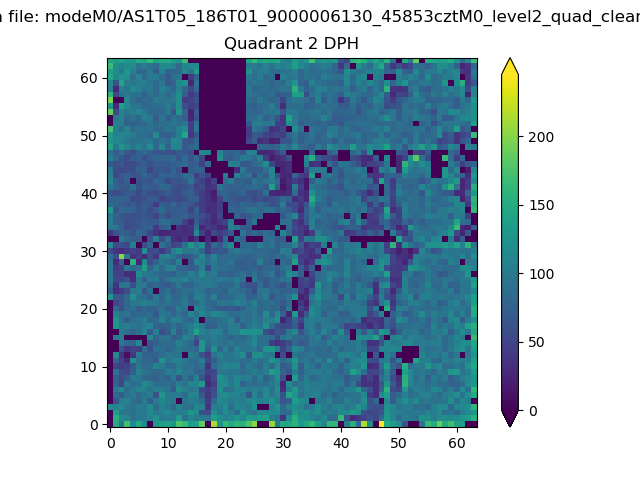 |
Quadrant C |
| Plot type | Count rate plots | Images |
|---|---|---|
| Comparison with Poisson distribution Blue bars denote a histogram of data divided into 1 sec bins. Red curve is a Poisson curve with rate = median count rate of data. |
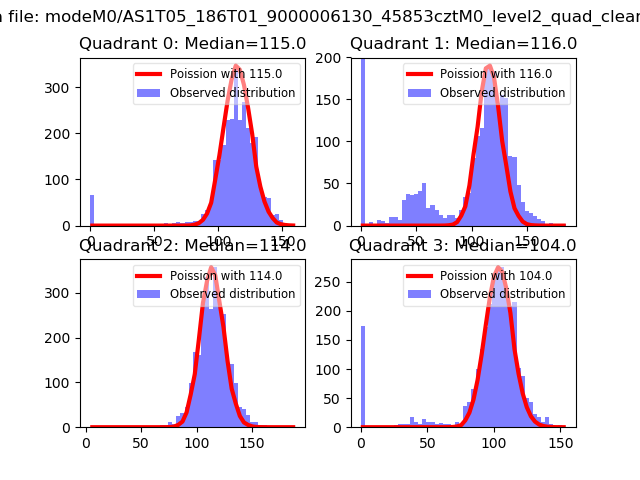 |
 |
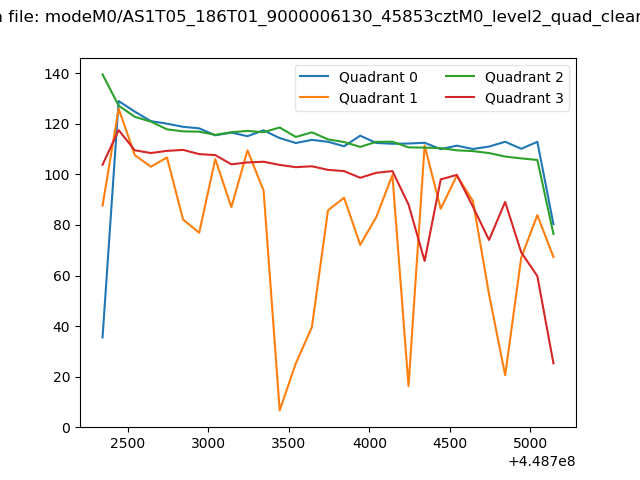
| Quadrant-wise count rates Data is divided into 100 sec bins |
 |
|
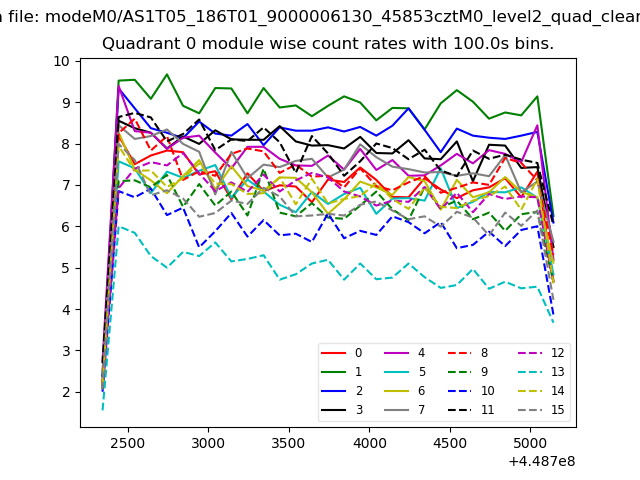
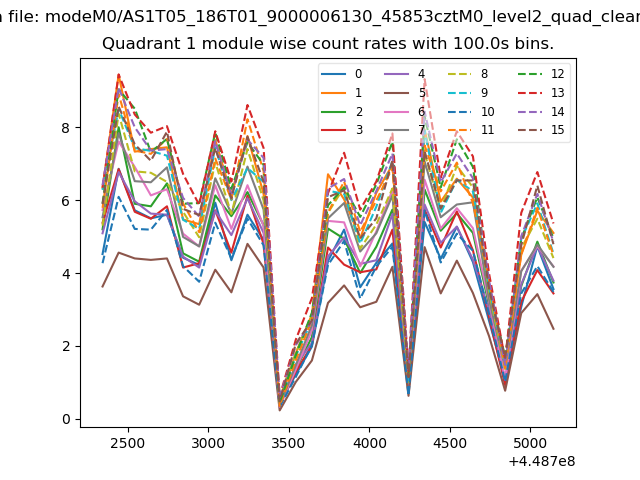
| Module-wise count rates for Quadrant A Data is divided into 100 sec bins |
 |
 |
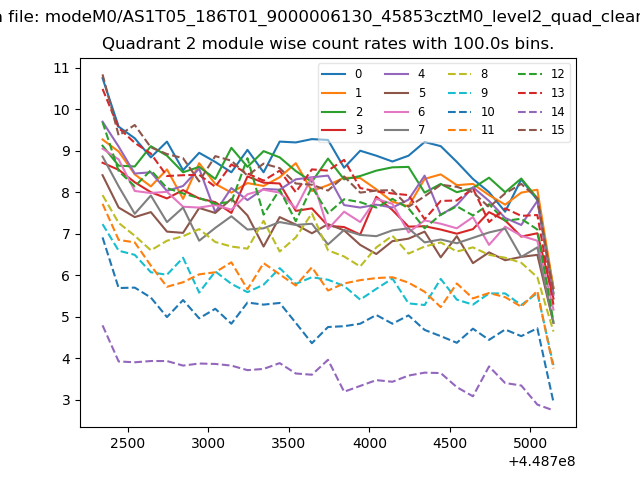
| Module-wise count rates for Quadrant B Data is divided into 100 sec bins |
 |
 |
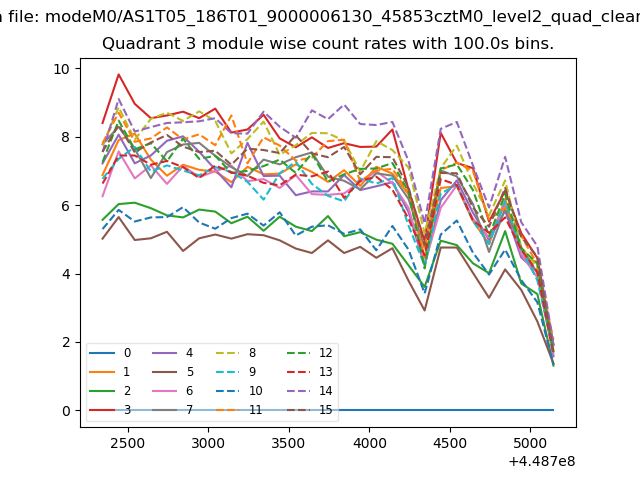
| Module-wise count rates for Quadrant C Data is divided into 100 sec bins |
 |
 |
| Module-wise count rates for Quadrant D Data is divided into 100 sec bins |
 |
 |
| Parameter | Plot |
|---|---|
| CZT HV Monitor | 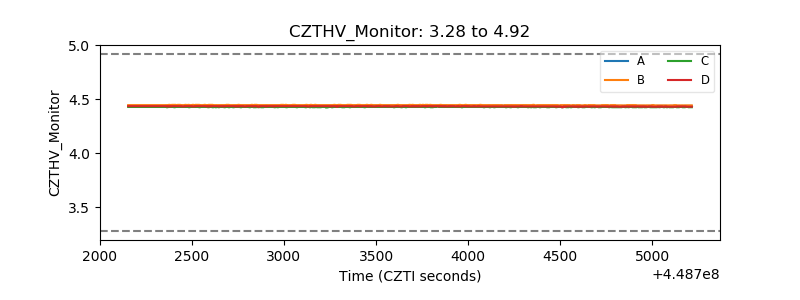 |
| D_VDD | 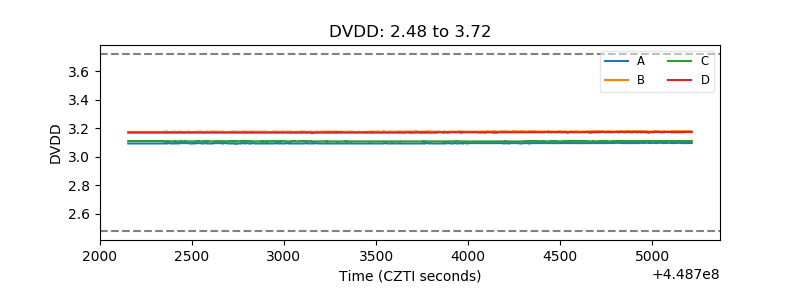 |
| Temperature 1 | 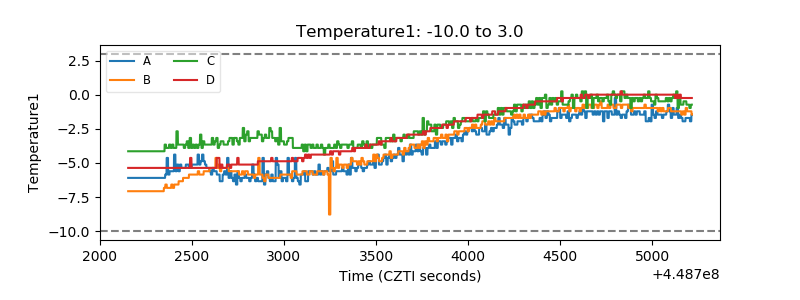 |
| Veto HV Monitor | 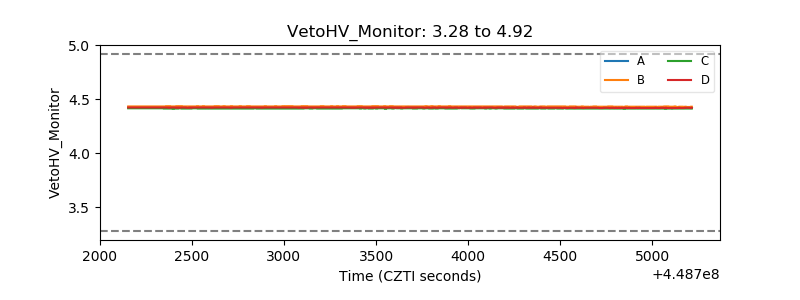 |
| Veto LLD | 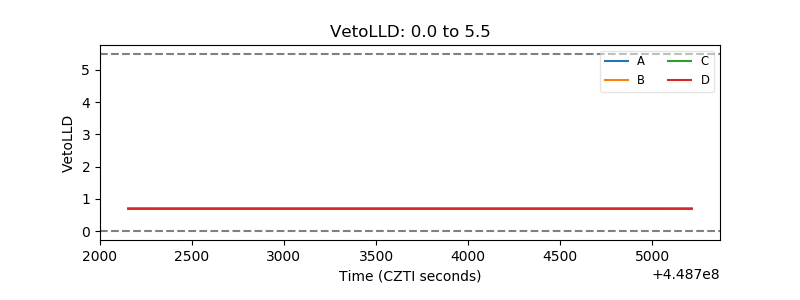 |
| Alpha Counter | 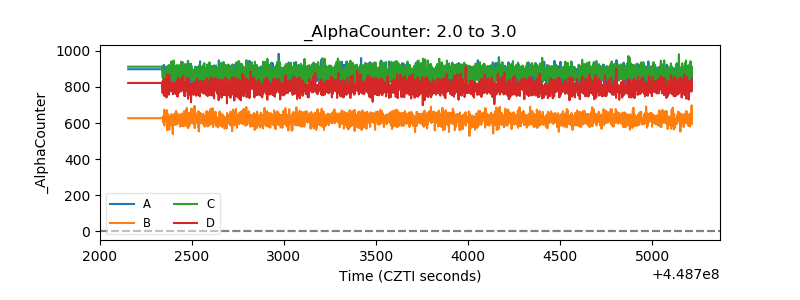 |
| _CPM_Rate | 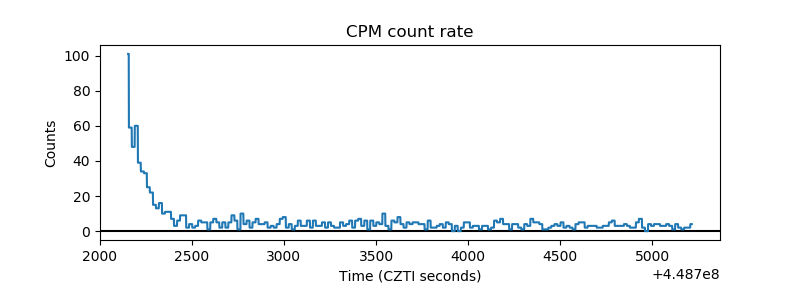 |
| CZT Counter | 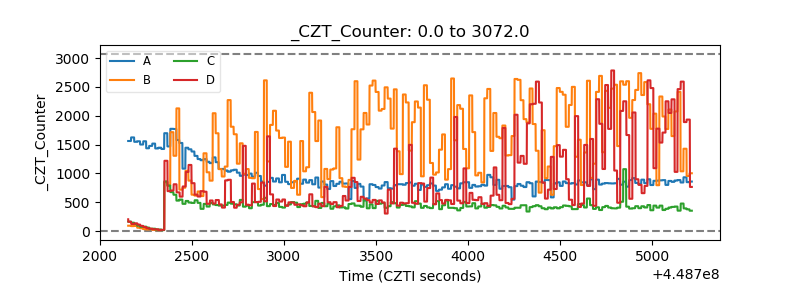 |
| +2.5 Volts monitor | 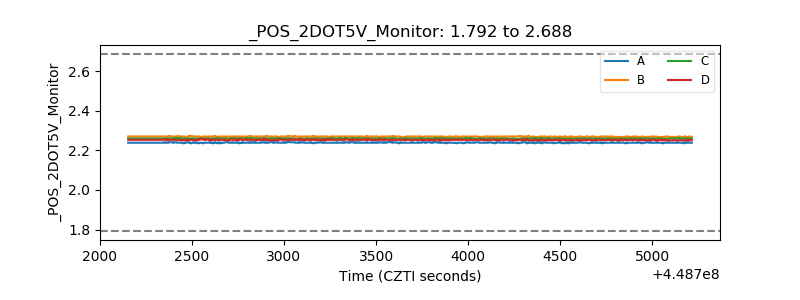 |
| +5 Volts monitor | 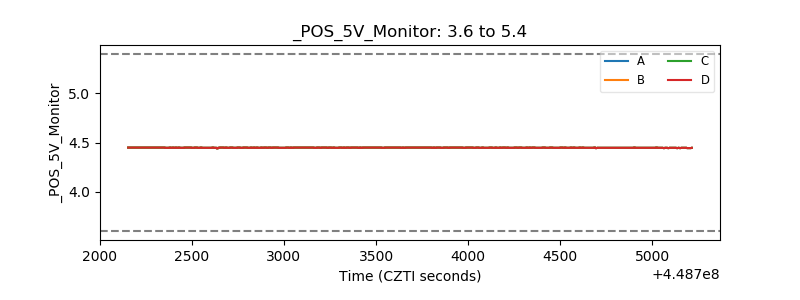 |
| _ROLL_ROT | 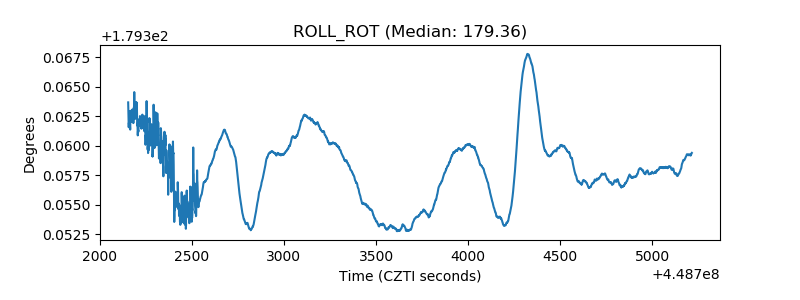 |
| _Roll_DEC | 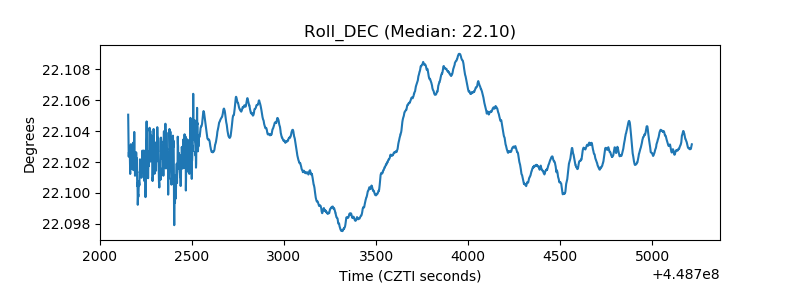 |
| _Roll_RA | 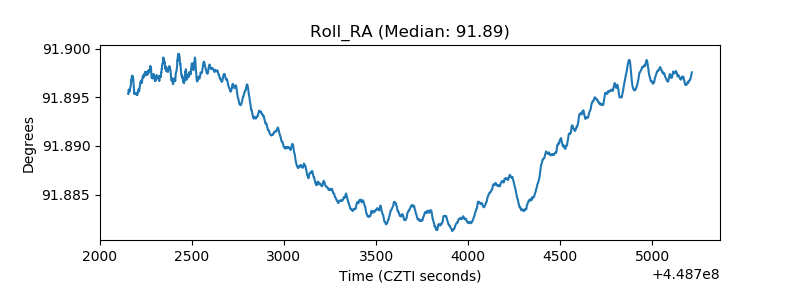 |
| Veto Counter | 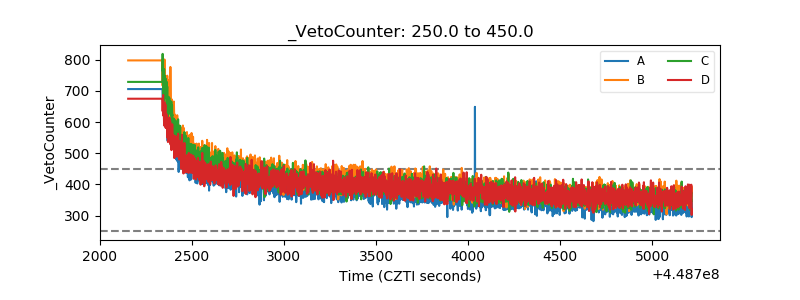 |