| Param | Original file | Final file |
|---|---|---|
| Filename | modeM0/AS1T05_187T01_9000006132_45854cztM0_level2.fits | modeM0/AS1T05_187T01_9000006132_45854cztM0_level2_quad_clean.evt |
| Size (bytes) | 687,237,120 | 102,513,600 |
| Size | 655.4 MB | 97.8 MB |
| Events in quadrant A | 5,833,646 | 720,921 |
| Events in quadrant B | 10,931,180 | 536,705 |
| Events in quadrant C | 3,093,972 | 736,288 |
| Events in quadrant D | 5,048,944 | 631,776 |
| Mode SS | |||
|---|---|---|---|
| Quadrant | BADHDUFLAG | Total packets | Discarded packets |
| A | 0 | 138 | 0 |
| B | 0 | 138 | 0 |
| C | 0 | 138 | 0 |
| D | 0 | 138 | 0 |
| Mode M9 | |||
|---|---|---|---|
| Quadrant | BADHDUFLAG | Total packets | Discarded packets |
| A | 0 | 6 | 0 |
| B | 0 | 6 | 0 |
| C | 0 | 6 | 0 |
| D | 0 | 6 | 0 |
| Mode M0 | |||
|---|---|---|---|
| Quadrant | BADHDUFLAG | Total packets | Discarded packets |
| A | 0 | 21375 | 1 |
| B | 0 | 37292 | 1 |
| C | 0 | 14247 | 1 |
| D | 0 | 19561 | 1 |
| Quadrant | Total seconds | Saturated seconds | Saturation percentage |
|---|---|---|---|
| A | 6864 | 272 | 3.962704% |
| B | 6865 | 2631 | 38.324836% |
| C | 6865 | 103 | 1.500364% |
| D | 6865 | 485 | 7.064822% |
Noise dominated data is calculated using 1-second bins in cleaned event files. If a bin has >2000 counts, and if more than 50% of those come from <1% of pixels, then it is considered to be noise-dominated and hence unusable.
| Quadrant | # 1 sec bins | Bins with >0 counts | Bins with >2000 counts | High rate bins dominated by noise | Noise dominated (total time) | Noise dominated (detector-on time) | Marked lightcurve |
|---|---|---|---|---|---|---|---|
| A | 7404 | 6865 | 1 | 1 | 0.01% | 0.01% | 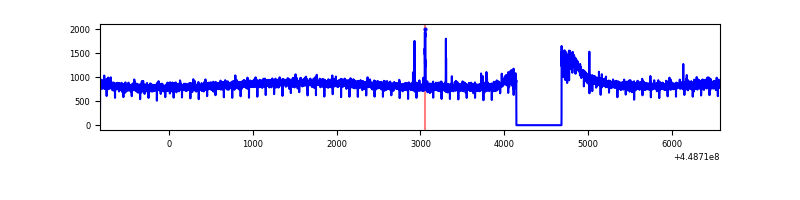 |
| B | 7405 | 6865 | 1672 | 1672 | 22.58% | 24.36% | 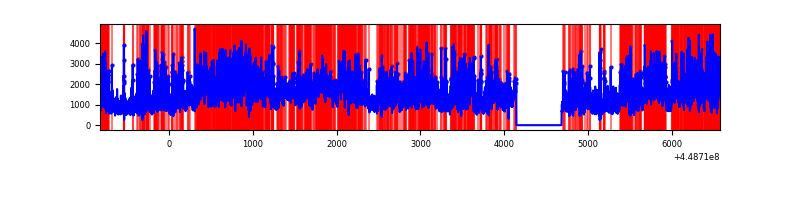 |
| C | 7405 | 6866 | 2 | 2 | 0.03% | 0.03% | 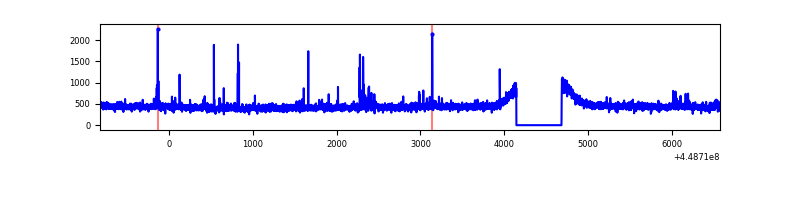 |
| D | 7405 | 6866 | 281 | 281 | 3.79% | 4.09% | 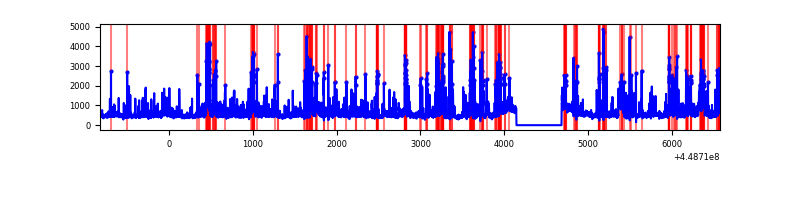 |
Top three noisy pixels from each quadrant. If the there are fewer than three noisy pixels in the level2.evt file, extra rows are filled as -1
| Pixel properties | Quadrant properties | ||||||
|---|---|---|---|---|---|---|---|
| Quadrant | DetID | PixID | Counts | Sigma | Mean | Median | Sigma |
| A | 10 | 83 | 2821271 | 17451.82 | 772 | 753 | 161.6 |
| A | 7 | 191 | 14214 | 83.29 | 772 | 753 | 161.6 |
| A | 13 | 254 | 10463 | 60.08 | 772 | 753 | 161.6 |
| B | 3 | 112 | 7328854 | 54294.56 | 688 | 665 | 135.0 |
| B | 0 | 171 | 424750 | 3142.05 | 688 | 665 | 135.0 |
| B | 2 | 2 | 85104 | 625.61 | 688 | 665 | 135.0 |
| C | 14 | 254 | 62199 | 341.42 | 770 | 772 | 179.9 |
| C | 12 | 249 | 21629 | 115.93 | 770 | 772 | 179.9 |
| C | 3 | 233 | 6113 | 29.69 | 770 | 772 | 179.9 |
| D | 13 | 249 | 509087 | 2674.12 | 751 | 728 | 190.1 |
| D | 1 | 52 | 457466 | 2402.58 | 751 | 728 | 190.1 |
| D | 12 | 2 | 367391 | 1928.76 | 751 | 728 | 190.1 |
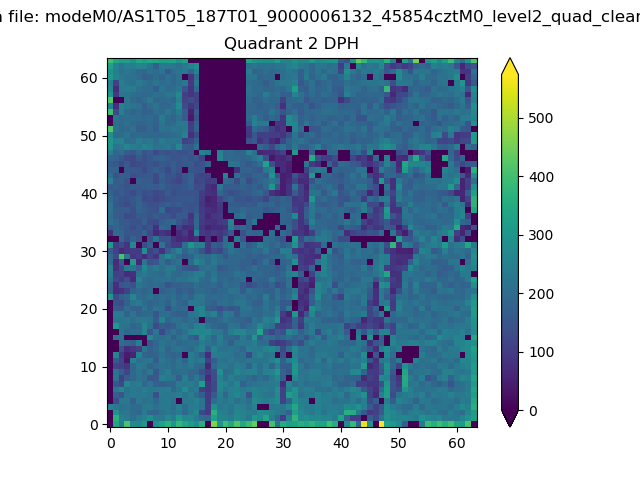
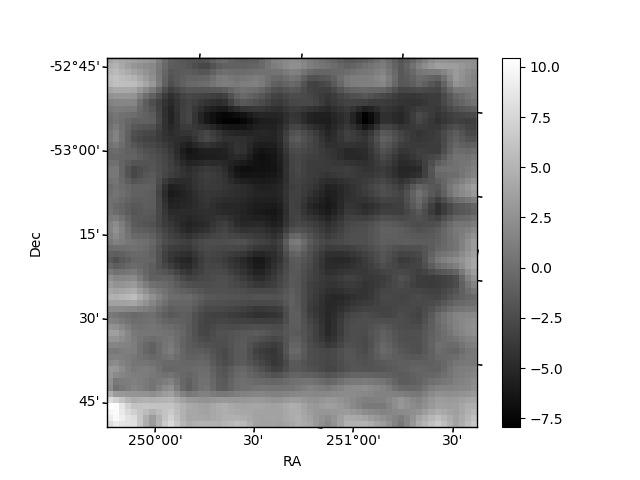
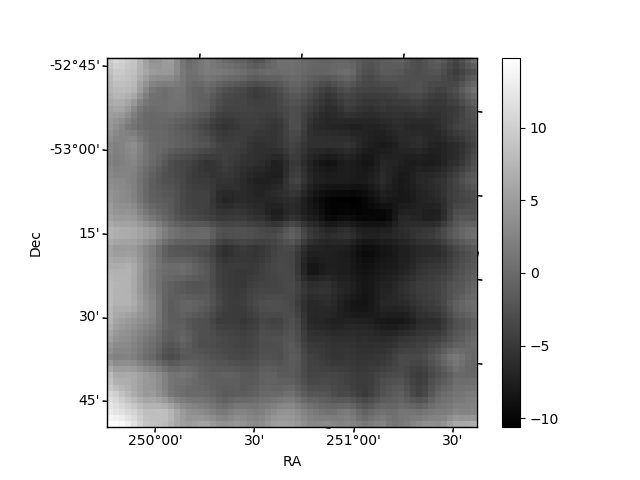
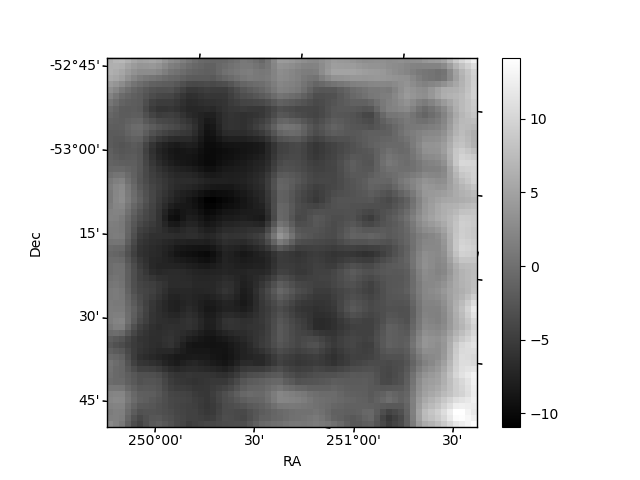
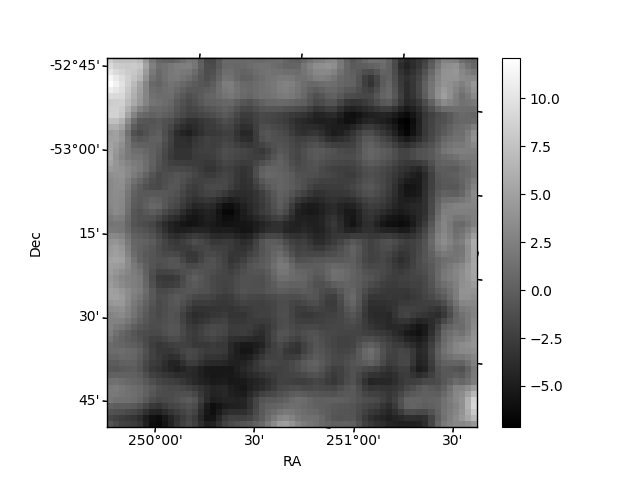
Histogram calculated using DETX and DETY for each event in the final _common_clean file
| Quadrant A | 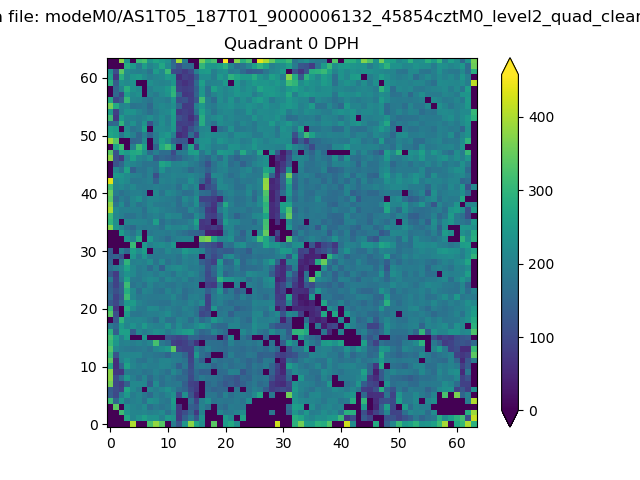 |
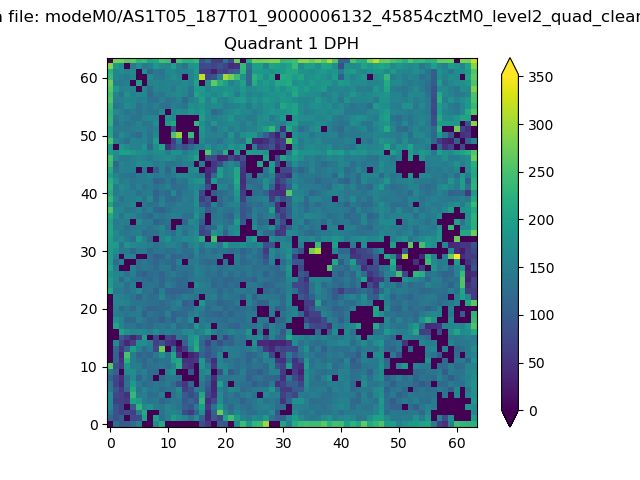 |
Quadrant B |
|---|---|---|---|
| Quadrant D | 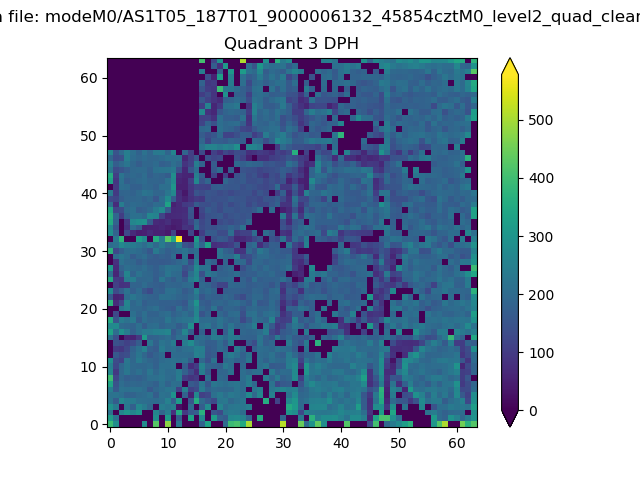 |
 |
Quadrant C |
| Plot type | Count rate plots | Images |
|---|---|---|
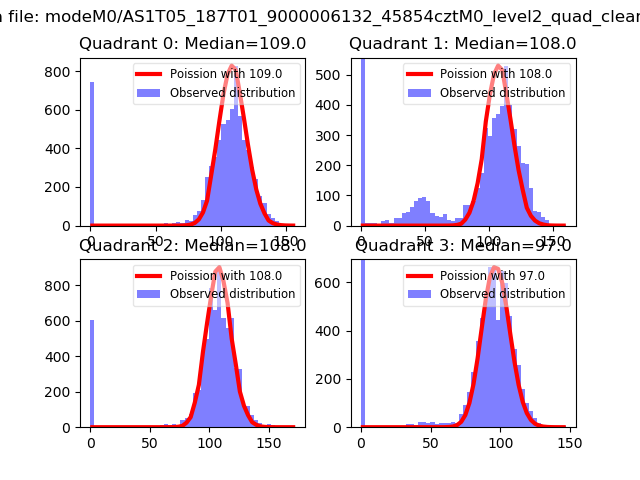
| Comparison with Poisson distribution Blue bars denote a histogram of data divided into 1 sec bins. Red curve is a Poisson curve with rate = median count rate of data. |
 |
 |
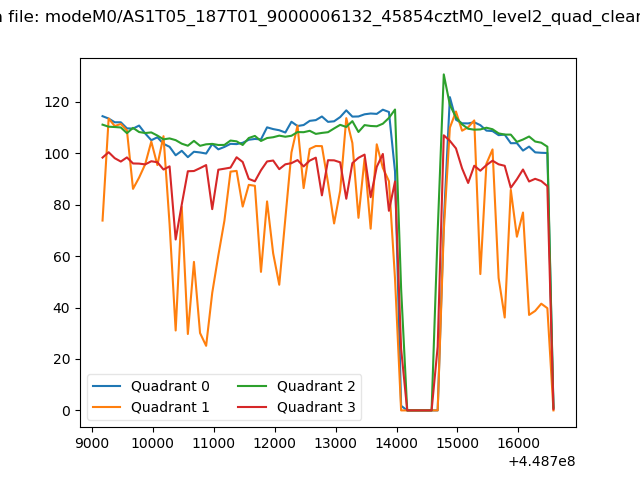
| Quadrant-wise count rates Data is divided into 100 sec bins |
 |
|
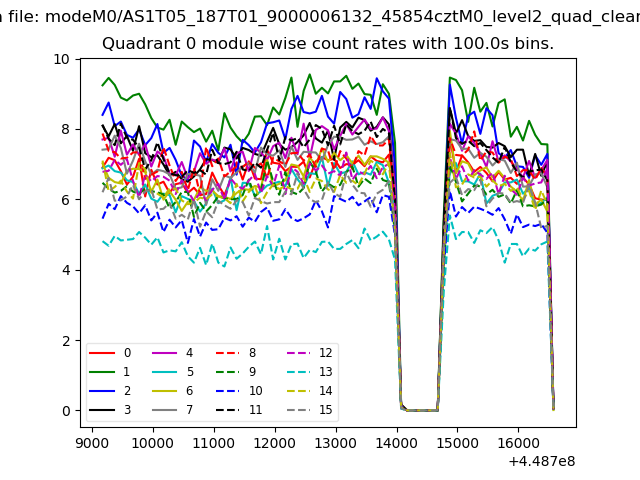
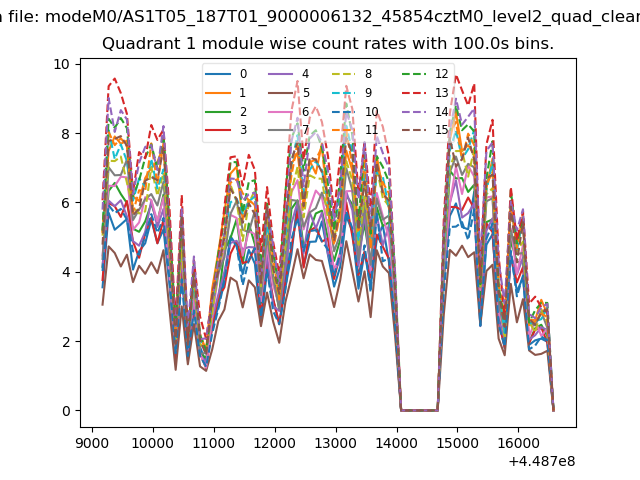
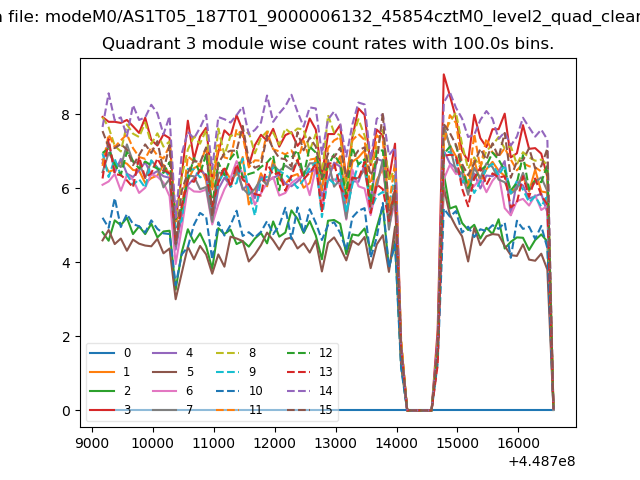
| Module-wise count rates for Quadrant A Data is divided into 100 sec bins |
 |
 |
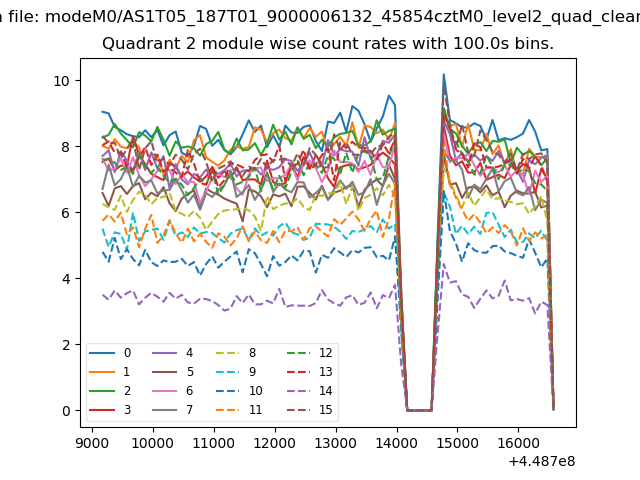
| Module-wise count rates for Quadrant B Data is divided into 100 sec bins |
 |
 |
| Module-wise count rates for Quadrant C Data is divided into 100 sec bins |
 |
 |
| Module-wise count rates for Quadrant D Data is divided into 100 sec bins |
 |
 |
| Parameter | Plot |
|---|---|
| CZT HV Monitor | 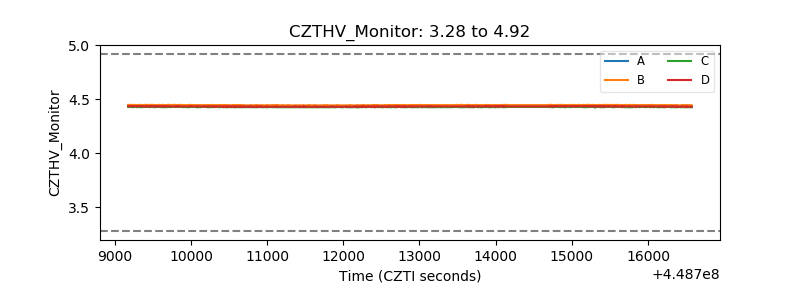 |
| D_VDD | 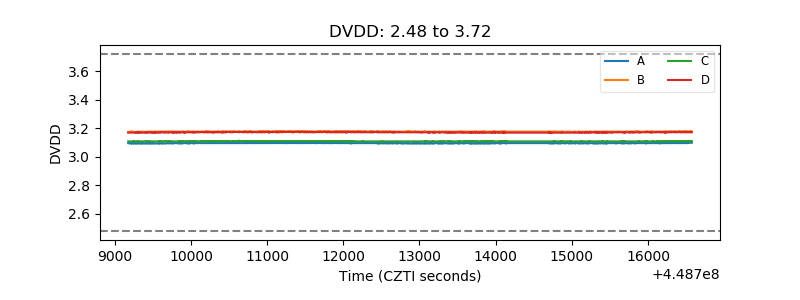 |
| Temperature 1 | 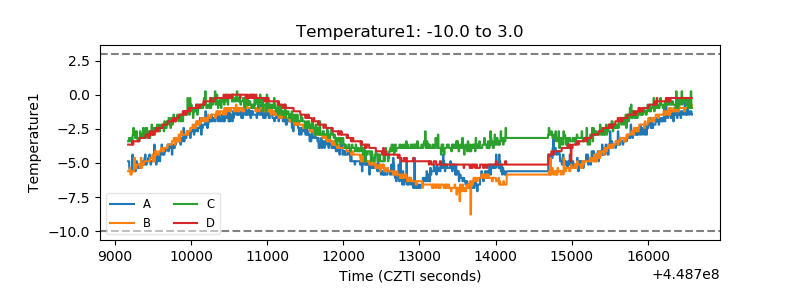 |
| Veto HV Monitor | 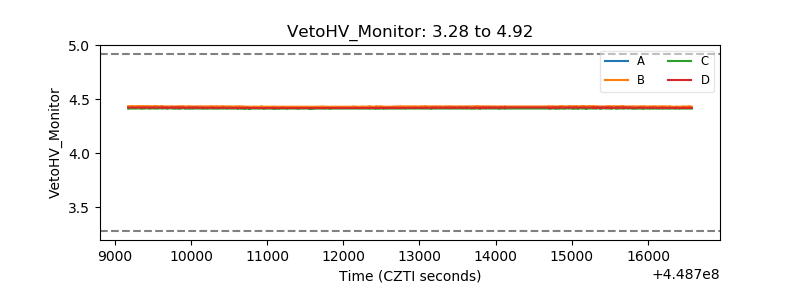 |
| Veto LLD | 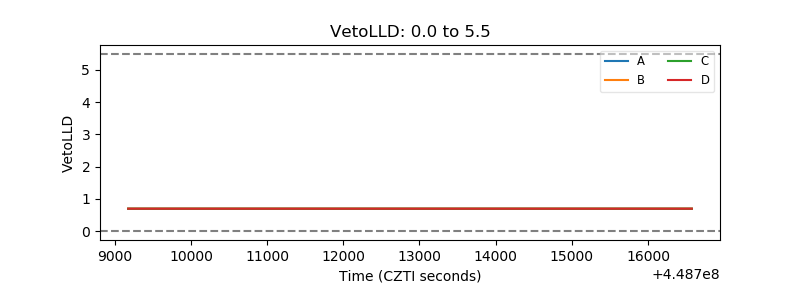 |
| Alpha Counter | 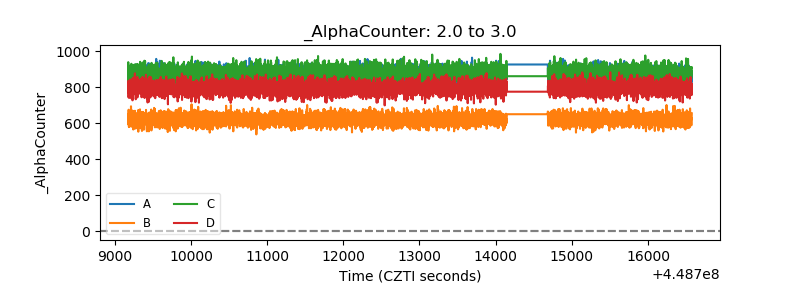 |
| _CPM_Rate | 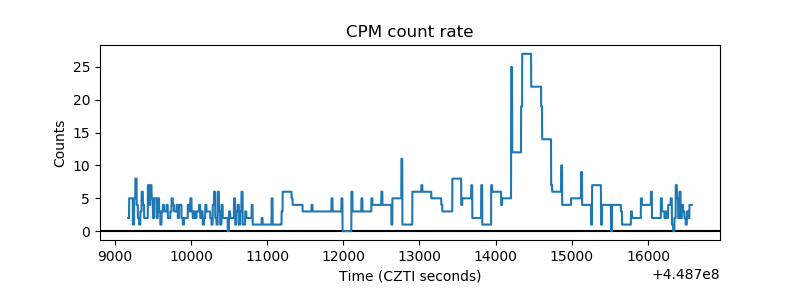 |
| CZT Counter | 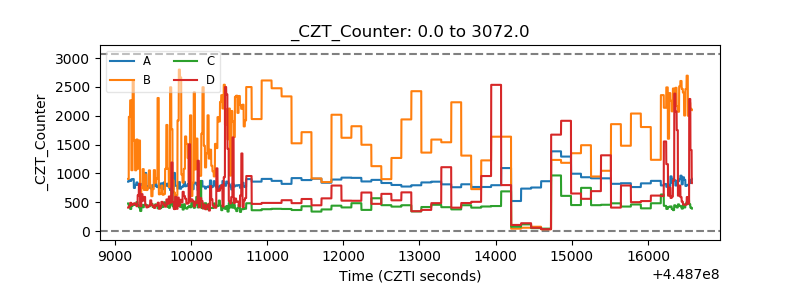 |
| +2.5 Volts monitor |  |
| +5 Volts monitor | 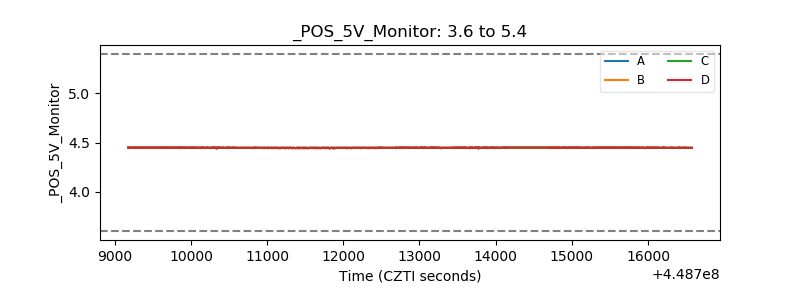 |
| _ROLL_ROT | 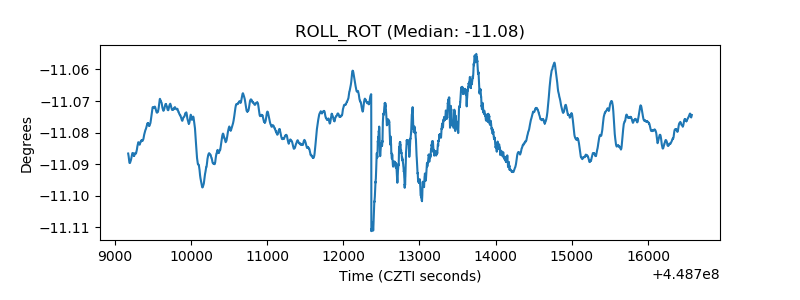 |
| _Roll_DEC | 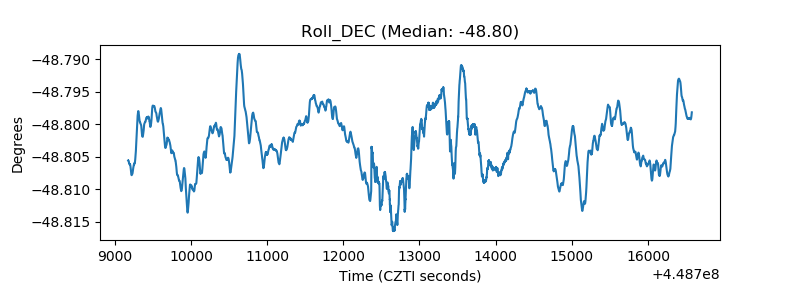 |
| _Roll_RA | 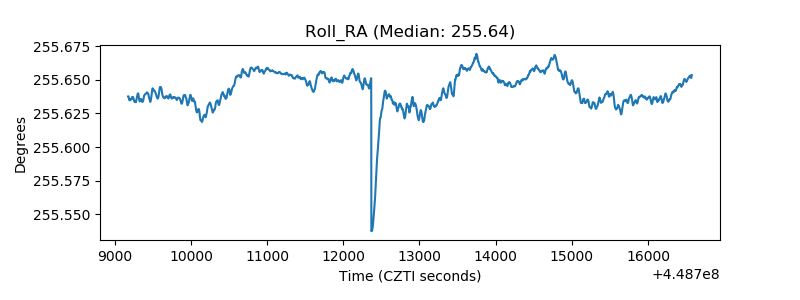 |
| Veto Counter | 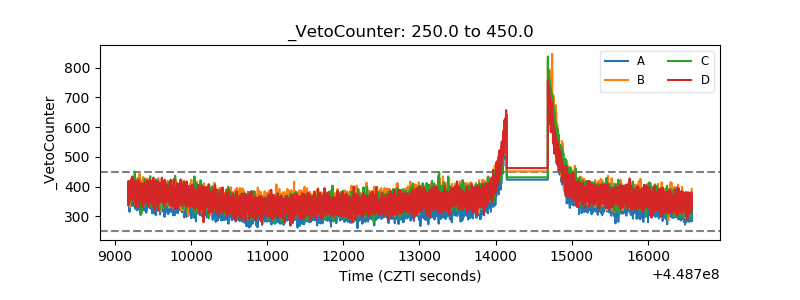 |