| Param | Original file | Final file |
|---|---|---|
| Filename | modeM0/AS1T05_187T01_9000006132_45855cztM0_level2.fits | modeM0/AS1T05_187T01_9000006132_45855cztM0_level2_quad_clean.evt |
| Size (bytes) | 779,898,240 | 114,085,440 |
| Size | 743.8 MB | 108.8 MB |
| Events in quadrant A | 6,555,468 | 790,817 |
| Events in quadrant B | 11,731,575 | 612,212 |
| Events in quadrant C | 3,594,530 | 819,959 |
| Events in quadrant D | 6,394,223 | 697,560 |
| Mode SS | |||
|---|---|---|---|
| Quadrant | BADHDUFLAG | Total packets | Discarded packets |
| A | 0 | 152 | 0 |
| B | 0 | 152 | 0 |
| C | 0 | 152 | 0 |
| D | 0 | 152 | 0 |
| Mode M0 | |||
|---|---|---|---|
| Quadrant | BADHDUFLAG | Total packets | Discarded packets |
| A | 0 | 23904 | 1 |
| B | 0 | 40230 | 0 |
| C | 0 | 16306 | 0 |
| D | 0 | 24215 | 0 |
| Quadrant | Total seconds | Saturated seconds | Saturation percentage |
|---|---|---|---|
| A | 7671 | 363 | 4.732108% |
| B | 7671 | 2731 | 35.601616% |
| C | 7672 | 106 | 1.381648% |
| D | 7672 | 730 | 9.515120% |
Noise dominated data is calculated using 1-second bins in cleaned event files. If a bin has >2000 counts, and if more than 50% of those come from <1% of pixels, then it is considered to be noise-dominated and hence unusable.
| Quadrant | # 1 sec bins | Bins with >0 counts | Bins with >2000 counts | High rate bins dominated by noise | Noise dominated (total time) | Noise dominated (detector-on time) | Marked lightcurve |
|---|---|---|---|---|---|---|---|
| A | 7671 | 7671 | 17 | 17 | 0.22% | 0.22% | 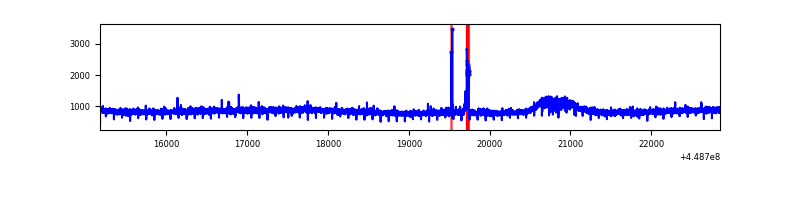 |
| B | 7671 | 7671 | 1618 | 1618 | 21.09% | 21.09% | 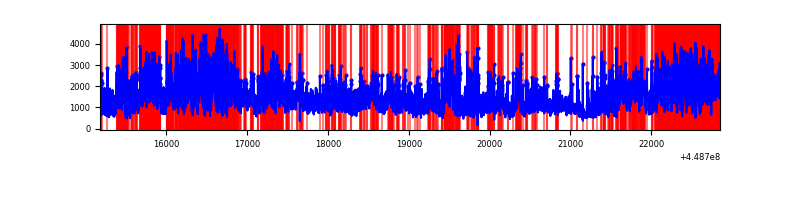 |
| C | 7672 | 7672 | 13 | 13 | 0.17% | 0.17% | 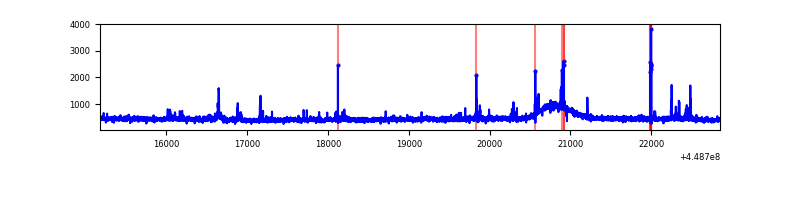 |
| D | 7672 | 7672 | 557 | 557 | 7.26% | 7.26% | 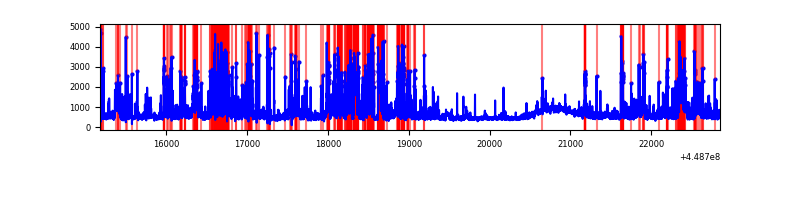 |
Top three noisy pixels from each quadrant. If the there are fewer than three noisy pixels in the level2.evt file, extra rows are filled as -1
| Pixel properties | Quadrant properties | ||||||
|---|---|---|---|---|---|---|---|
| Quadrant | DetID | PixID | Counts | Sigma | Mean | Median | Sigma |
| A | 10 | 83 | 3054029 | 16344.2 | 887 | 865 | 186.8 |
| A | 14 | 235 | 52264 | 275.15 | 887 | 865 | 186.8 |
| A | 13 | 254 | 13189 | 65.97 | 887 | 865 | 186.8 |
| B | 3 | 112 | 7689381 | 48421.66 | 801 | 775 | 158.8 |
| B | 0 | 171 | 386478 | 2429.1 | 801 | 775 | 158.8 |
| B | 2 | 2 | 117990 | 738.2 | 801 | 775 | 158.8 |
| C | 14 | 254 | 104552 | 501.64 | 877 | 881 | 206.7 |
| C | 3 | 233 | 32005 | 150.6 | 877 | 881 | 206.7 |
| C | 2 | 14 | 15077 | 68.69 | 877 | 881 | 206.7 |
| D | 13 | 249 | 843455 | 3854.64 | 858 | 829 | 218.6 |
| D | 12 | 2 | 629402 | 2875.44 | 858 | 829 | 218.6 |
| D | 6 | 143 | 539492 | 2464.14 | 858 | 829 | 218.6 |
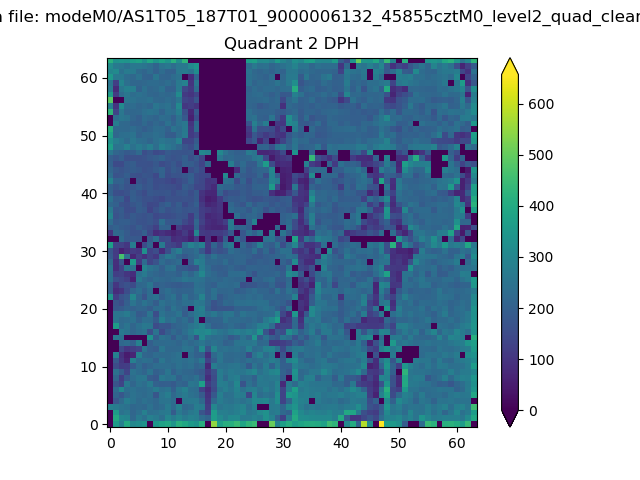
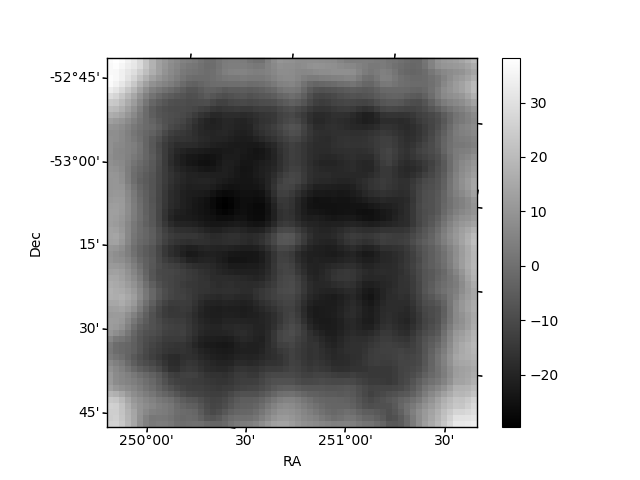
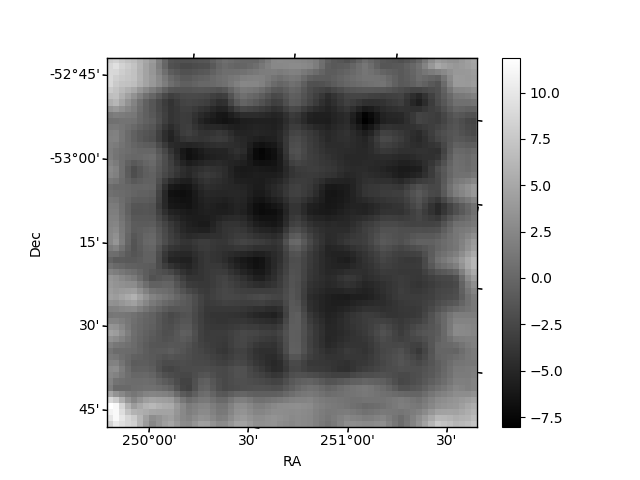
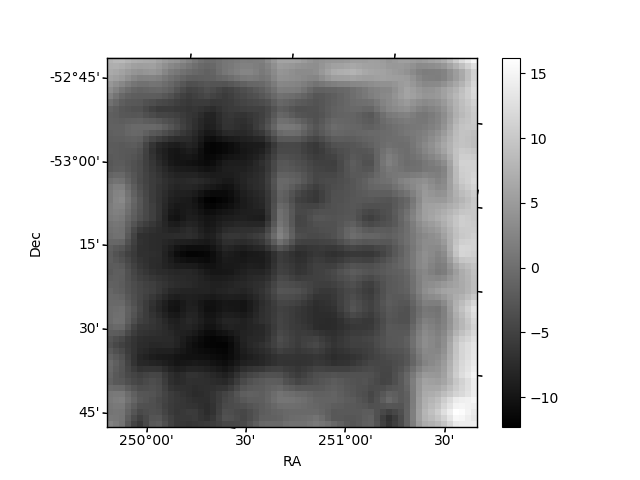
Histogram calculated using DETX and DETY for each event in the final _common_clean file
| Quadrant A | 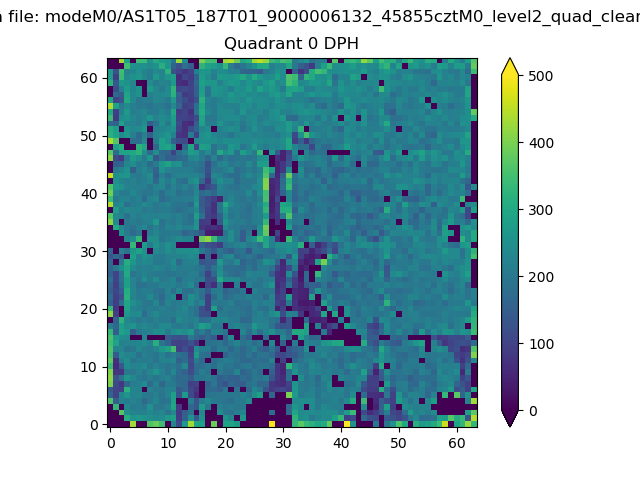 |
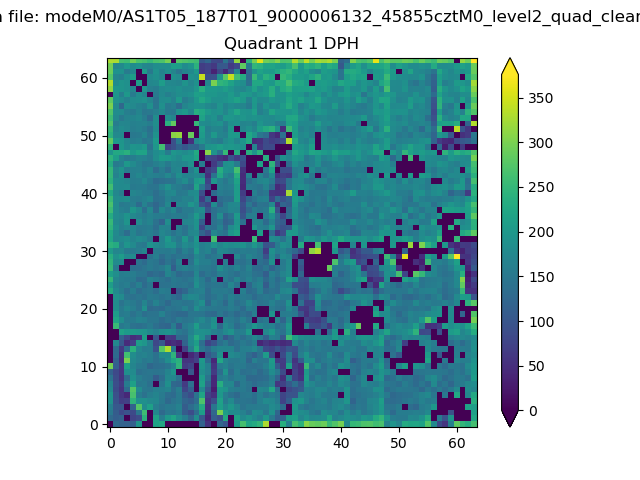 |
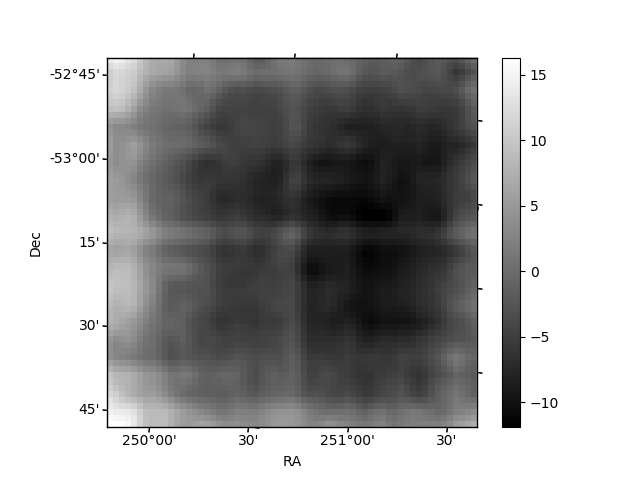
Quadrant B |
|---|---|---|---|
| Quadrant D | 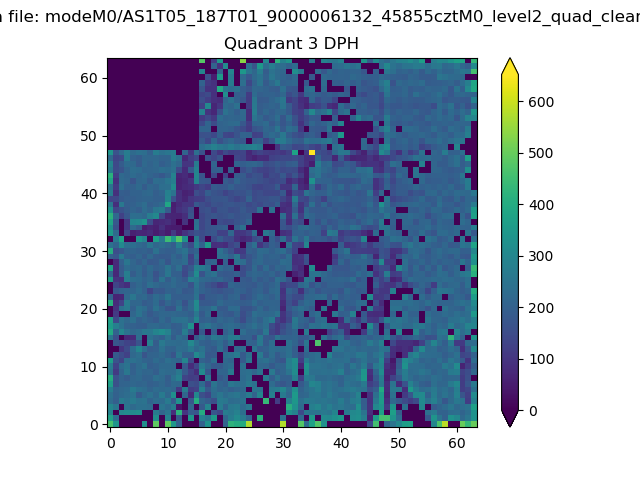 |
 |
Quadrant C |
| Plot type | Count rate plots | Images |
|---|---|---|
| Comparison with Poisson distribution Blue bars denote a histogram of data divided into 1 sec bins. Red curve is a Poisson curve with rate = median count rate of data. |
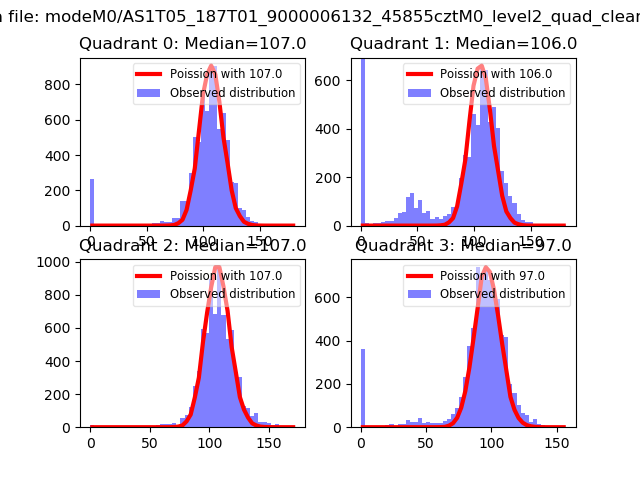 |
 |
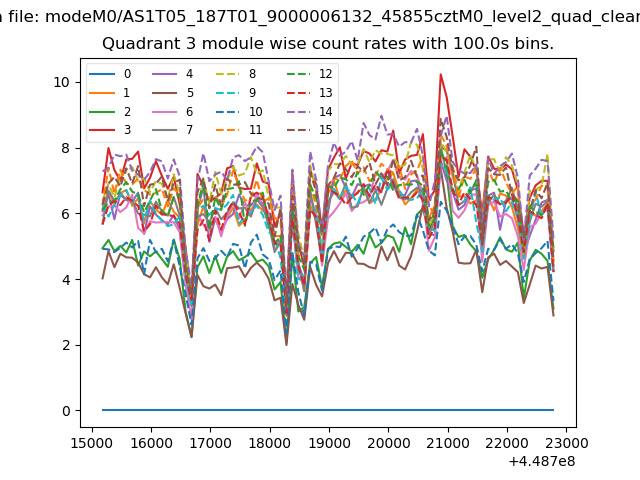
| Quadrant-wise count rates Data is divided into 100 sec bins |
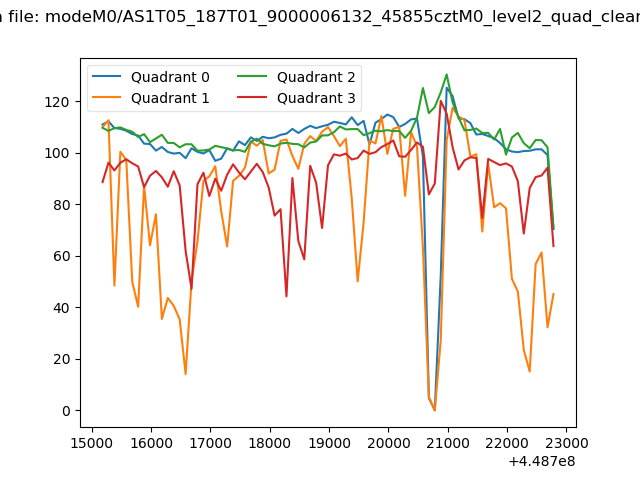 |
|
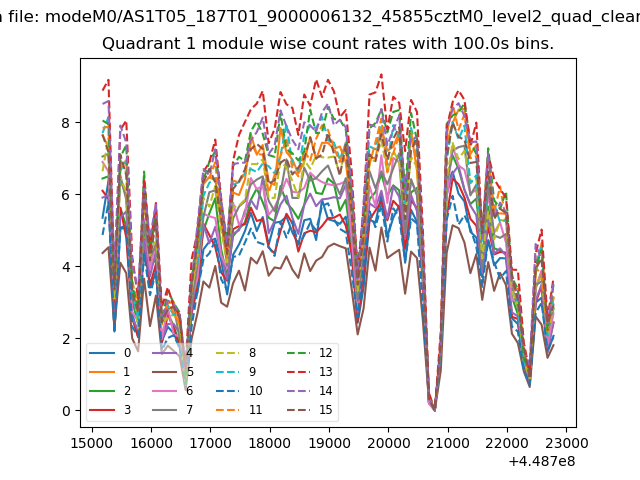
| Module-wise count rates for Quadrant A Data is divided into 100 sec bins |
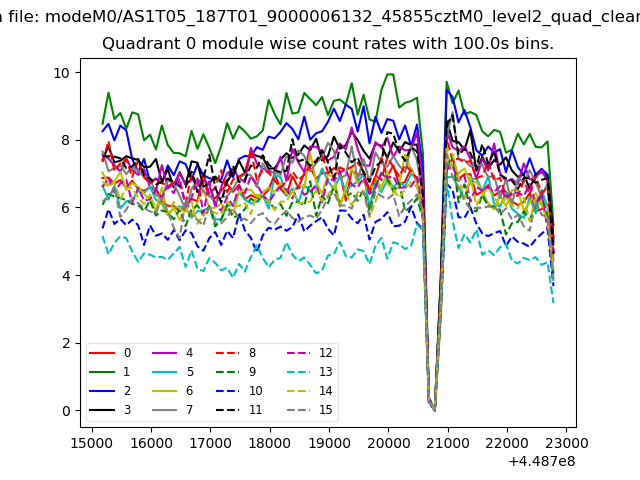 |
 |
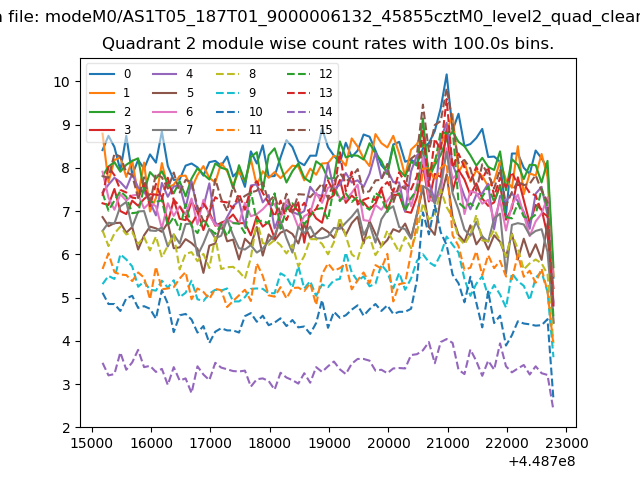
| Module-wise count rates for Quadrant B Data is divided into 100 sec bins |
 |
 |
| Module-wise count rates for Quadrant C Data is divided into 100 sec bins |
 |
 |
| Module-wise count rates for Quadrant D Data is divided into 100 sec bins |
 |
 |
| Parameter | Plot |
|---|---|
| CZT HV Monitor | 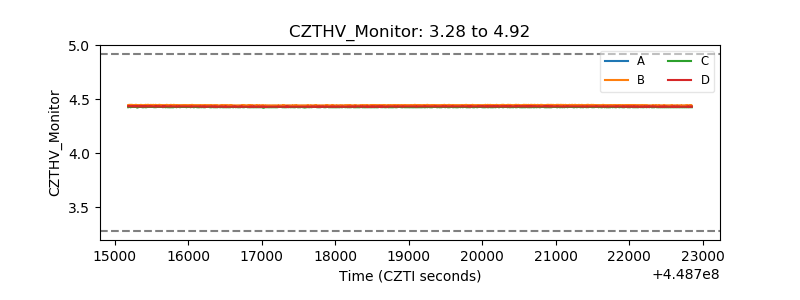 |
| D_VDD | 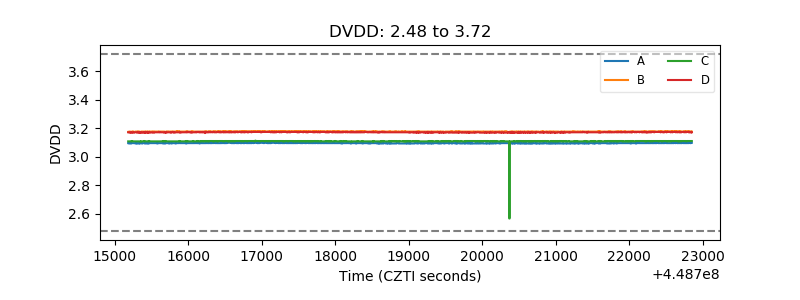 |
| Temperature 1 | 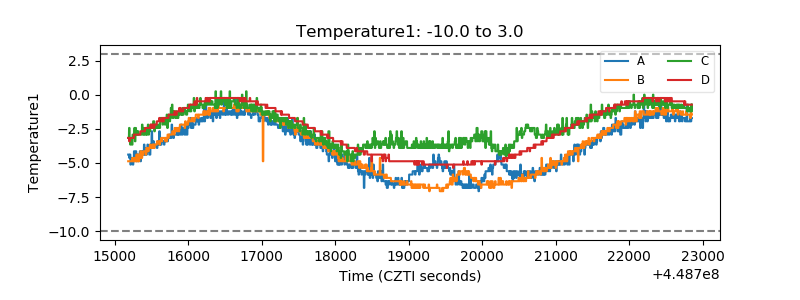 |
| Veto HV Monitor | 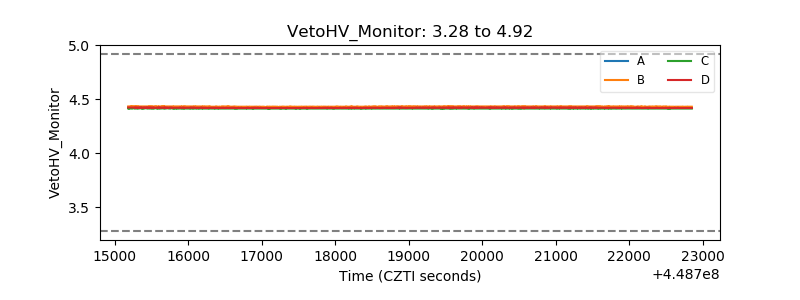 |
| Veto LLD | 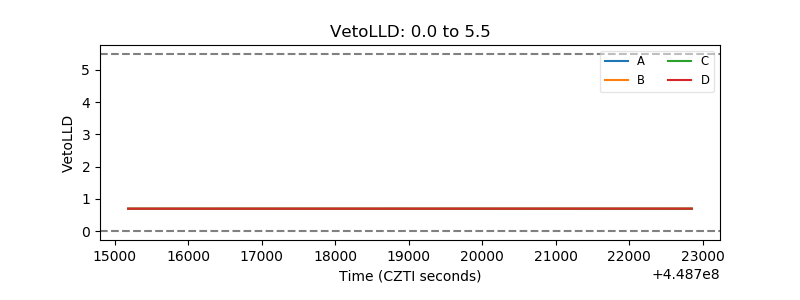 |
| Alpha Counter | 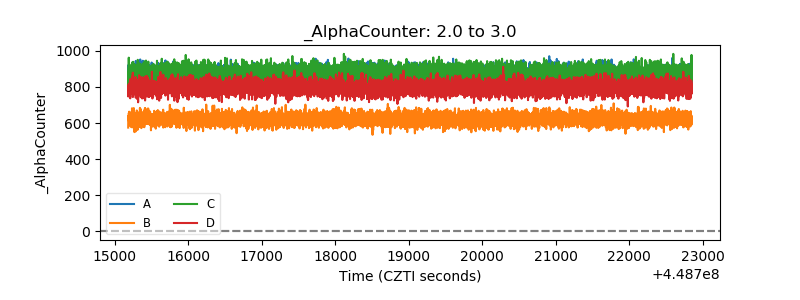 |
| _CPM_Rate | 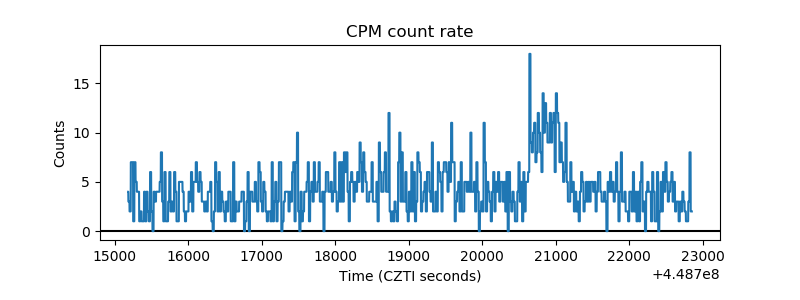 |
| CZT Counter | 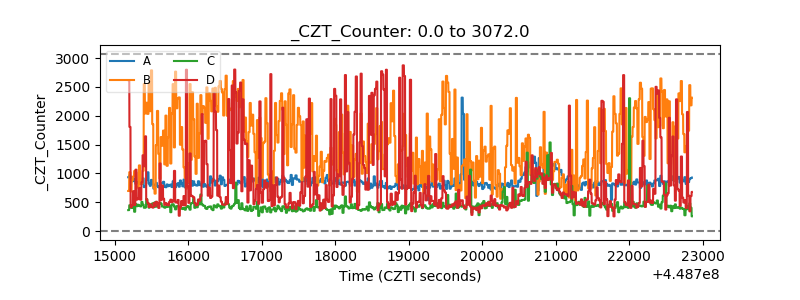 |
| +2.5 Volts monitor | 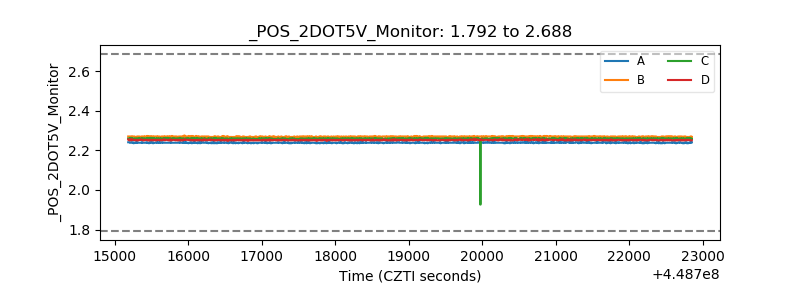 |
| +5 Volts monitor | 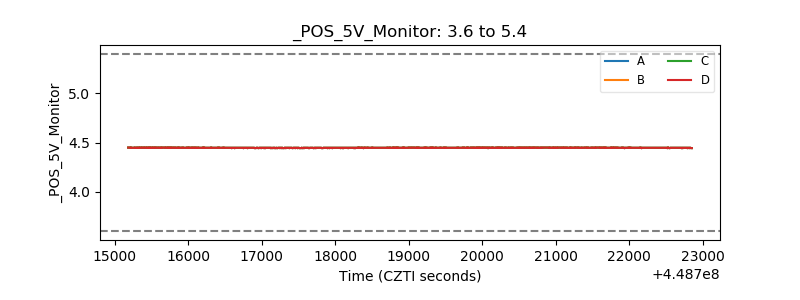 |
| _ROLL_ROT | 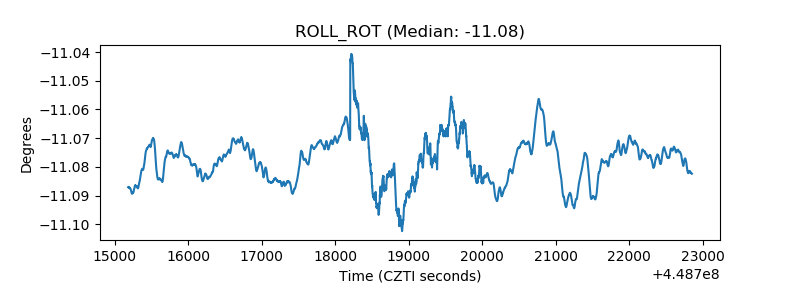 |
| _Roll_DEC | 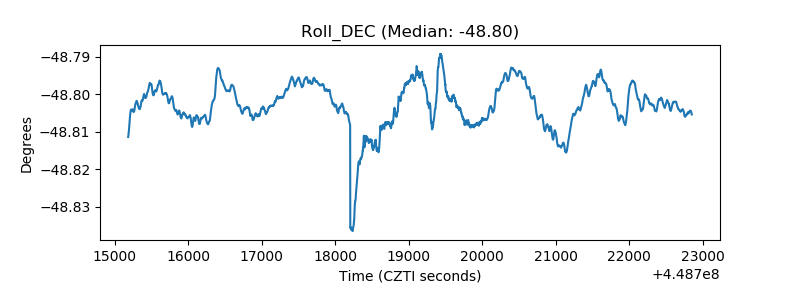 |
| _Roll_RA | 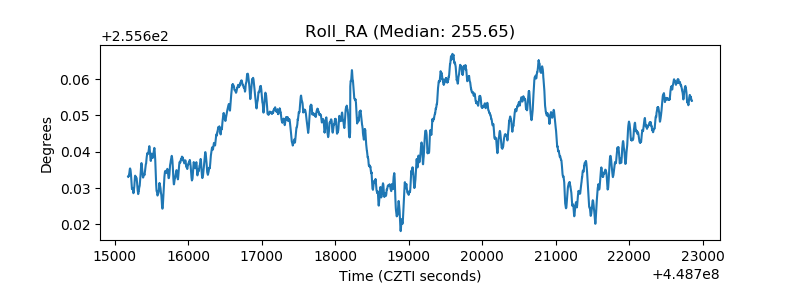 |
| Veto Counter | 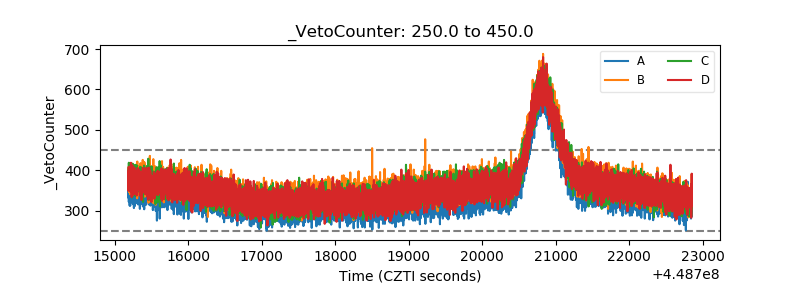 |