| Param | Original file | Final file |
|---|---|---|
| Filename | modeM0/AS1T05_187T01_9000006132_45856cztM0_level2.fits | modeM0/AS1T05_187T01_9000006132_45856cztM0_level2_quad_clean.evt |
| Size (bytes) | 769,659,840 | 125,873,280 |
| Size | 734.0 MB | 120.0 MB |
| Events in quadrant A | 7,124,748 | 861,286 |
| Events in quadrant B | 10,711,358 | 735,618 |
| Events in quadrant C | 3,705,714 | 874,966 |
| Events in quadrant D | 6,318,987 | 772,804 |
| Mode SS | |||
|---|---|---|---|
| Quadrant | BADHDUFLAG | Total packets | Discarded packets |
| A | 0 | 164 | 0 |
| B | 0 | 164 | 0 |
| C | 0 | 164 | 0 |
| D | 0 | 164 | 0 |
| Mode M0 | |||
|---|---|---|---|
| Quadrant | BADHDUFLAG | Total packets | Discarded packets |
| A | 0 | 26043 | 0 |
| B | 0 | 37556 | 0 |
| C | 0 | 17027 | 1 |
| D | 0 | 24296 | 0 |
| Quadrant | Total seconds | Saturated seconds | Saturation percentage |
|---|---|---|---|
| A | 8144 | 265 | 3.253929% |
| B | 8145 | 2041 | 25.058318% |
| C | 8144 | 19 | 0.233301% |
| D | 8144 | 411 | 5.046660% |
Noise dominated data is calculated using 1-second bins in cleaned event files. If a bin has >2000 counts, and if more than 50% of those come from <1% of pixels, then it is considered to be noise-dominated and hence unusable.
| Quadrant | # 1 sec bins | Bins with >0 counts | Bins with >2000 counts | High rate bins dominated by noise | Noise dominated (total time) | Noise dominated (detector-on time) | Marked lightcurve |
|---|---|---|---|---|---|---|---|
| A | 8144 | 8144 | 0 | 0 | 0.00% | 0.00% | 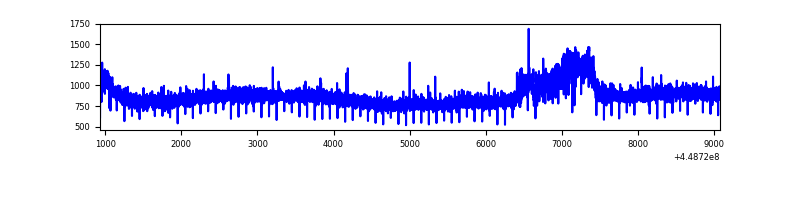 |
| B | 8145 | 8145 | 1200 | 1200 | 14.73% | 14.73% | 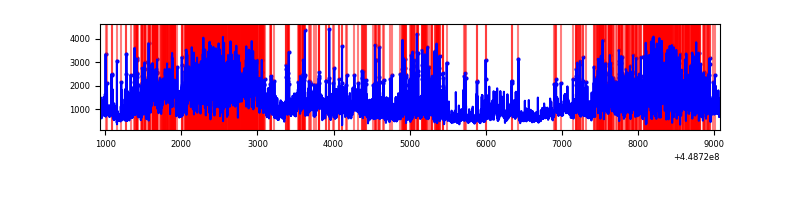 |
| C | 8144 | 8144 | 7 | 7 | 0.09% | 0.09% | 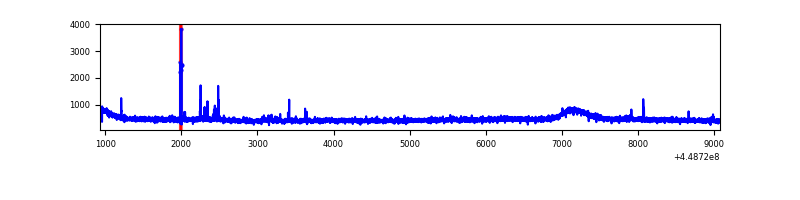 |
| D | 8144 | 8144 | 357 | 357 | 4.38% | 4.38% | 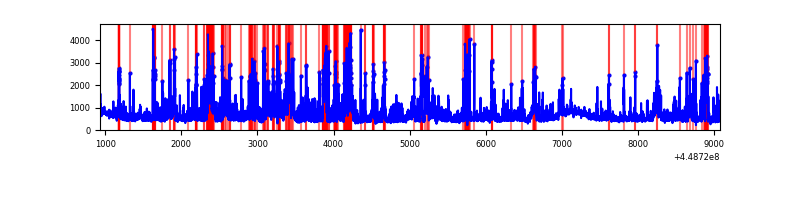 |
Top three noisy pixels from each quadrant. If the there are fewer than three noisy pixels in the level2.evt file, extra rows are filled as -1
| Pixel properties | Quadrant properties | ||||||
|---|---|---|---|---|---|---|---|
| Quadrant | DetID | PixID | Counts | Sigma | Mean | Median | Sigma |
| A | 10 | 83 | 3289055 | 16557.45 | 942 | 918 | 198.6 |
| A | 0 | 247 | 163417 | 818.26 | 942 | 918 | 198.6 |
| A | 0 | 226 | 15598 | 73.92 | 942 | 918 | 198.6 |
| B | 3 | 112 | 6470636 | 36912.41 | 872 | 845 | 175.3 |
| B | 0 | 171 | 277477 | 1578.28 | 872 | 845 | 175.3 |
| B | 5 | 172 | 113617 | 643.4 | 872 | 845 | 175.3 |
| C | 14 | 254 | 32523 | 144.57 | 925 | 928 | 218.5 |
| C | 3 | 233 | 31263 | 138.8 | 925 | 928 | 218.5 |
| C | 2 | 14 | 24043 | 105.77 | 925 | 928 | 218.5 |
| D | 13 | 249 | 771447 | 3294.94 | 917 | 887 | 233.9 |
| D | 12 | 2 | 551692 | 2355.26 | 917 | 887 | 233.9 |
| D | 1 | 52 | 478702 | 2043.15 | 917 | 887 | 233.9 |
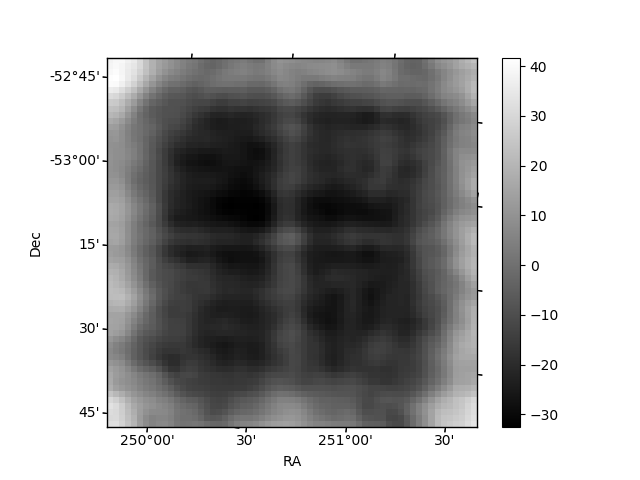
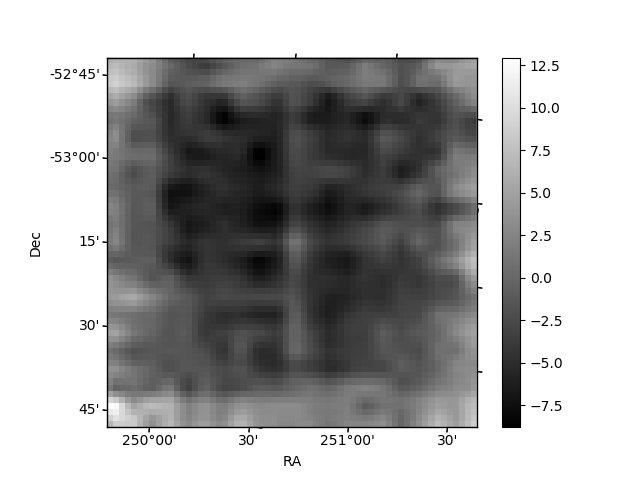
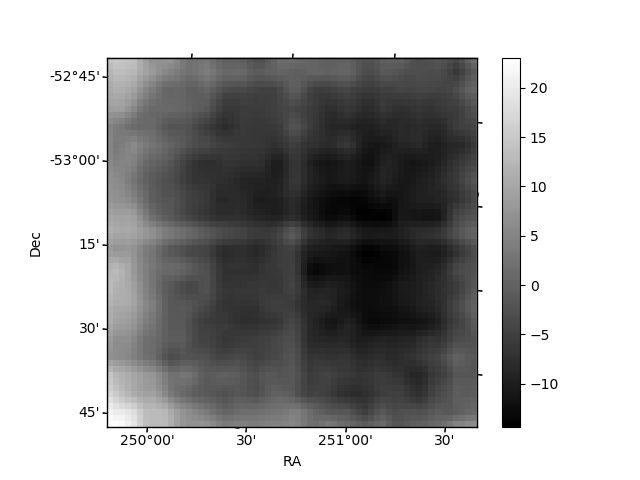
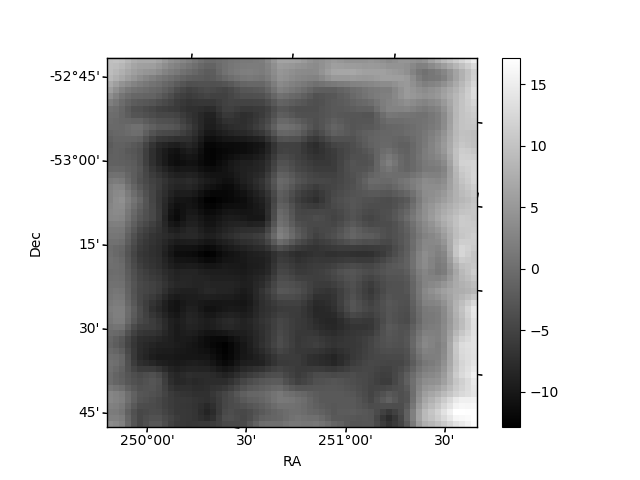
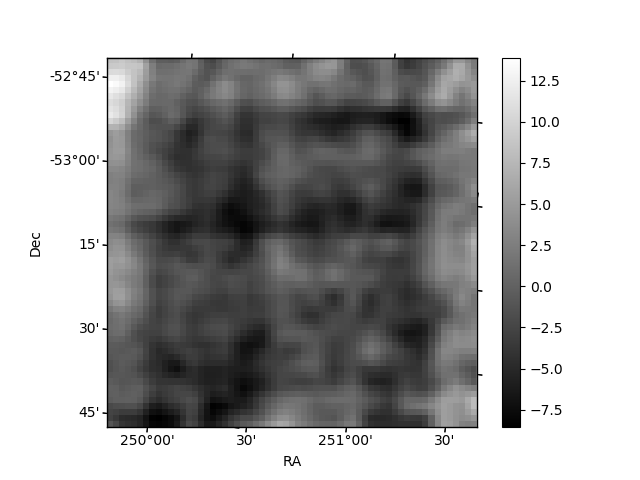
Histogram calculated using DETX and DETY for each event in the final _common_clean file
| Quadrant A | 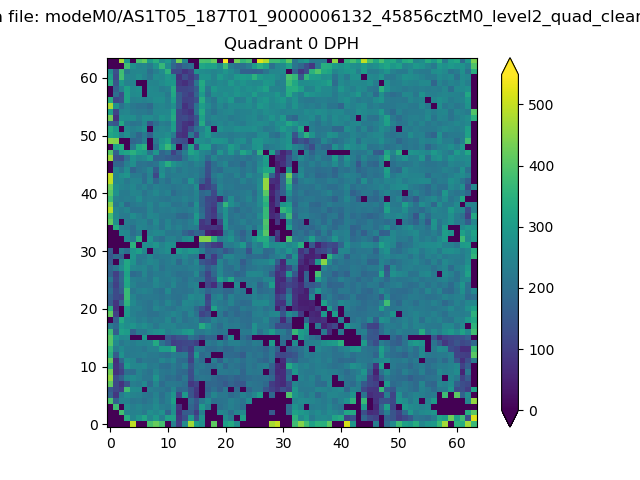 |
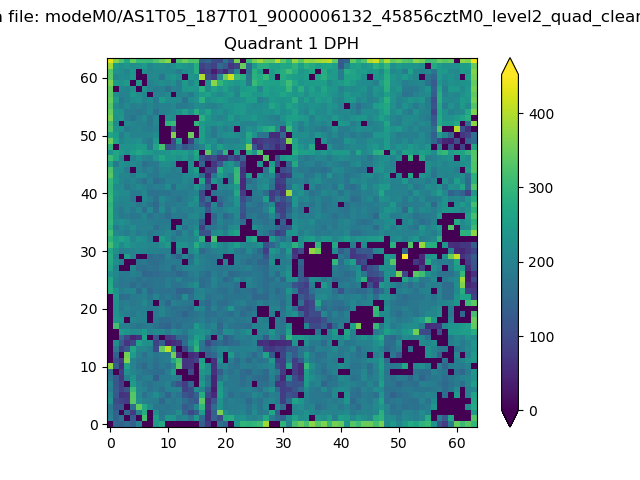 |
Quadrant B |
|---|---|---|---|
| Quadrant D | 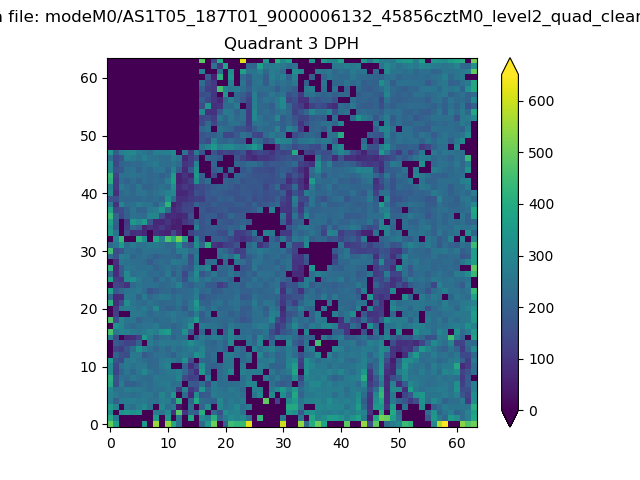 |
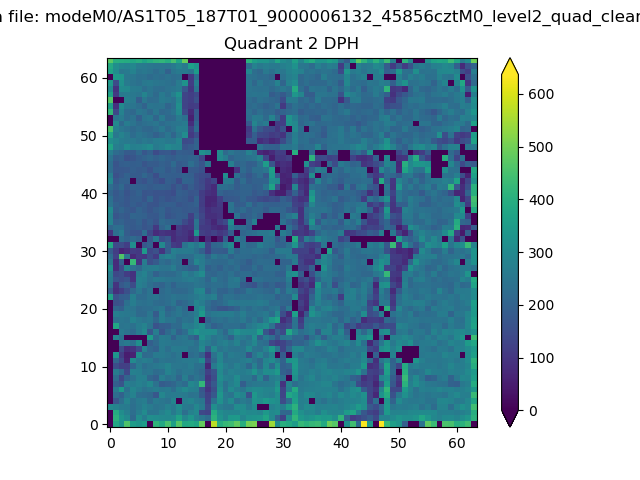 |
Quadrant C |
| Plot type | Count rate plots | Images |
|---|---|---|
| Comparison with Poisson distribution Blue bars denote a histogram of data divided into 1 sec bins. Red curve is a Poisson curve with rate = median count rate of data. |
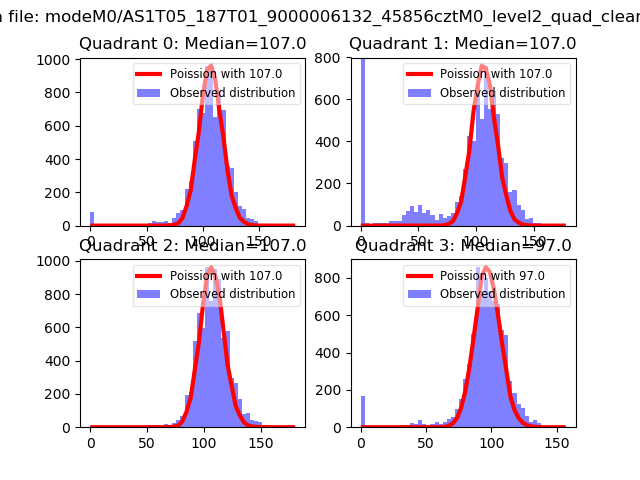 |
 |
| Quadrant-wise count rates Data is divided into 100 sec bins |
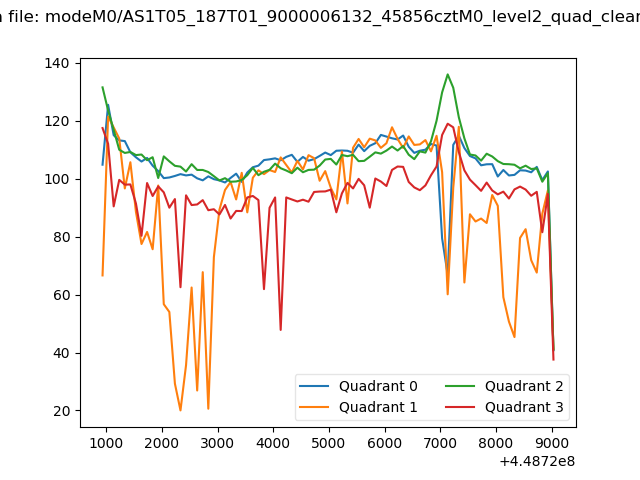 |
|
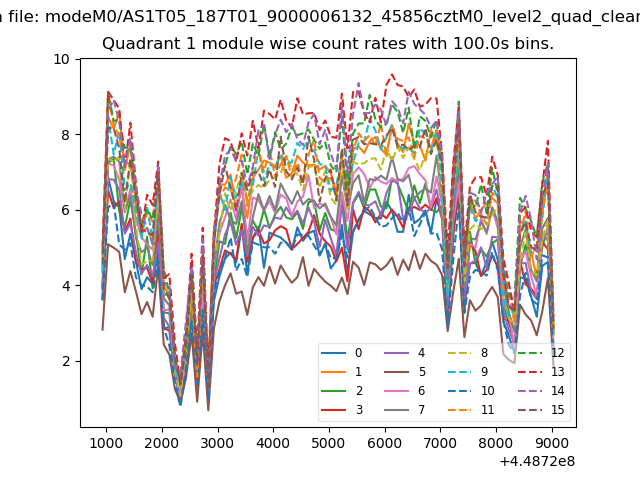
| Module-wise count rates for Quadrant A Data is divided into 100 sec bins |
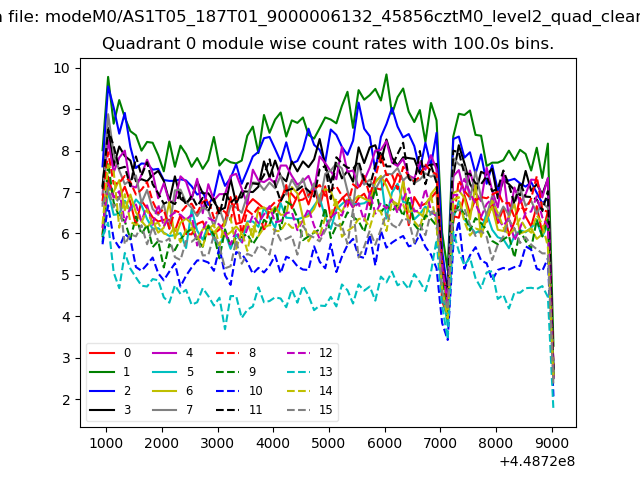 |
 |
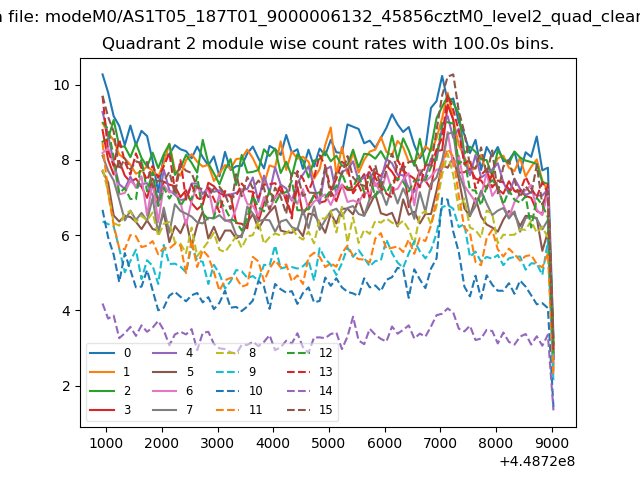
| Module-wise count rates for Quadrant B Data is divided into 100 sec bins |
 |
 |
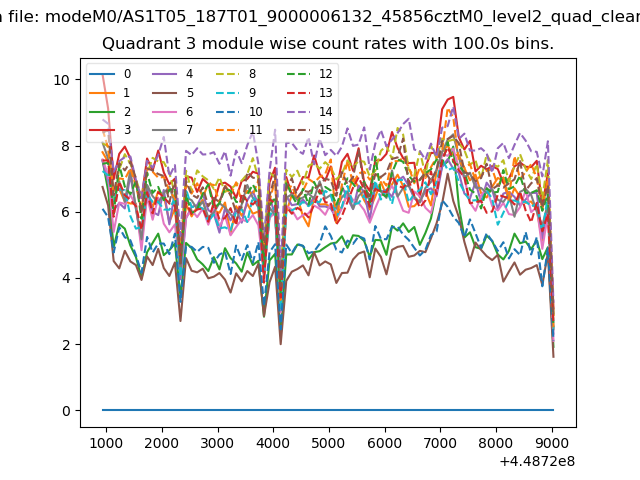
| Module-wise count rates for Quadrant C Data is divided into 100 sec bins |
 |
 |
| Module-wise count rates for Quadrant D Data is divided into 100 sec bins |
 |
 |
| Parameter | Plot |
|---|---|
| CZT HV Monitor | 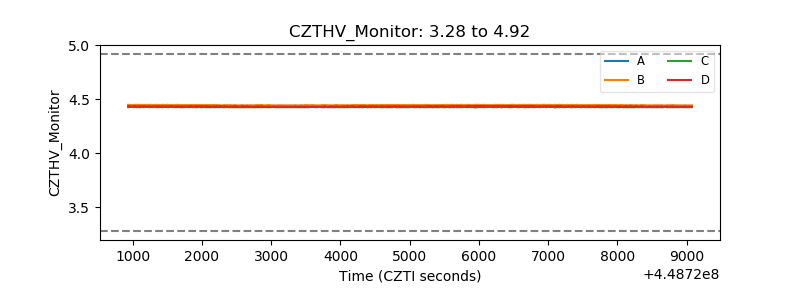 |
| D_VDD | 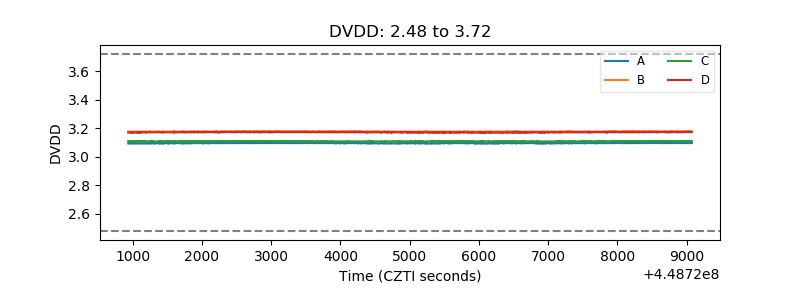 |
| Temperature 1 | 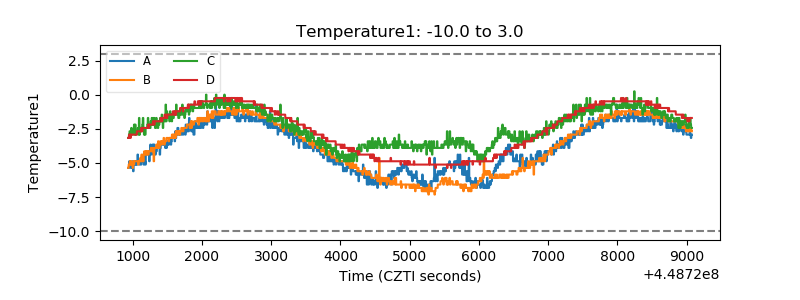 |
| Veto HV Monitor | 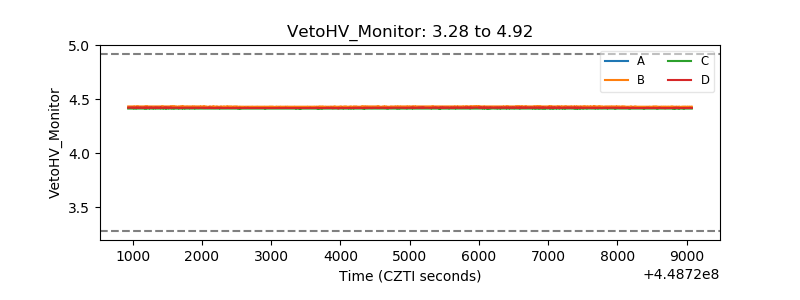 |
| Veto LLD | 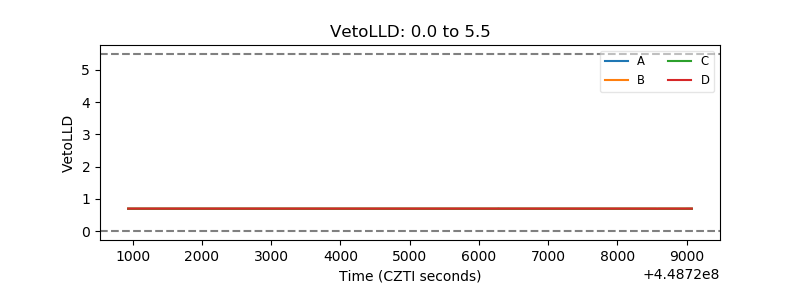 |
| Alpha Counter | 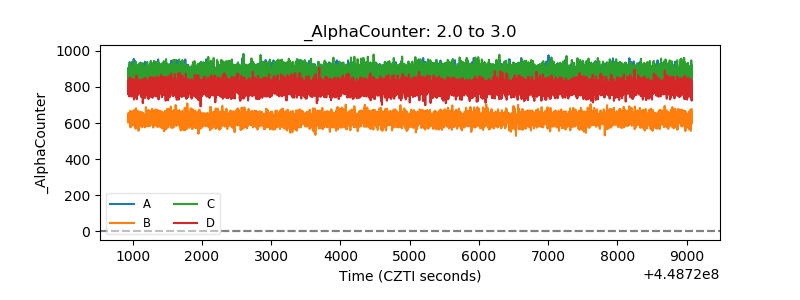 |
| _CPM_Rate | 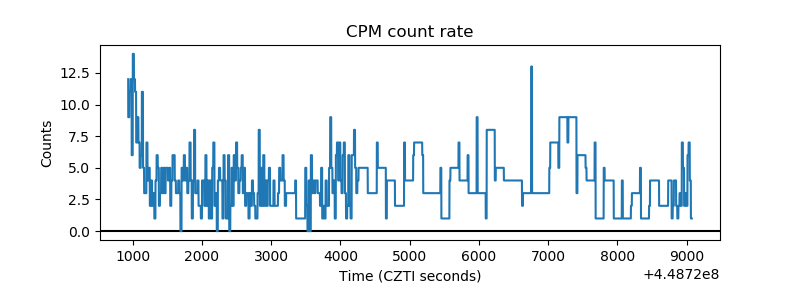 |
| CZT Counter | 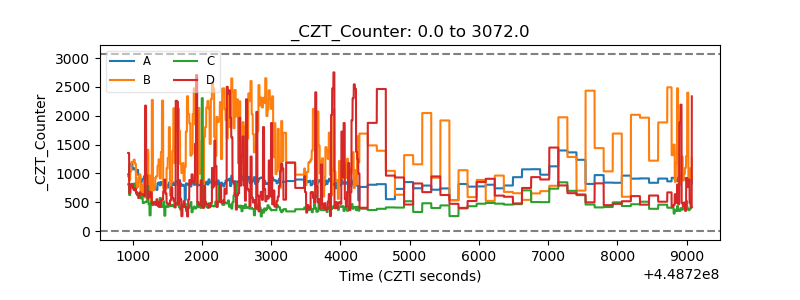 |
| +2.5 Volts monitor | 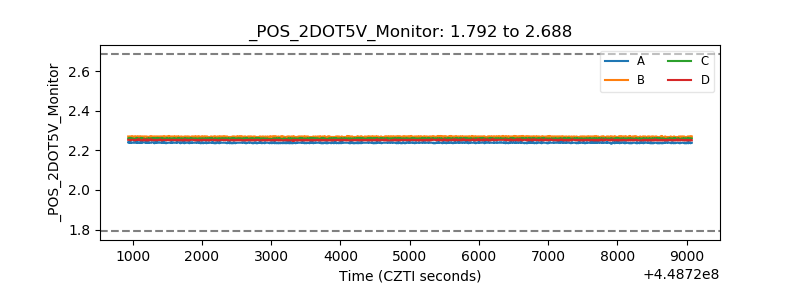 |
| +5 Volts monitor | 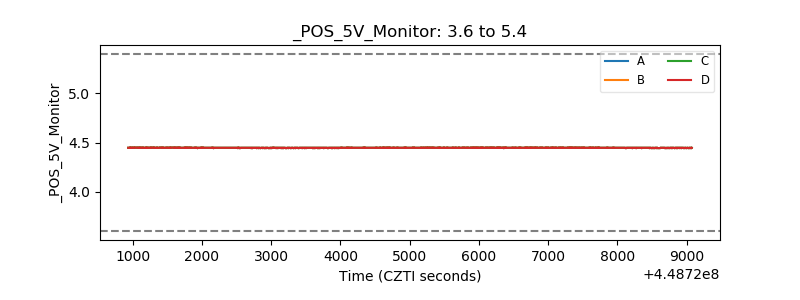 |
| _ROLL_ROT | 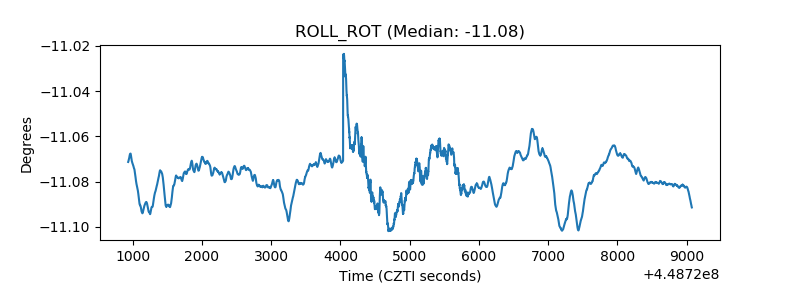 |
| _Roll_DEC | 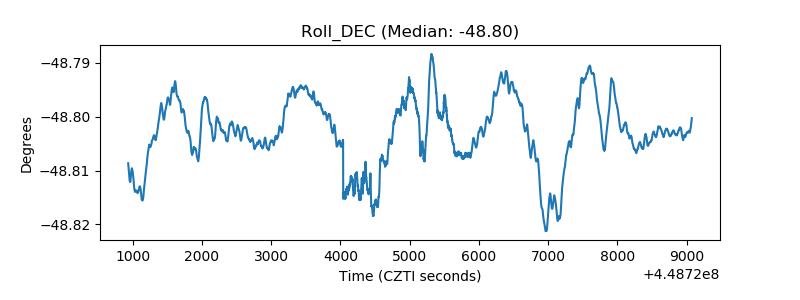 |
| _Roll_RA | 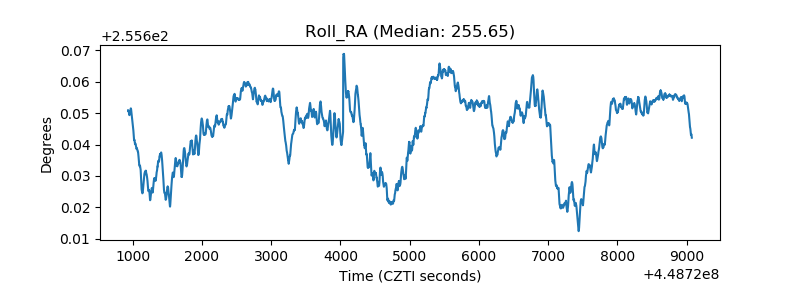 |
| Veto Counter | 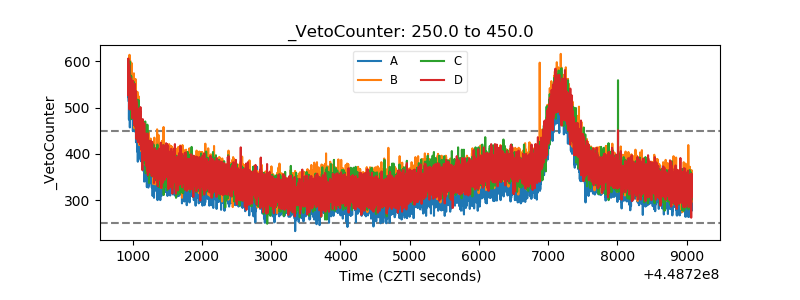 |