| Param | Original file | Final file |
|---|---|---|
| Filename | modeM0/AS1T05_187T01_9000006132_45857cztM0_level2.fits | modeM0/AS1T05_187T01_9000006132_45857cztM0_level2_quad_clean.evt |
| Size (bytes) | 776,341,440 | 108,331,200 |
| Size | 740.4 MB | 103.3 MB |
| Events in quadrant A | 6,449,278 | 784,197 |
| Events in quadrant B | 12,432,825 | 504,327 |
| Events in quadrant C | 3,316,384 | 799,195 |
| Events in quadrant D | 5,956,720 | 668,551 |
| Mode SS | |||
|---|---|---|---|
| Quadrant | BADHDUFLAG | Total packets | Discarded packets |
| A | 0 | 152 | 0 |
| B | 0 | 152 | 0 |
| C | 0 | 152 | 0 |
| D | 0 | 152 | 0 |
| Mode M9 | |||
|---|---|---|---|
| Quadrant | BADHDUFLAG | Total packets | Discarded packets |
| A | 0 | 1 | 0 |
| B | 0 | 1 | 0 |
| C | 0 | 1 | 0 |
| D | 0 | 1 | 0 |
| Mode M0 | |||
|---|---|---|---|
| Quadrant | BADHDUFLAG | Total packets | Discarded packets |
| A | 0 | 23619 | 1 |
| B | 0 | 42189 | 1 |
| C | 0 | 15508 | 1 |
| D | 0 | 22931 | 1 |
| Quadrant | Total seconds | Saturated seconds | Saturation percentage |
|---|---|---|---|
| A | 7522 | 241 | 3.203935% |
| B | 7522 | 3382 | 44.961446% |
| C | 7521 | 33 | 0.438771% |
| D | 7522 | 707 | 9.399096% |
Noise dominated data is calculated using 1-second bins in cleaned event files. If a bin has >2000 counts, and if more than 50% of those come from <1% of pixels, then it is considered to be noise-dominated and hence unusable.
| Quadrant | # 1 sec bins | Bins with >0 counts | Bins with >2000 counts | High rate bins dominated by noise | Noise dominated (total time) | Noise dominated (detector-on time) | Marked lightcurve |
|---|---|---|---|---|---|---|---|
| A | 7592 | 7524 | 0 | 0 | 0.00% | 0.00% | 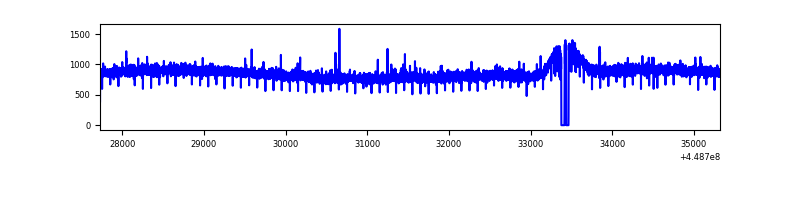 |
| B | 7592 | 7522 | 2293 | 2293 | 30.20% | 30.48% | 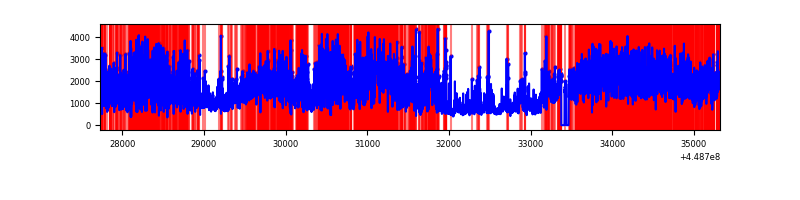 |
| C | 7591 | 7523 | 0 | 0 | 0.00% | 0.00% | 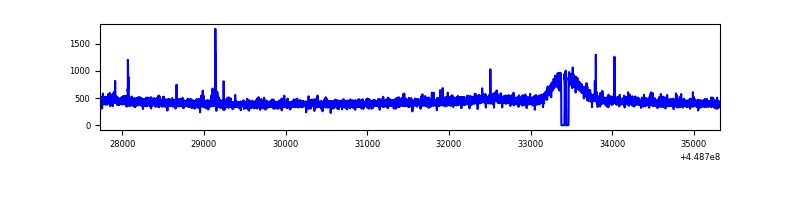 |
| D | 7591 | 7523 | 547 | 547 | 7.21% | 7.27% | 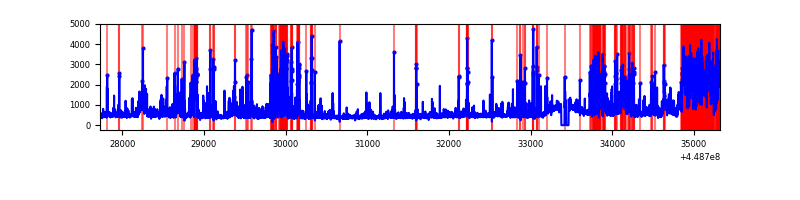 |
Top three noisy pixels from each quadrant. If the there are fewer than three noisy pixels in the level2.evt file, extra rows are filled as -1
| Pixel properties | Quadrant properties | ||||||
|---|---|---|---|---|---|---|---|
| Quadrant | DetID | PixID | Counts | Sigma | Mean | Median | Sigma |
| A | 10 | 83 | 3101678 | 17119.91 | 855 | 833 | 181.1 |
| A | 14 | 248 | 14821 | 77.23 | 855 | 833 | 181.1 |
| A | 14 | 235 | 14441 | 75.13 | 855 | 833 | 181.1 |
| B | 3 | 112 | 8666403 | 62609.63 | 702 | 681 | 138.4 |
| B | 4 | 171 | 370750 | 2673.74 | 702 | 681 | 138.4 |
| B | 0 | 171 | 275406 | 1984.88 | 702 | 681 | 138.4 |
| C | 14 | 254 | 13579 | 64.22 | 840 | 843 | 198.3 |
| C | 3 | 233 | 12587 | 59.22 | 840 | 843 | 198.3 |
| C | 0 | 207 | 6896 | 30.52 | 840 | 843 | 198.3 |
| D | 13 | 249 | 1604367 | 7872.69 | 813 | 787 | 203.7 |
| D | 1 | 52 | 441291 | 2162.63 | 813 | 787 | 203.7 |
| D | 5 | 171 | 252924 | 1237.85 | 813 | 787 | 203.7 |
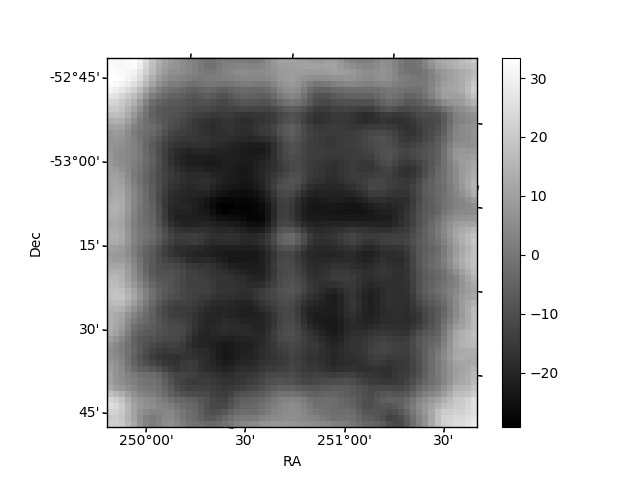
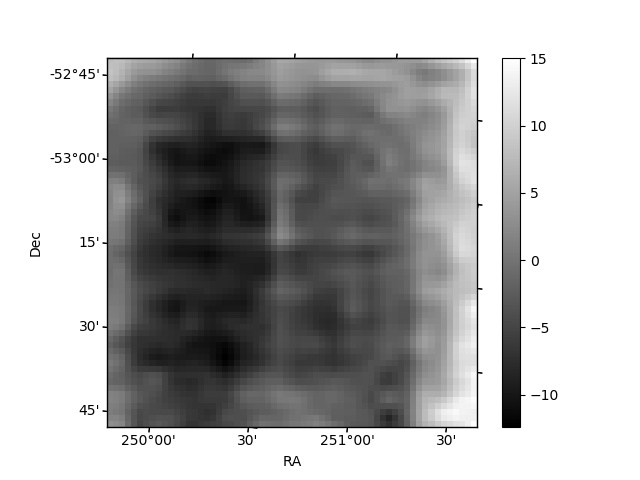
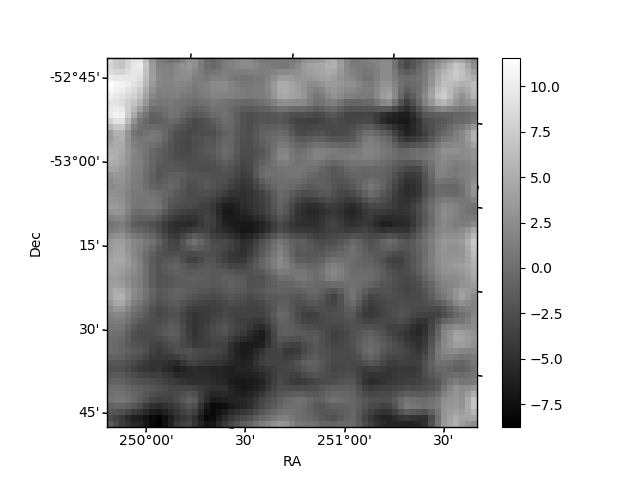
Histogram calculated using DETX and DETY for each event in the final _common_clean file
| Quadrant A | 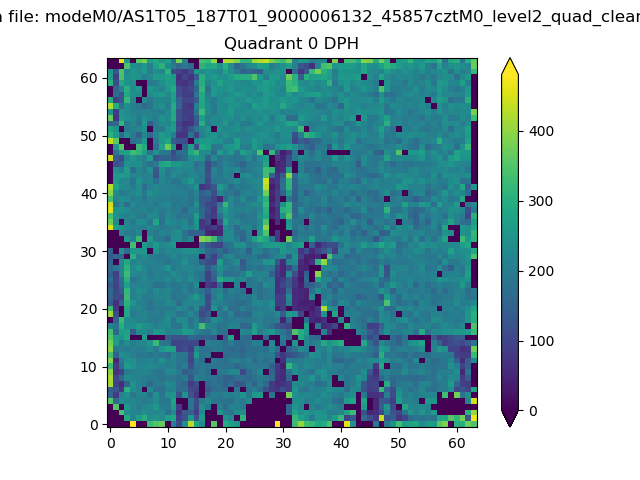 |
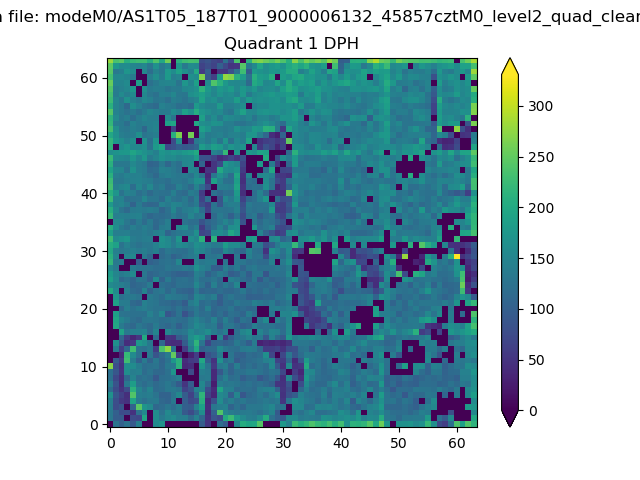 |
Quadrant B |
|---|---|---|---|
| Quadrant D | 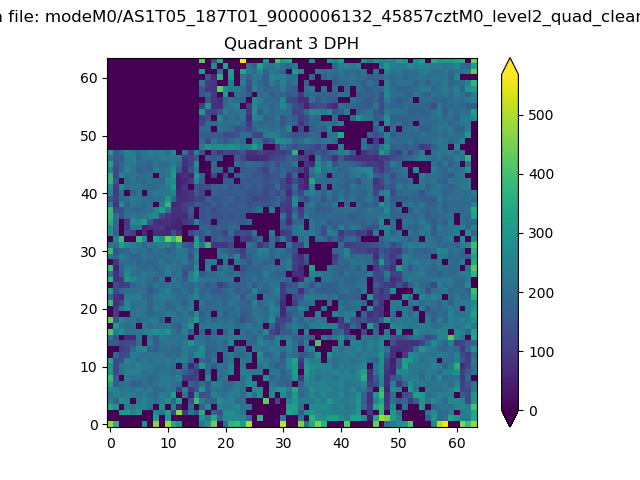 |
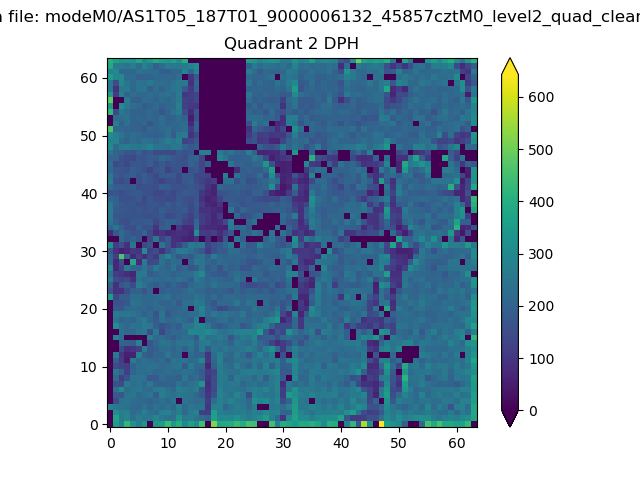 |
Quadrant C |
| Plot type | Count rate plots | Images |
|---|---|---|
| Comparison with Poisson distribution Blue bars denote a histogram of data divided into 1 sec bins. Red curve is a Poisson curve with rate = median count rate of data. |
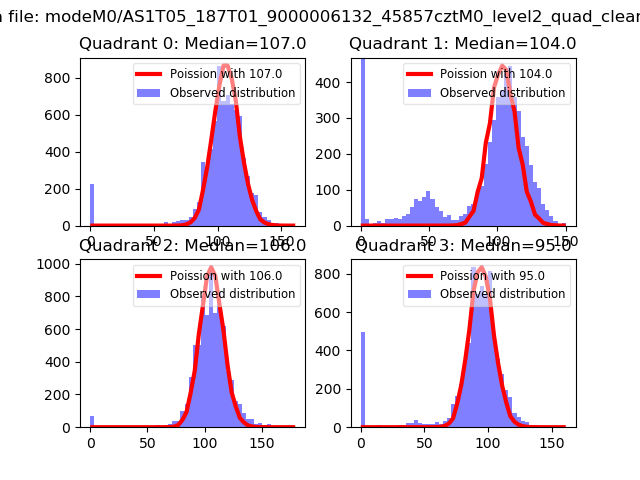 |
 |
| Quadrant-wise count rates Data is divided into 100 sec bins |
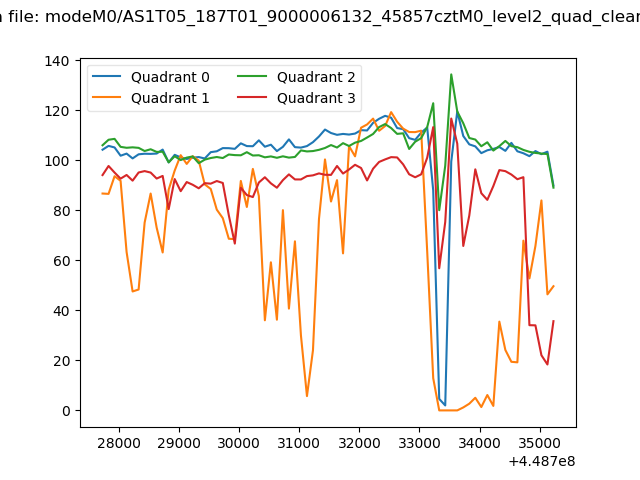 |
|
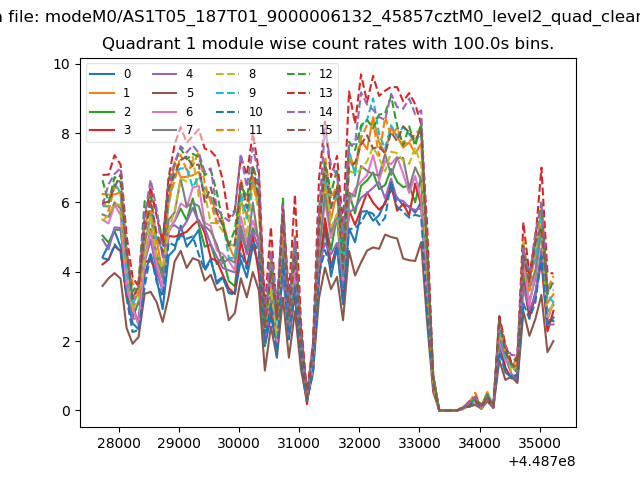
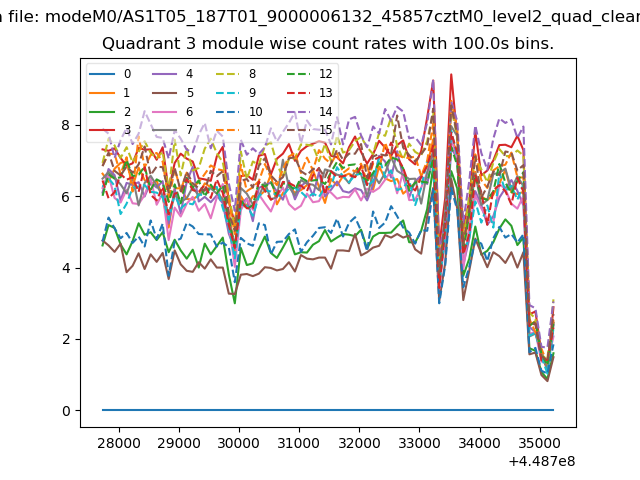
| Module-wise count rates for Quadrant A Data is divided into 100 sec bins |
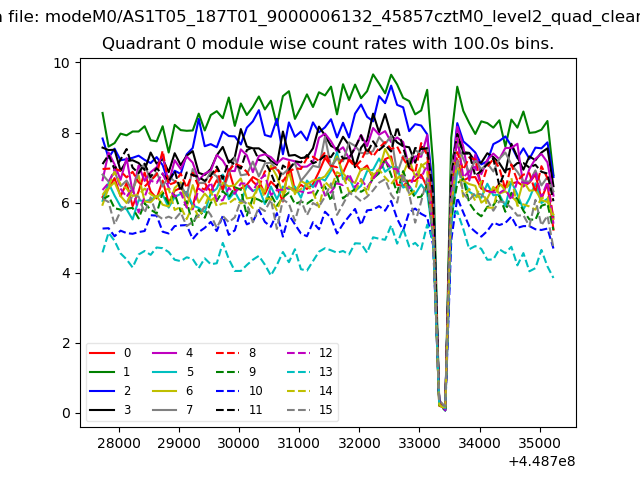 |
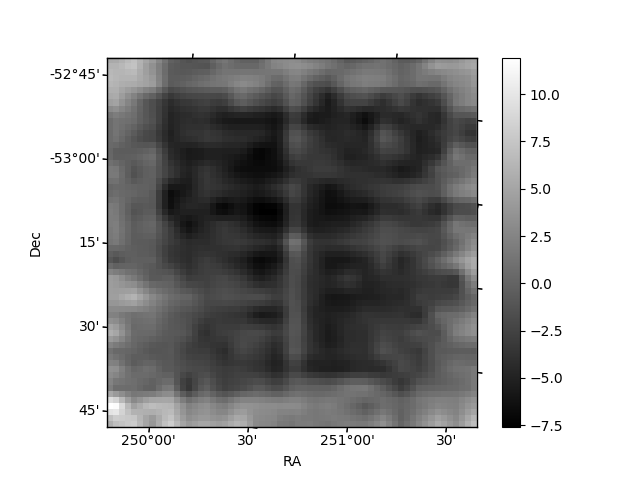 |
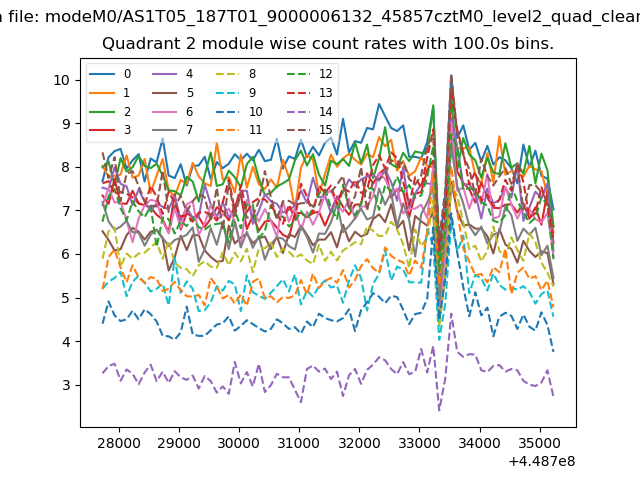
| Module-wise count rates for Quadrant B Data is divided into 100 sec bins |
 |
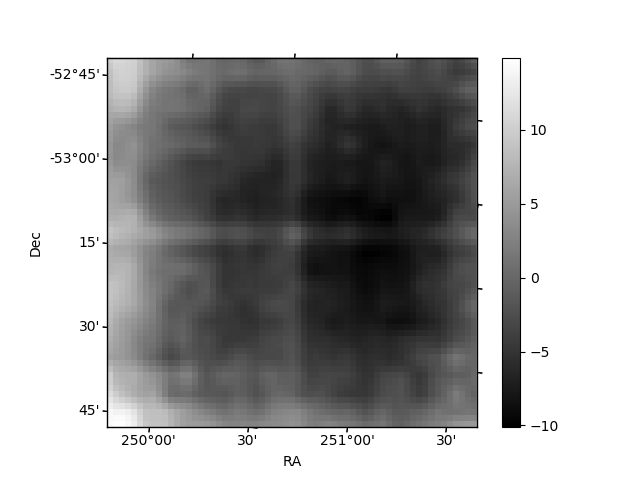 |
| Module-wise count rates for Quadrant C Data is divided into 100 sec bins |
 |
 |
| Module-wise count rates for Quadrant D Data is divided into 100 sec bins |
 |
 |
| Parameter | Plot |
|---|---|
| CZT HV Monitor | 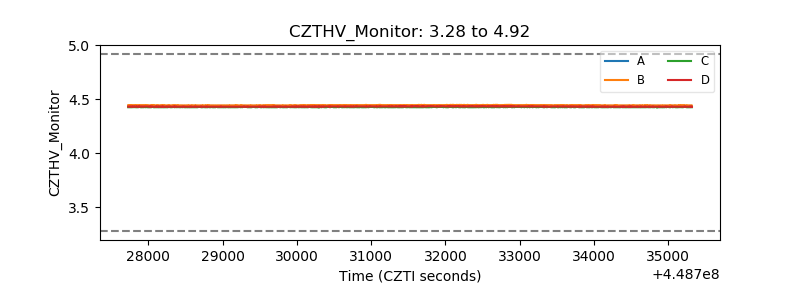 |
| D_VDD | 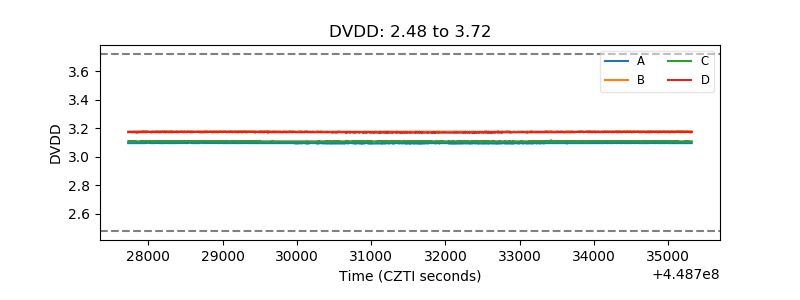 |
| Temperature 1 | 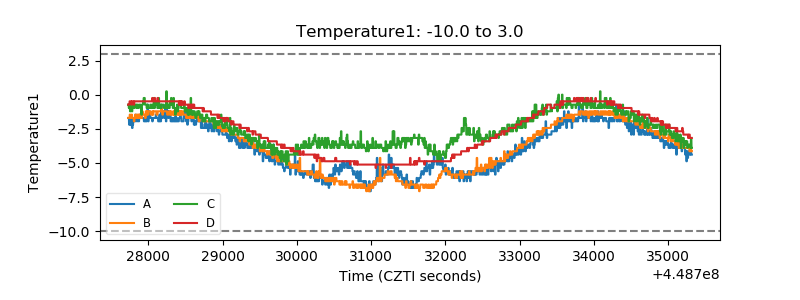 |
| Veto HV Monitor | 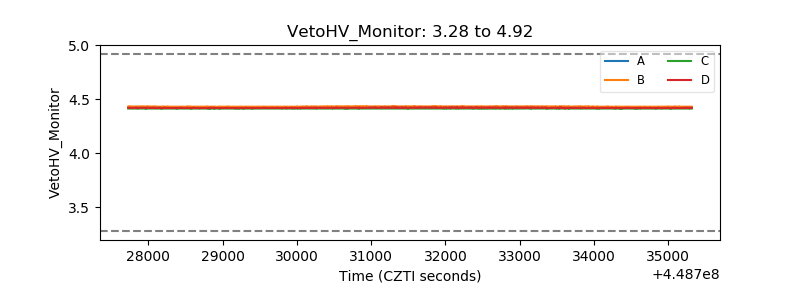 |
| Veto LLD | 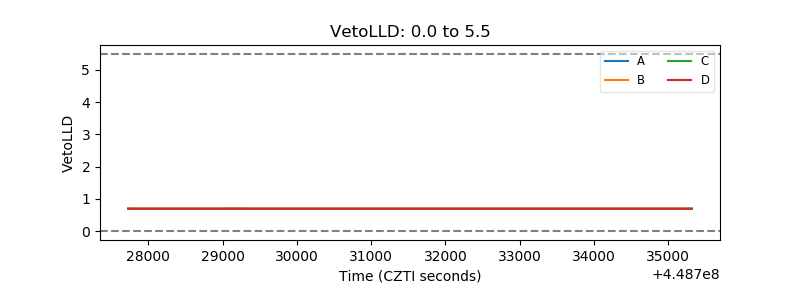 |
| Alpha Counter | 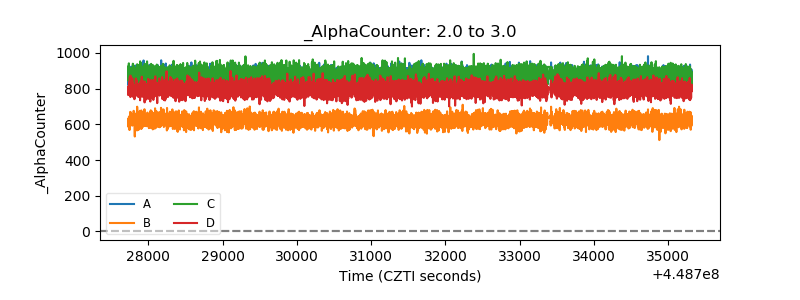 |
| _CPM_Rate | 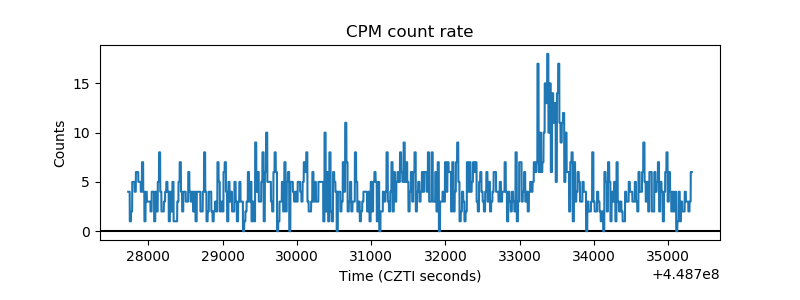 |
| CZT Counter | 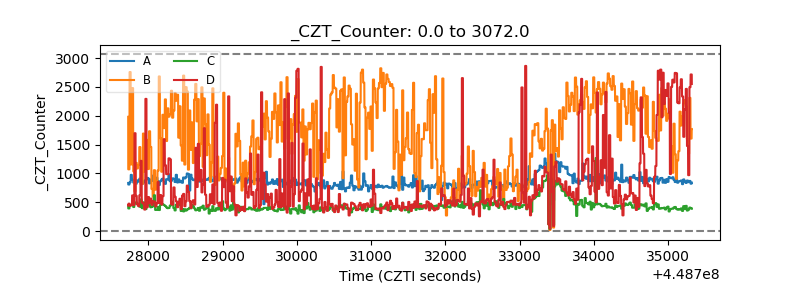 |
| +2.5 Volts monitor |  |
| +5 Volts monitor | 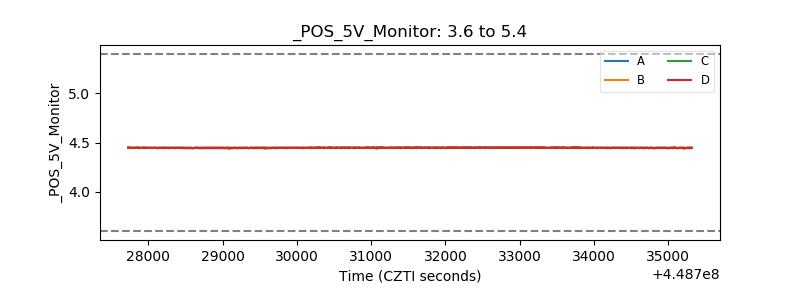 |
| _ROLL_ROT | 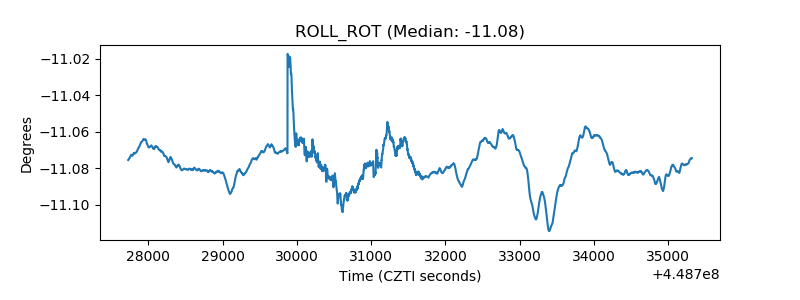 |
| _Roll_DEC | 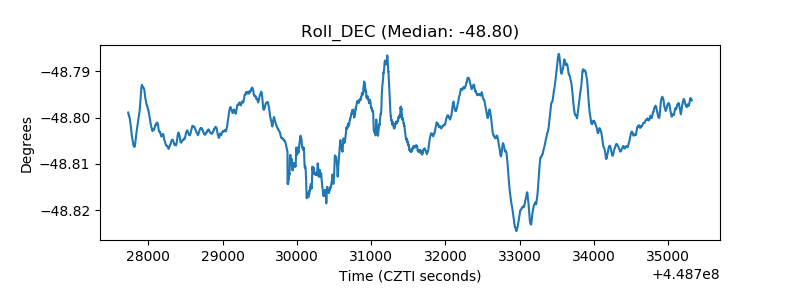 |
| _Roll_RA | 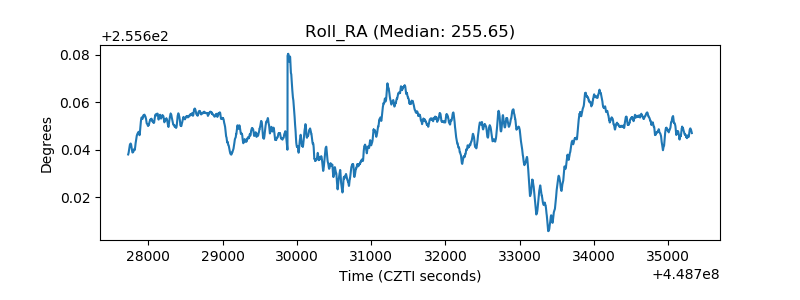 |
| Veto Counter | 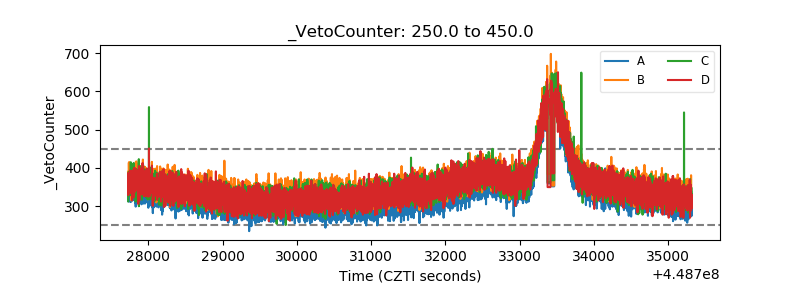 |