| Param | Original file | Final file |
|---|---|---|
| Filename | modeM0/AS1T05_187T01_9000006132_45859cztM0_level2.fits | modeM0/AS1T05_187T01_9000006132_45859cztM0_level2_quad_clean.evt |
| Size (bytes) | 1,109,255,040 | 158,673,600 |
| Size | 1.0 GB | 151.3 MB |
| Events in quadrant A | 9,236,935 | 1,169,901 |
| Events in quadrant B | 16,255,506 | 819,699 |
| Events in quadrant C | 4,759,860 | 1,159,268 |
| Events in quadrant D | 9,953,230 | 888,180 |
| Mode SS | |||
|---|---|---|---|
| Quadrant | BADHDUFLAG | Total packets | Discarded packets |
| A | 0 | 224 | 0 |
| B | 0 | 224 | 0 |
| C | 0 | 224 | 0 |
| D | 0 | 224 | 0 |
| Mode M9 | |||
|---|---|---|---|
| Quadrant | BADHDUFLAG | Total packets | Discarded packets |
| A | 0 | 4 | 0 |
| B | 0 | 4 | 0 |
| C | 0 | 4 | 0 |
| D | 0 | 4 | 0 |
| Mode M0 | |||
|---|---|---|---|
| Quadrant | BADHDUFLAG | Total packets | Discarded packets |
| A | 0 | 34640 | 1 |
| B | 0 | 56140 | 1 |
| C | 0 | 22485 | 1 |
| D | 0 | 37470 | 1 |
| Quadrant | Total seconds | Saturated seconds | Saturation percentage |
|---|---|---|---|
| A | 11073 | 173 | 1.562359% |
| B | 11073 | 3907 | 35.284024% |
| C | 11073 | 43 | 0.388332% |
| D | 11073 | 1733 | 15.650682% |
Noise dominated data is calculated using 1-second bins in cleaned event files. If a bin has >2000 counts, and if more than 50% of those come from <1% of pixels, then it is considered to be noise-dominated and hence unusable.
| Quadrant | # 1 sec bins | Bins with >0 counts | Bins with >2000 counts | High rate bins dominated by noise | Noise dominated (total time) | Noise dominated (detector-on time) | Marked lightcurve |
|---|---|---|---|---|---|---|---|
| A | 11493 | 11075 | 1 | 1 | 0.01% | 0.01% | 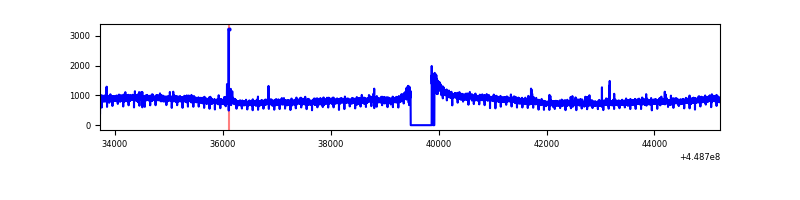 |
| B | 11493 | 11075 | 2710 | 2710 | 23.58% | 24.47% | 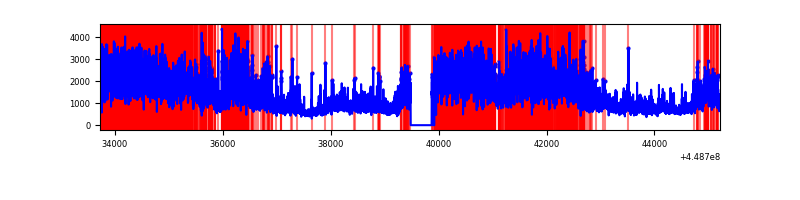 |
| C | 11493 | 11075 | 2 | 2 | 0.02% | 0.02% | 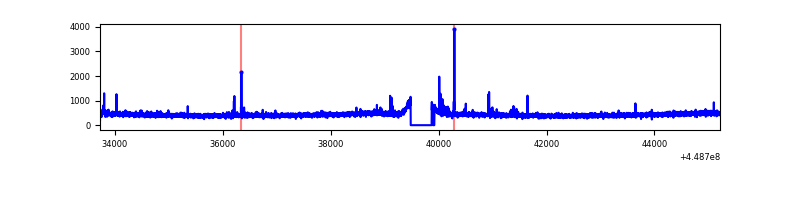 |
| D | 11493 | 11075 | 1448 | 1448 | 12.60% | 13.07% | 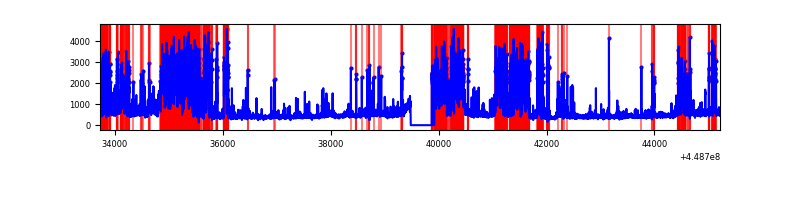 |
Top three noisy pixels from each quadrant. If the there are fewer than three noisy pixels in the level2.evt file, extra rows are filled as -1
| Pixel properties | Quadrant properties | ||||||
|---|---|---|---|---|---|---|---|
| Quadrant | DetID | PixID | Counts | Sigma | Mean | Median | Sigma |
| A | 10 | 83 | 4460336 | 17523.82 | 1217 | 1189 | 254.5 |
| A | 0 | 247 | 32050 | 121.28 | 1217 | 1189 | 254.5 |
| A | 14 | 235 | 20744 | 76.85 | 1217 | 1189 | 254.5 |
| B | 3 | 112 | 10522152 | 50980.6 | 1052 | 1019 | 206.4 |
| B | 4 | 171 | 757356 | 3664.86 | 1052 | 1019 | 206.4 |
| B | 0 | 171 | 322826 | 1559.33 | 1052 | 1019 | 206.4 |
| C | 2 | 14 | 43882 | 152.23 | 1200 | 1207 | 280.3 |
| C | 14 | 254 | 15716 | 51.76 | 1200 | 1207 | 280.3 |
| C | 12 | 249 | 8115 | 24.64 | 1200 | 1207 | 280.3 |
| D | 13 | 249 | 4140078 | 14799.81 | 1111 | 1078 | 279.7 |
| D | 1 | 52 | 432963 | 1544.29 | 1111 | 1078 | 279.7 |
| D | 2 | 249 | 304308 | 1084.26 | 1111 | 1078 | 279.7 |
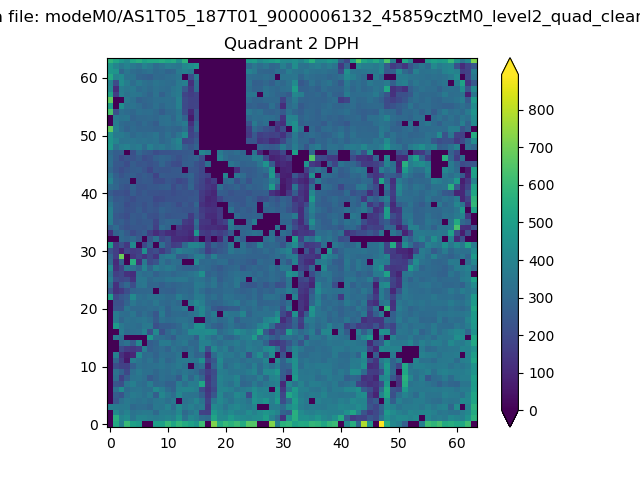
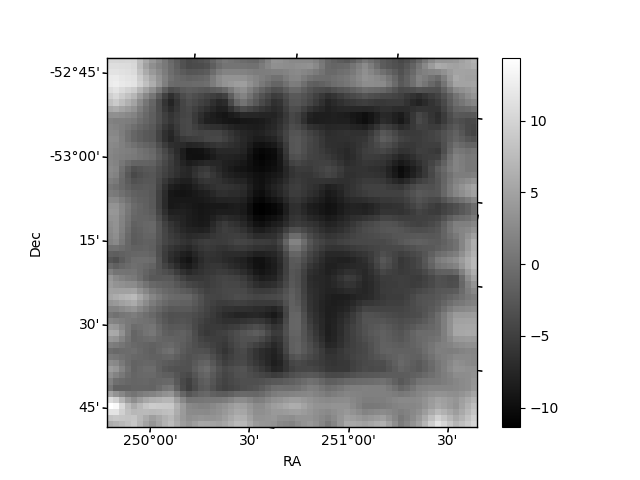
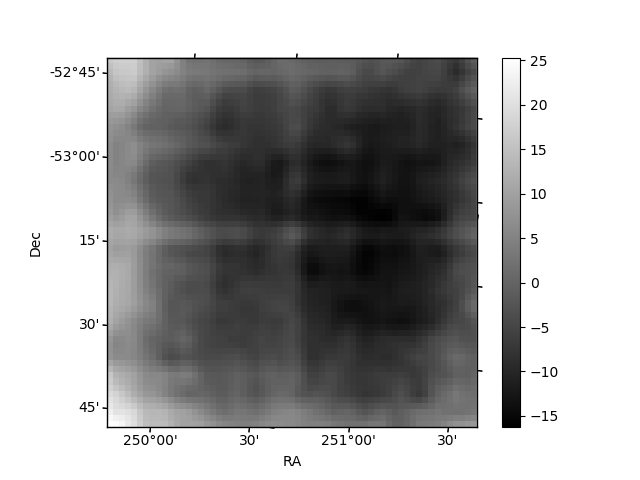
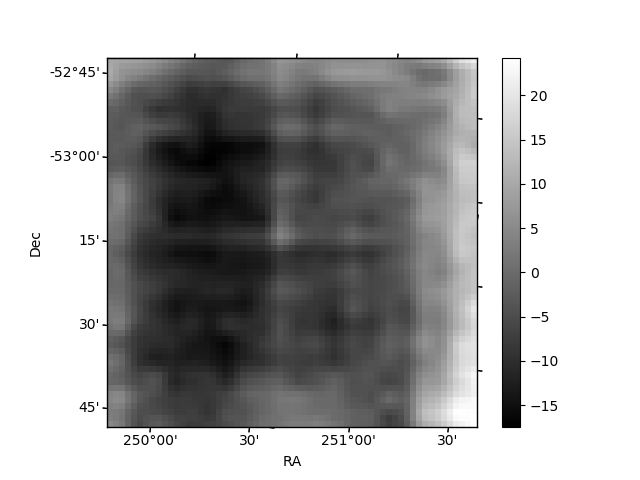
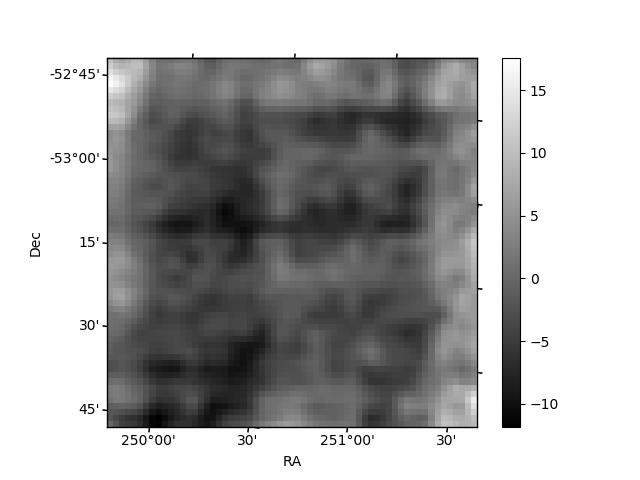
Histogram calculated using DETX and DETY for each event in the final _common_clean file
| Quadrant A | 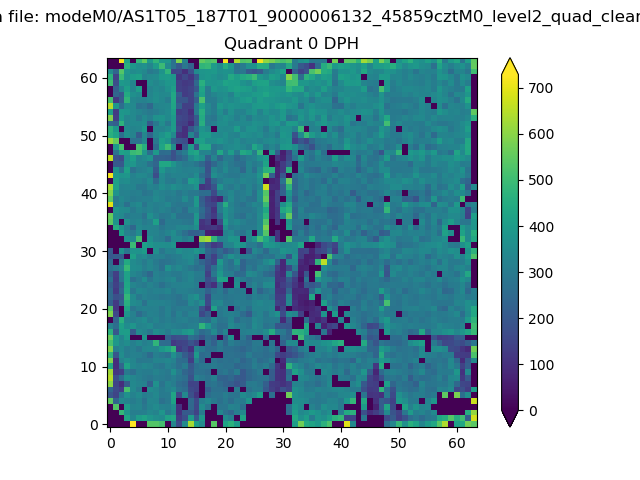 |
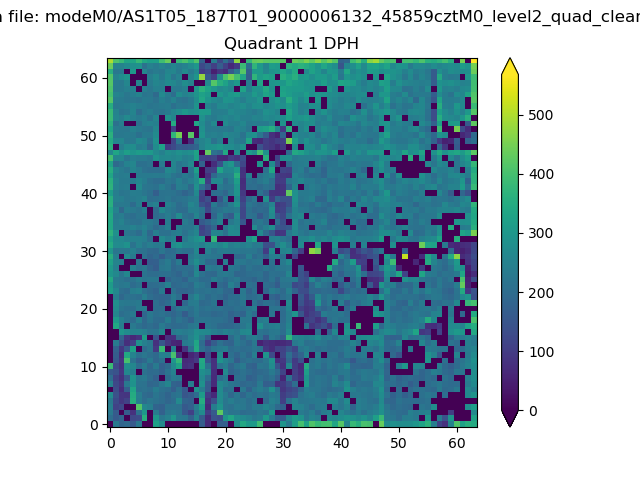 |
Quadrant B |
|---|---|---|---|
| Quadrant D | 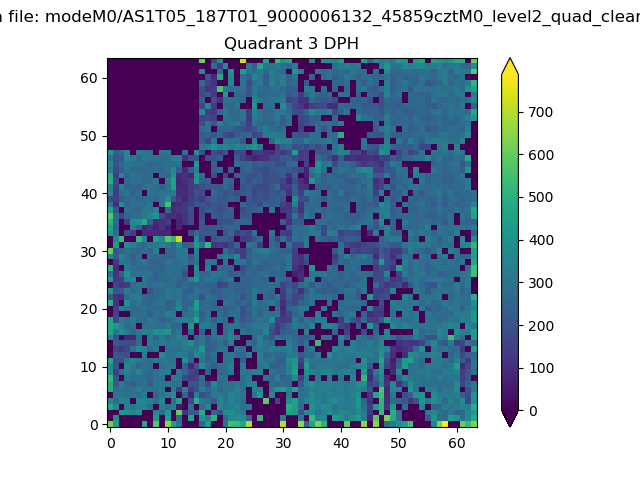 |
 |
Quadrant C |
| Plot type | Count rate plots | Images |
|---|---|---|
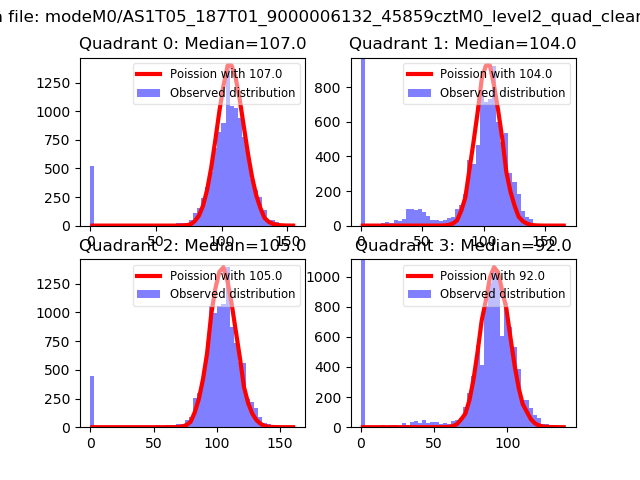
| Comparison with Poisson distribution Blue bars denote a histogram of data divided into 1 sec bins. Red curve is a Poisson curve with rate = median count rate of data. |
 |
 |
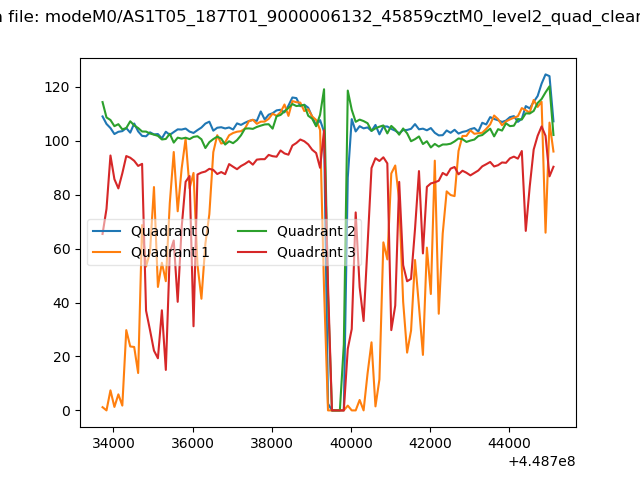
| Quadrant-wise count rates Data is divided into 100 sec bins |
 |
|
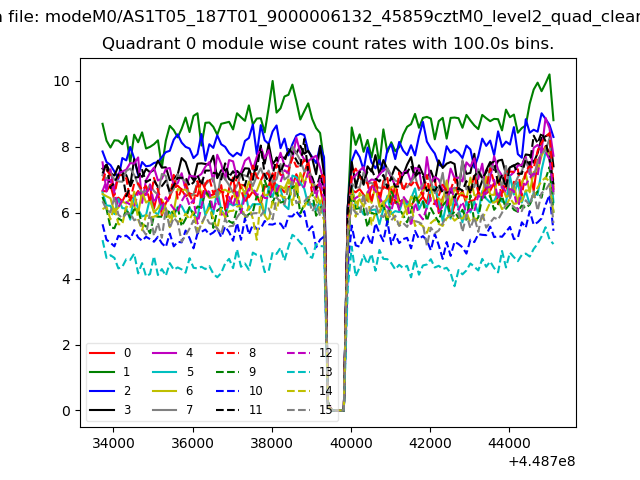
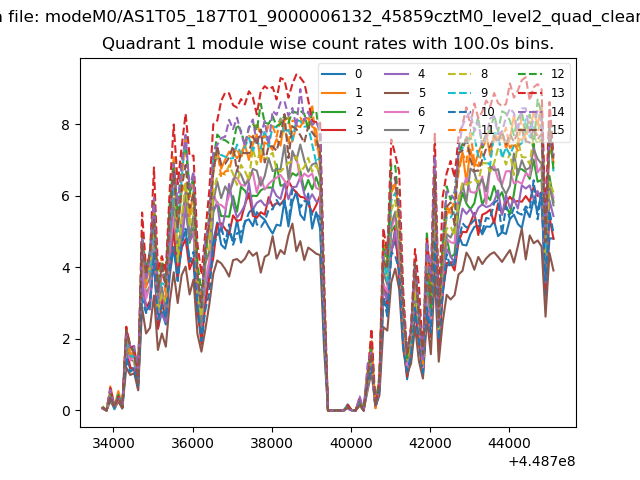
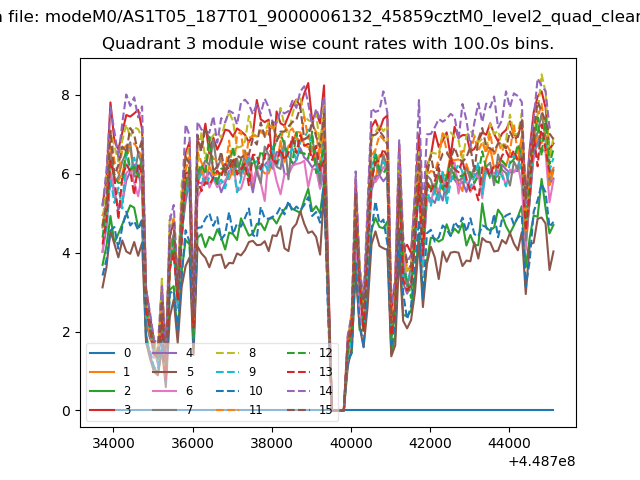
| Module-wise count rates for Quadrant A Data is divided into 100 sec bins |
 |
 |
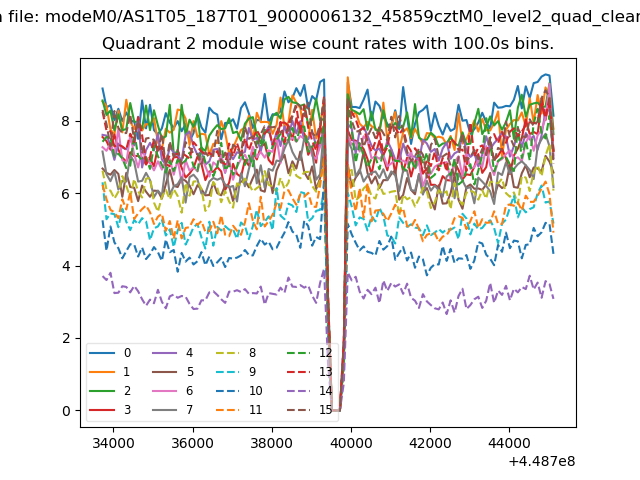
| Module-wise count rates for Quadrant B Data is divided into 100 sec bins |
 |
 |
| Module-wise count rates for Quadrant C Data is divided into 100 sec bins |
 |
 |
| Module-wise count rates for Quadrant D Data is divided into 100 sec bins |
 |
 |
| Parameter | Plot |
|---|---|
| CZT HV Monitor | 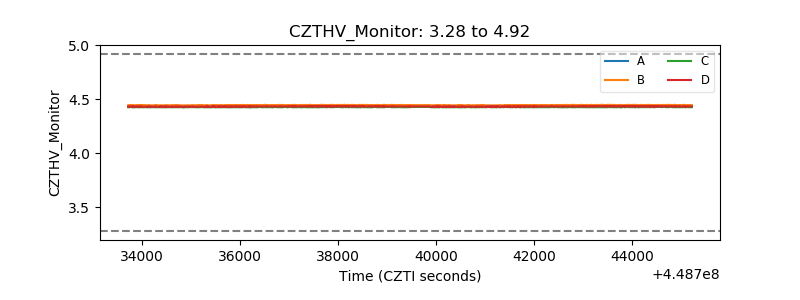 |
| D_VDD | 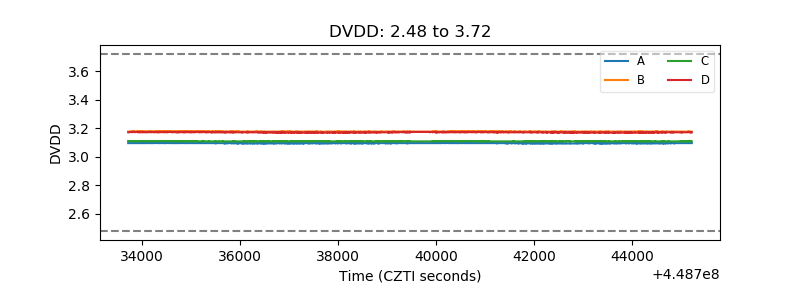 |
| Temperature 1 | 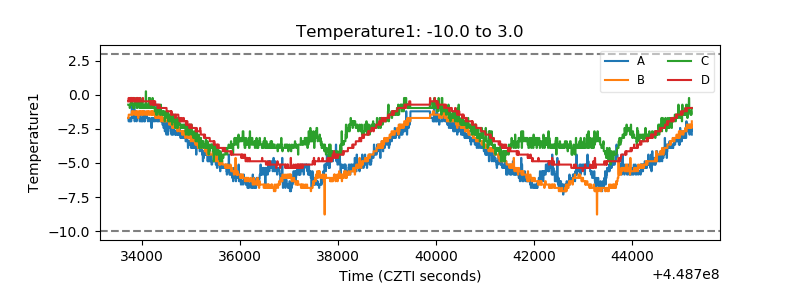 |
| Veto HV Monitor | 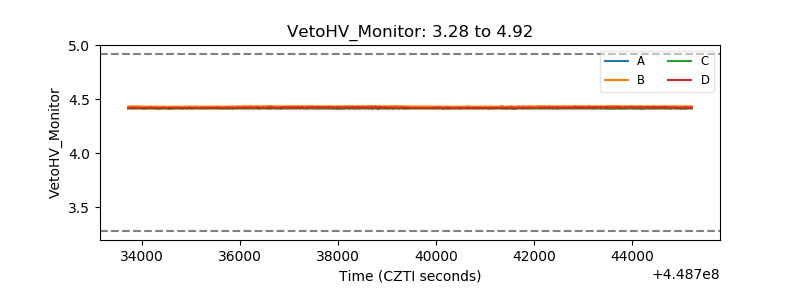 |
| Veto LLD | 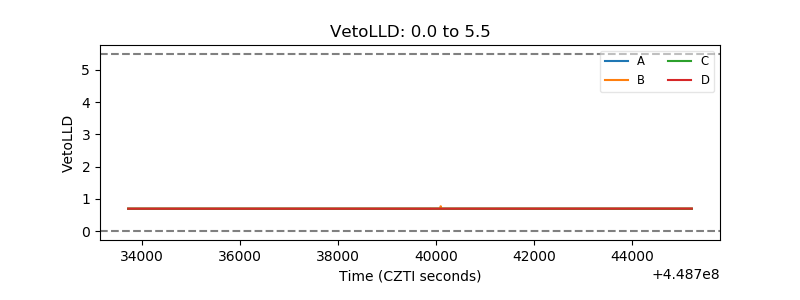 |
| Alpha Counter | 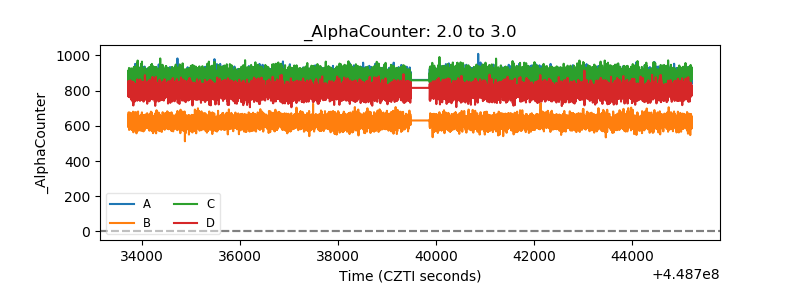 |
| _CPM_Rate | 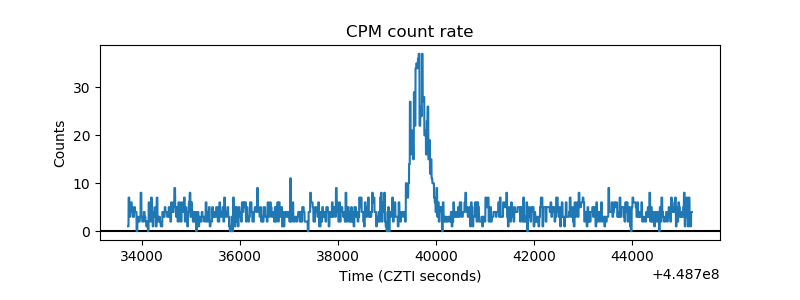 |
| CZT Counter | 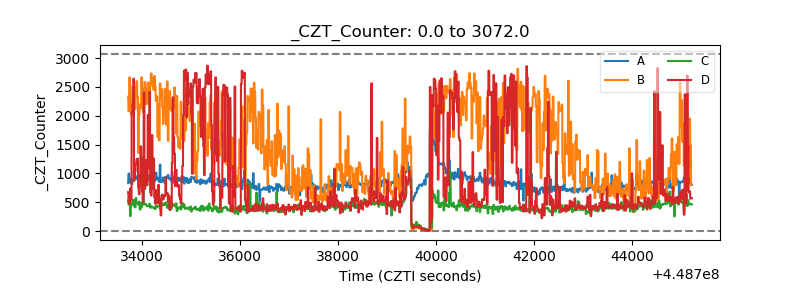 |
| +2.5 Volts monitor | 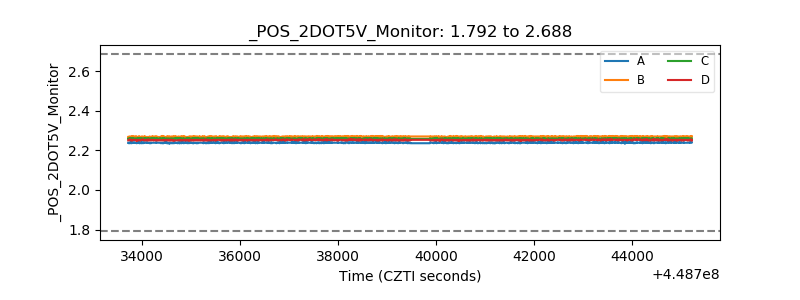 |
| +5 Volts monitor | 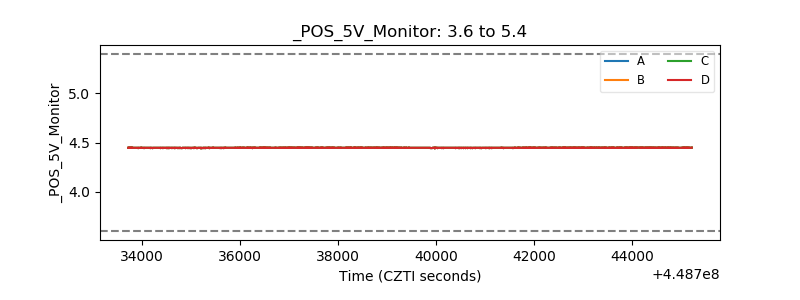 |
| _ROLL_ROT | 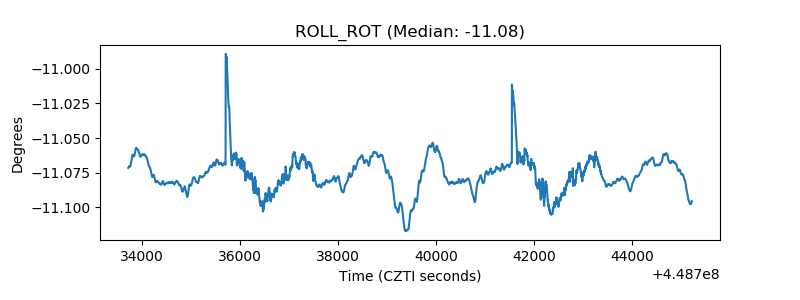 |
| _Roll_DEC | 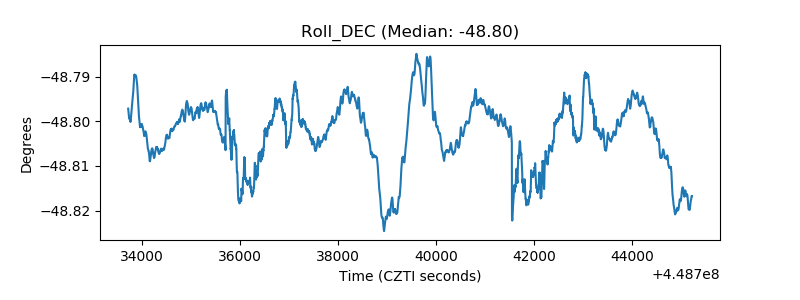 |
| _Roll_RA | 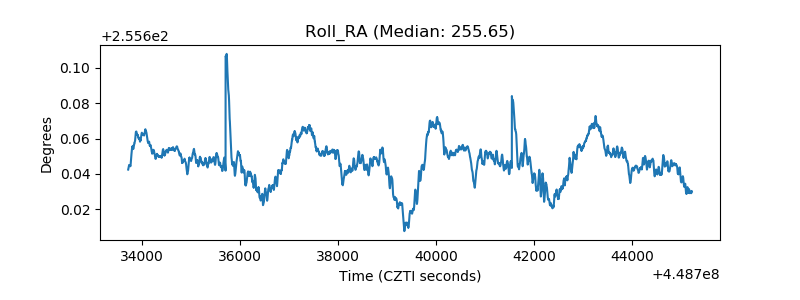 |
| Veto Counter | 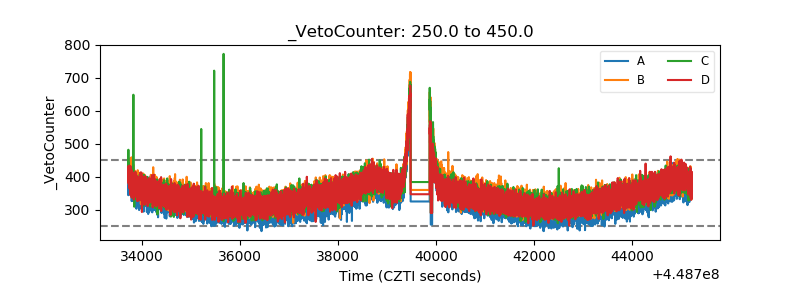 |