| Param | Original file | Final file |
|---|---|---|
| Filename | modeM0/AS1T05_187T01_9000006132_45860cztM0_level2.fits | modeM0/AS1T05_187T01_9000006132_45860cztM0_level2_quad_clean.evt |
| Size (bytes) | 843,042,240 | 119,108,160 |
| Size | 804.0 MB | 113.6 MB |
| Events in quadrant A | 7,203,576 | 869,299 |
| Events in quadrant B | 12,459,407 | 606,749 |
| Events in quadrant C | 3,591,422 | 872,939 |
| Events in quadrant D | 7,318,668 | 687,797 |
| Mode SS | |||
|---|---|---|---|
| Quadrant | BADHDUFLAG | Total packets | Discarded packets |
| A | 0 | 168 | 0 |
| B | 0 | 168 | 0 |
| C | 0 | 168 | 0 |
| D | 0 | 168 | 0 |
| Mode M9 | |||
|---|---|---|---|
| Quadrant | BADHDUFLAG | Total packets | Discarded packets |
| A | 0 | 14 | 0 |
| B | 0 | 14 | 0 |
| C | 0 | 14 | 0 |
| D | 0 | 14 | 0 |
| Mode M0 | |||
|---|---|---|---|
| Quadrant | BADHDUFLAG | Total packets | Discarded packets |
| A | 0 | 26958 | 2 |
| B | 0 | 42735 | 2 |
| C | 0 | 16631 | 2 |
| D | 0 | 27436 | 2 |
| Quadrant | Total seconds | Saturated seconds | Saturation percentage |
|---|---|---|---|
| A | 8187 | 290 | 3.542201% |
| B | 8188 | 3217 | 39.289204% |
| C | 8188 | 28 | 0.341964% |
| D | 8187 | 1203 | 14.694027% |
Noise dominated data is calculated using 1-second bins in cleaned event files. If a bin has >2000 counts, and if more than 50% of those come from <1% of pixels, then it is considered to be noise-dominated and hence unusable.
| Quadrant | # 1 sec bins | Bins with >0 counts | Bins with >2000 counts | High rate bins dominated by noise | Noise dominated (total time) | Noise dominated (detector-on time) | Marked lightcurve |
|---|---|---|---|---|---|---|---|
| A | 9632 | 8189 | 43 | 43 | 0.45% | 0.53% | 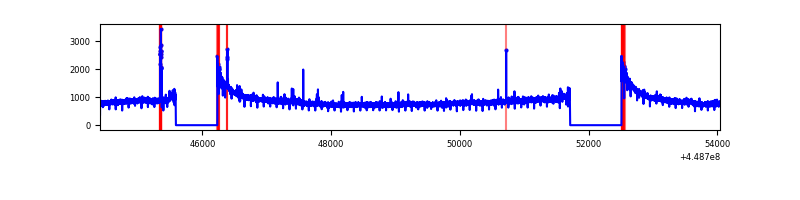 |
| B | 9633 | 8188 | 1998 | 1998 | 20.74% | 24.40% | 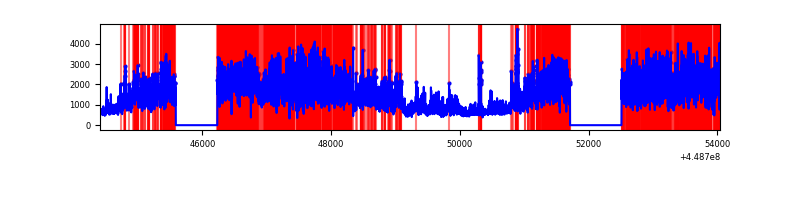 |
| C | 9633 | 8190 | 0 | 0 | 0.00% | 0.00% | 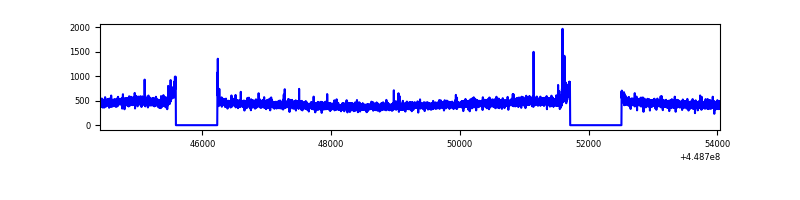 |
| D | 9632 | 8187 | 975 | 975 | 10.12% | 11.91% | 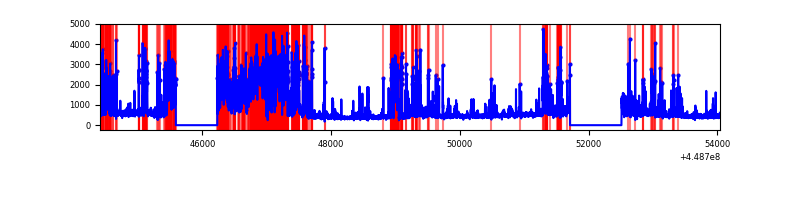 |
Top three noisy pixels from each quadrant. If the there are fewer than three noisy pixels in the level2.evt file, extra rows are filled as -1
| Pixel properties | Quadrant properties | ||||||
|---|---|---|---|---|---|---|---|
| Quadrant | DetID | PixID | Counts | Sigma | Mean | Median | Sigma |
| A | 10 | 83 | 3515236 | 18232.01 | 924 | 904 | 192.8 |
| A | 14 | 254 | 38449 | 194.78 | 924 | 904 | 192.8 |
| A | 14 | 238 | 23830 | 118.94 | 924 | 904 | 192.8 |
| B | 3 | 112 | 8163796 | 51295.54 | 808 | 783 | 159.1 |
| B | 4 | 171 | 438729 | 2752.01 | 808 | 783 | 159.1 |
| B | 0 | 171 | 218882 | 1370.51 | 808 | 783 | 159.1 |
| C | 12 | 2 | 26328 | 118.2 | 911 | 916 | 215.0 |
| C | 3 | 233 | 8279 | 34.25 | 911 | 916 | 215.0 |
| C | 13 | 61 | 5963 | 23.48 | 911 | 916 | 215.0 |
| D | 13 | 249 | 2473054 | 11537.64 | 845 | 816 | 214.3 |
| D | 6 | 143 | 374308 | 1743.04 | 845 | 816 | 214.3 |
| D | 12 | 2 | 216692 | 1007.47 | 845 | 816 | 214.3 |
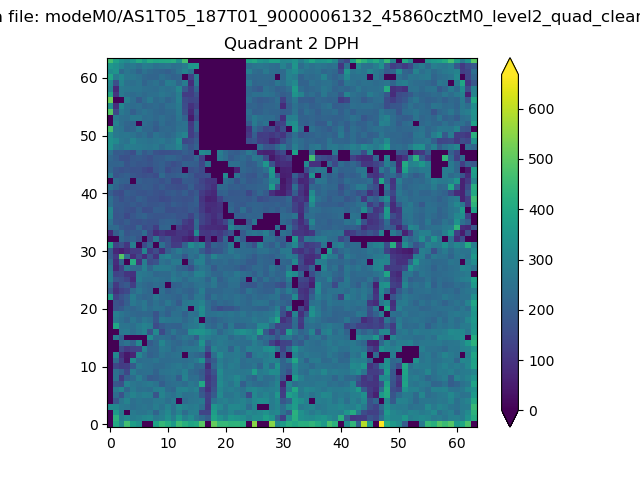
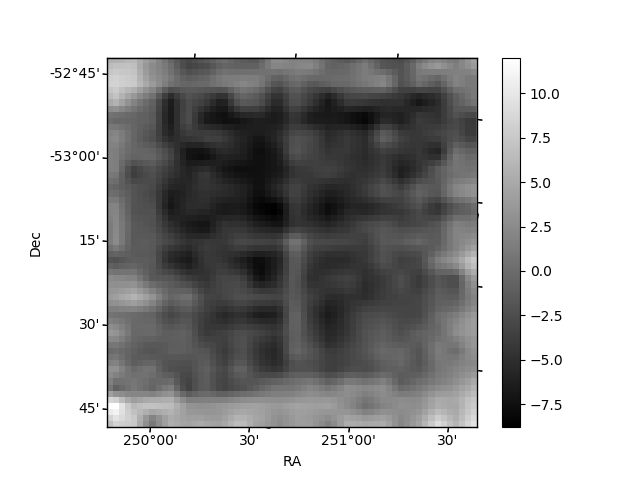
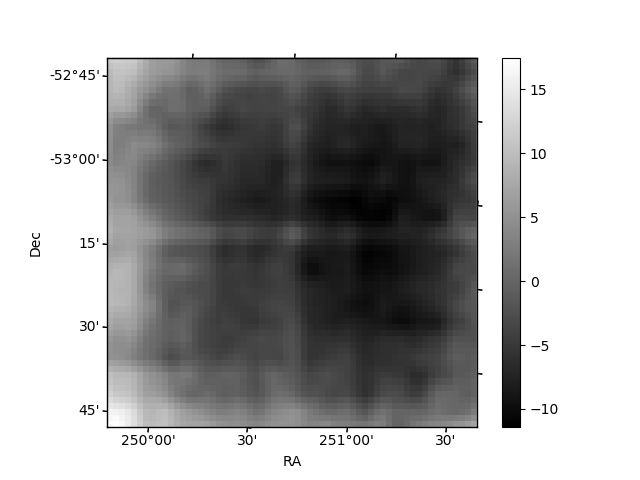
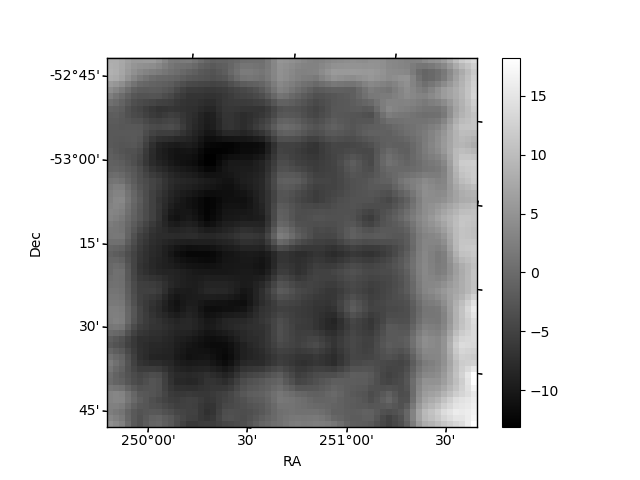
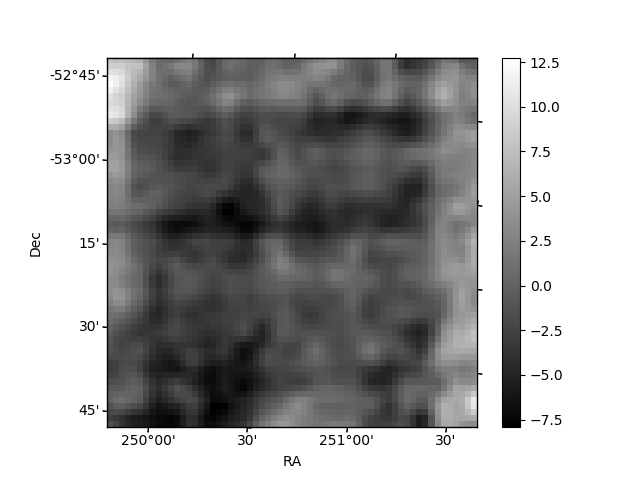
Histogram calculated using DETX and DETY for each event in the final _common_clean file
| Quadrant A | 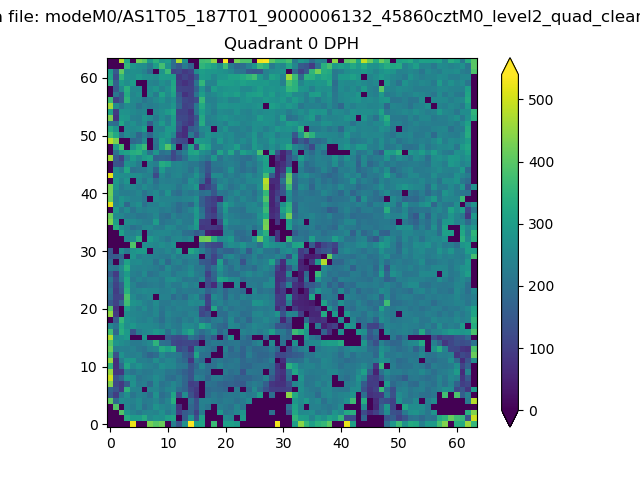 |
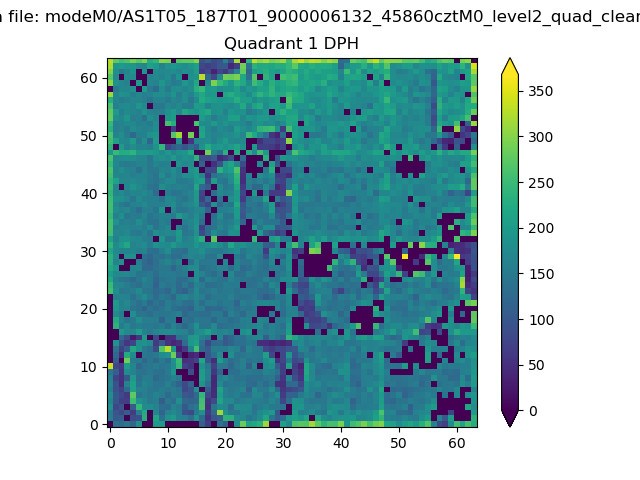 |
Quadrant B |
|---|---|---|---|
| Quadrant D | 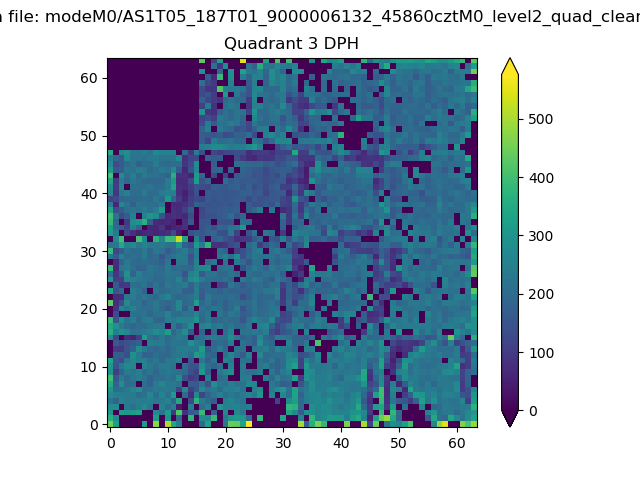 |
 |
Quadrant C |
| Plot type | Count rate plots | Images |
|---|---|---|
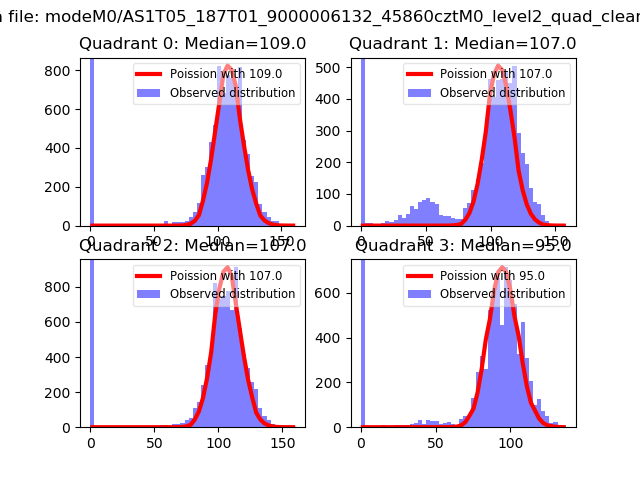
| Comparison with Poisson distribution Blue bars denote a histogram of data divided into 1 sec bins. Red curve is a Poisson curve with rate = median count rate of data. |
 |
 |
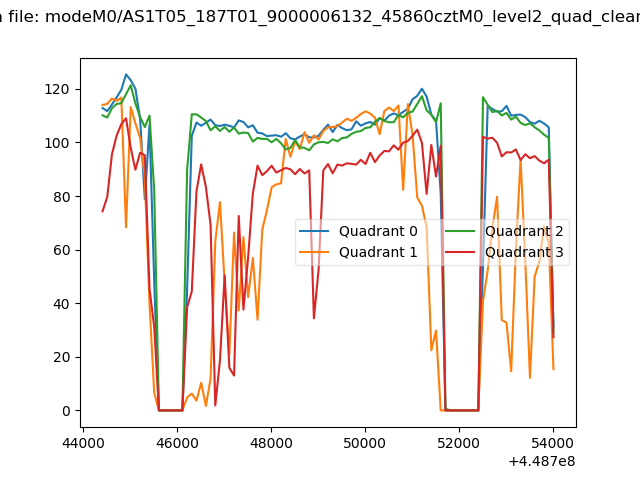
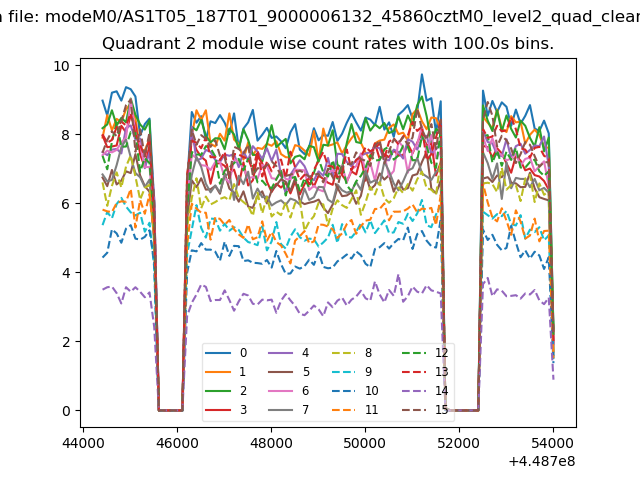
| Quadrant-wise count rates Data is divided into 100 sec bins |
 |
|
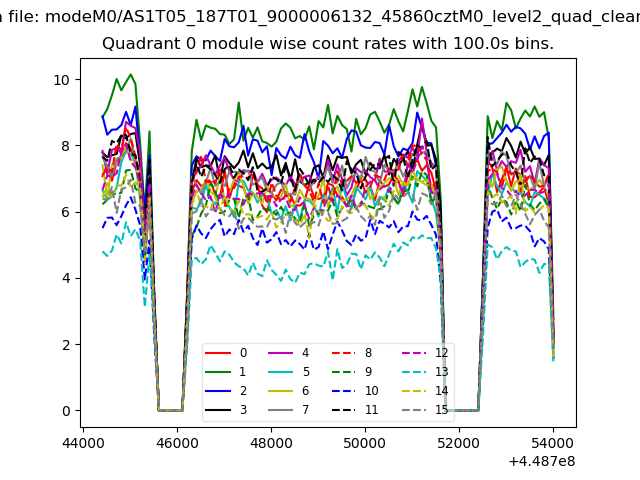
| Module-wise count rates for Quadrant A Data is divided into 100 sec bins |
 |
 |
| Module-wise count rates for Quadrant B Data is divided into 100 sec bins |
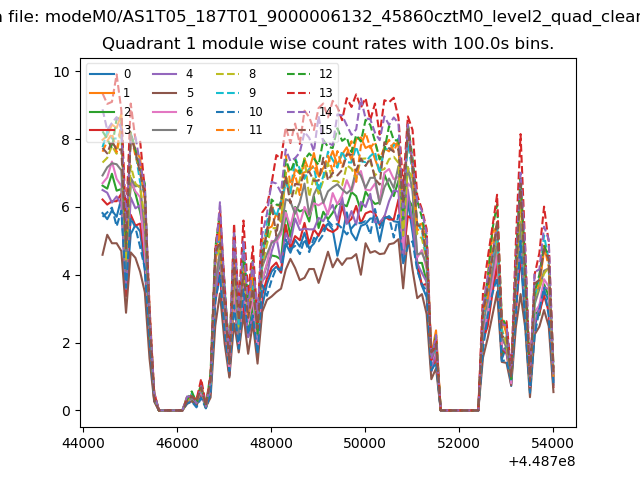 |
 |
| Module-wise count rates for Quadrant C Data is divided into 100 sec bins |
 |
 |
| Module-wise count rates for Quadrant D Data is divided into 100 sec bins |
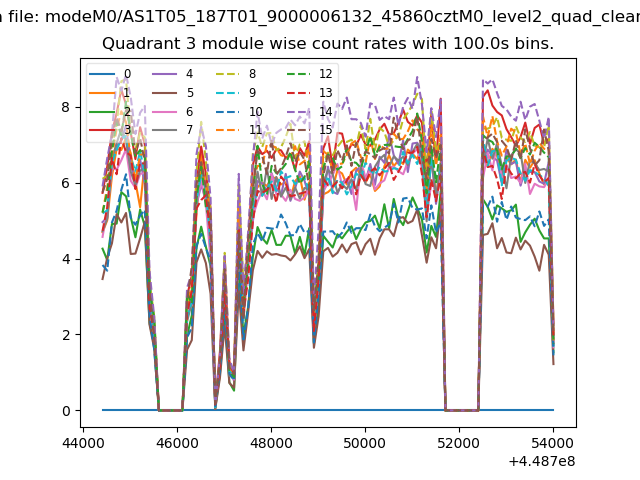 |
 |
| Parameter | Plot |
|---|---|
| CZT HV Monitor | 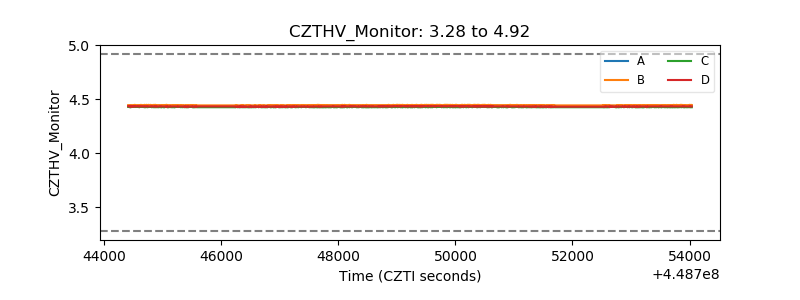 |
| D_VDD | 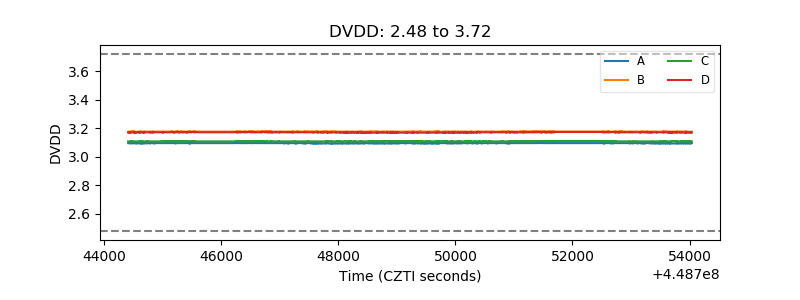 |
| Temperature 1 | 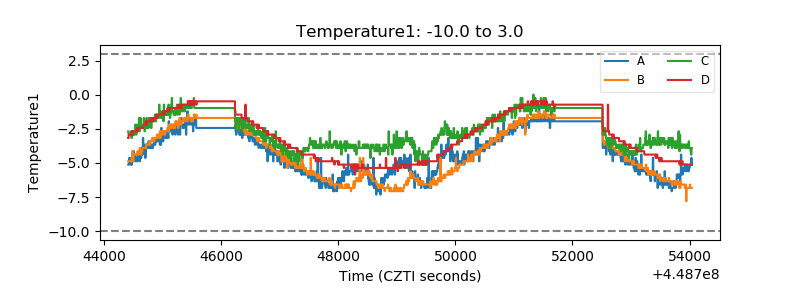 |
| Veto HV Monitor | 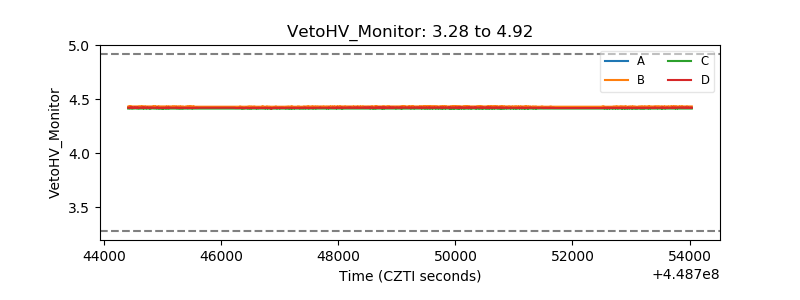 |
| Veto LLD | 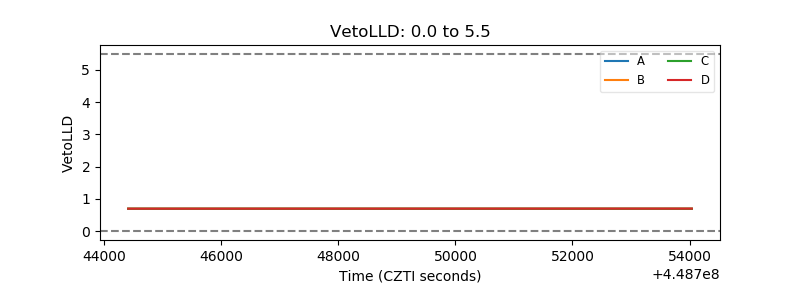 |
| Alpha Counter | 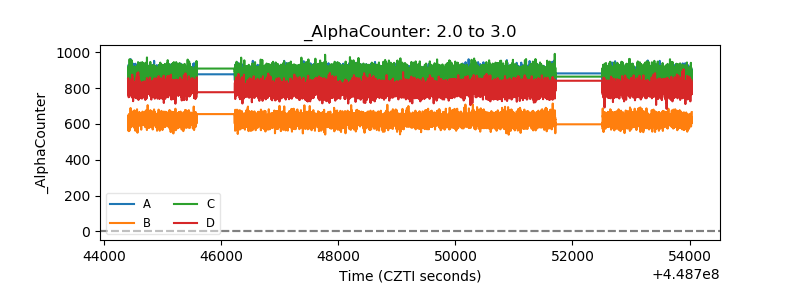 |
| _CPM_Rate | 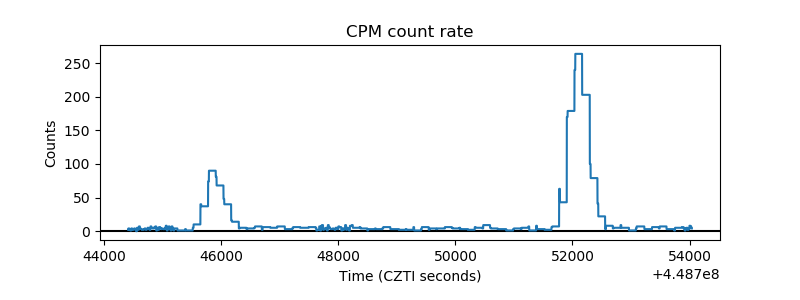 |
| CZT Counter | 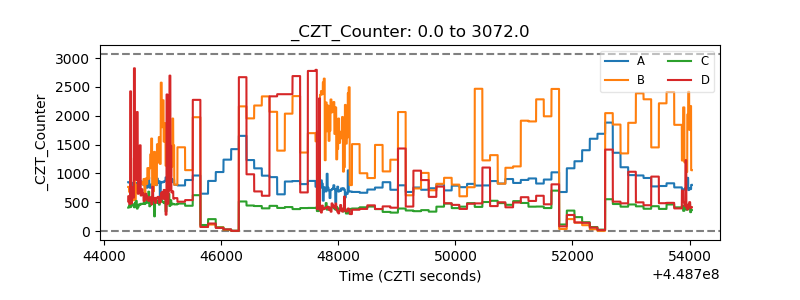 |
| +2.5 Volts monitor |  |
| +5 Volts monitor | 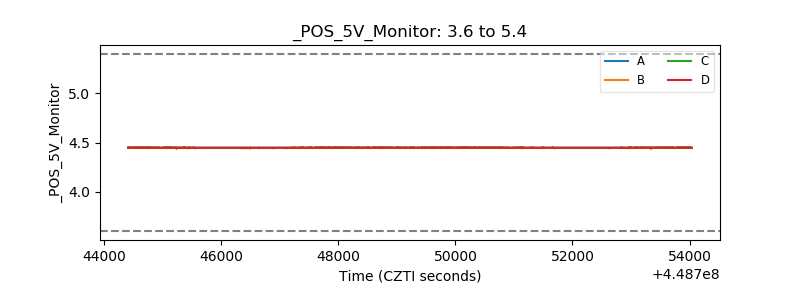 |
| _ROLL_ROT | 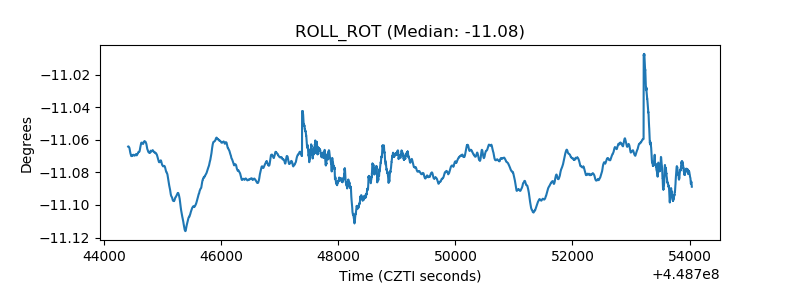 |
| _Roll_DEC | 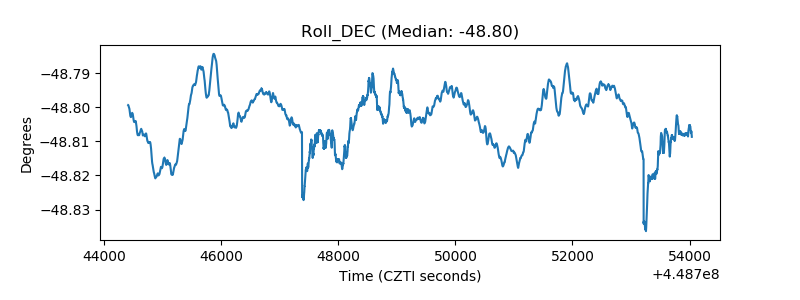 |
| _Roll_RA | 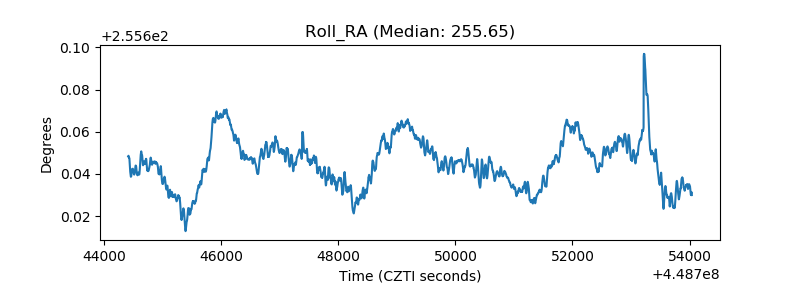 |
| Veto Counter | 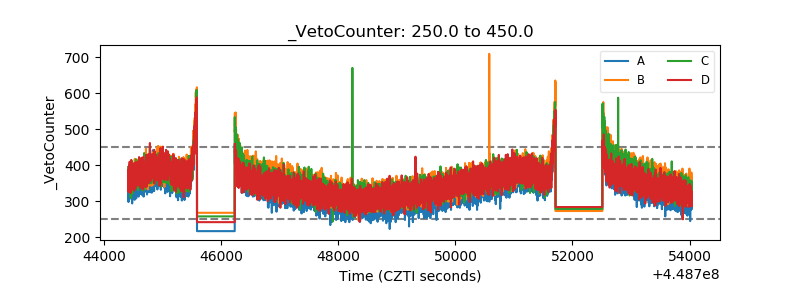 |