| Param | Original file | Final file |
|---|---|---|
| Filename | modeM0/AS1T05_187T01_9000006132_45861cztM0_level2.fits | modeM0/AS1T05_187T01_9000006132_45861cztM0_level2_quad_clean.evt |
| Size (bytes) | 640,045,440 | 99,161,280 |
| Size | 610.4 MB | 94.6 MB |
| Events in quadrant A | 5,688,461 | 712,194 |
| Events in quadrant B | 10,480,568 | 481,894 |
| Events in quadrant C | 2,845,426 | 709,502 |
| Events in quadrant D | 4,165,297 | 637,996 |
| Mode SS | |||
|---|---|---|---|
| Quadrant | BADHDUFLAG | Total packets | Discarded packets |
| A | 0 | 132 | 0 |
| B | 0 | 132 | 0 |
| C | 0 | 132 | 0 |
| D | 0 | 132 | 0 |
| Mode M9 | |||
|---|---|---|---|
| Quadrant | BADHDUFLAG | Total packets | Discarded packets |
| A | 0 | 10 | 0 |
| B | 0 | 10 | 0 |
| C | 0 | 10 | 0 |
| D | 0 | 10 | 0 |
| Mode M0 | |||
|---|---|---|---|
| Quadrant | BADHDUFLAG | Total packets | Discarded packets |
| A | 0 | 21571 | 1 |
| B | 0 | 35684 | 1 |
| C | 0 | 13328 | 2 |
| D | 0 | 17049 | 1 |
| Quadrant | Total seconds | Saturated seconds | Saturation percentage |
|---|---|---|---|
| A | 6614 | 117 | 1.768975% |
| B | 6614 | 2643 | 39.960689% |
| C | 6613 | 7 | 0.105852% |
| D | 6614 | 119 | 1.799214% |
Noise dominated data is calculated using 1-second bins in cleaned event files. If a bin has >2000 counts, and if more than 50% of those come from <1% of pixels, then it is considered to be noise-dominated and hence unusable.
| Quadrant | # 1 sec bins | Bins with >0 counts | Bins with >2000 counts | High rate bins dominated by noise | Noise dominated (total time) | Noise dominated (detector-on time) | Marked lightcurve |
|---|---|---|---|---|---|---|---|
| A | 7560 | 6615 | 28 | 28 | 0.37% | 0.42% | 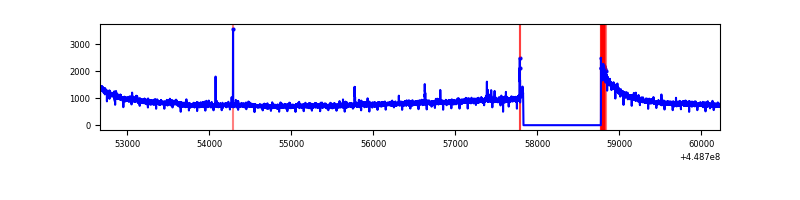 |
| B | 7560 | 6614 | 1821 | 1821 | 24.09% | 27.53% | 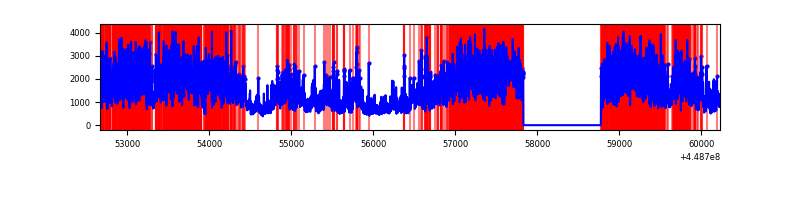 |
| C | 7559 | 6614 | 0 | 0 | 0.00% | 0.00% | 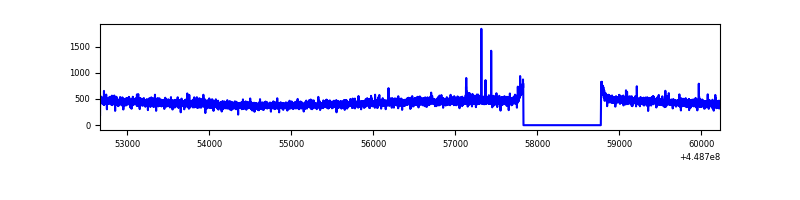 |
| D | 7560 | 6615 | 99 | 99 | 1.31% | 1.50% | 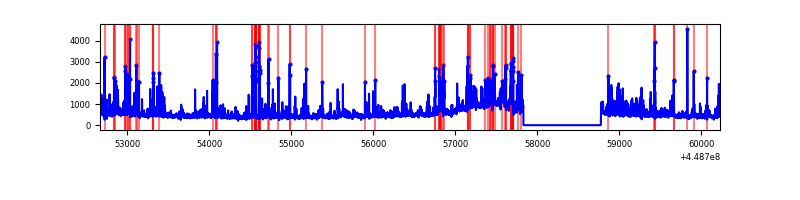 |
Top three noisy pixels from each quadrant. If the there are fewer than three noisy pixels in the level2.evt file, extra rows are filled as -1
| Pixel properties | Quadrant properties | ||||||
|---|---|---|---|---|---|---|---|
| Quadrant | DetID | PixID | Counts | Sigma | Mean | Median | Sigma |
| A | 10 | 83 | 2813755 | 18548.33 | 729 | 714 | 151.7 |
| A | 14 | 235 | 14344 | 89.87 | 729 | 714 | 151.7 |
| A | 0 | 243 | 11441 | 70.73 | 729 | 714 | 151.7 |
| B | 3 | 112 | 7364855 | 59961.4 | 626 | 608 | 122.8 |
| B | 0 | 189 | 213421 | 1732.77 | 626 | 608 | 122.8 |
| B | 0 | 171 | 122513 | 992.58 | 626 | 608 | 122.8 |
| C | 3 | 233 | 8183 | 43.68 | 724 | 729 | 170.7 |
| C | 12 | 2 | 5732 | 29.32 | 724 | 729 | 170.7 |
| C | 2 | 14 | 5729 | 29.3 | 724 | 729 | 170.7 |
| D | 7 | 38 | 341511 | 1892.66 | 712 | 689 | 180.1 |
| D | 1 | 52 | 269480 | 1492.66 | 712 | 689 | 180.1 |
| D | 13 | 249 | 231895 | 1283.94 | 712 | 689 | 180.1 |
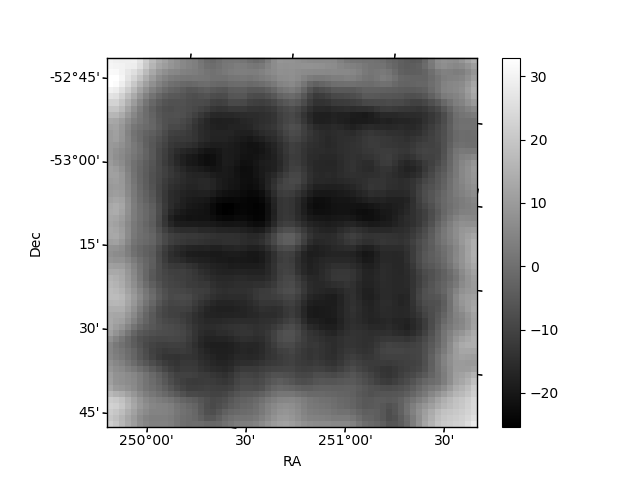
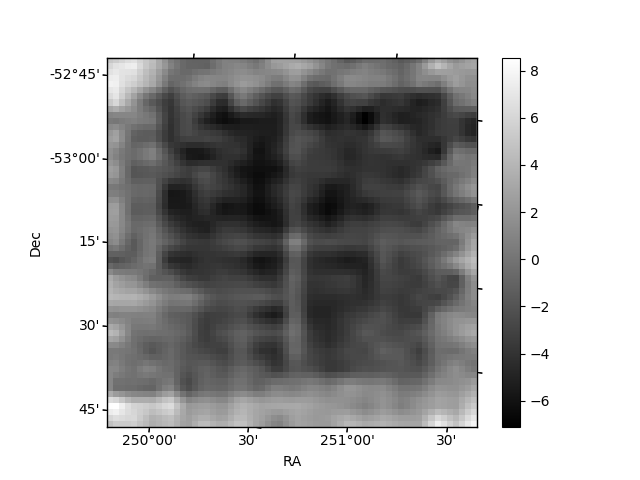
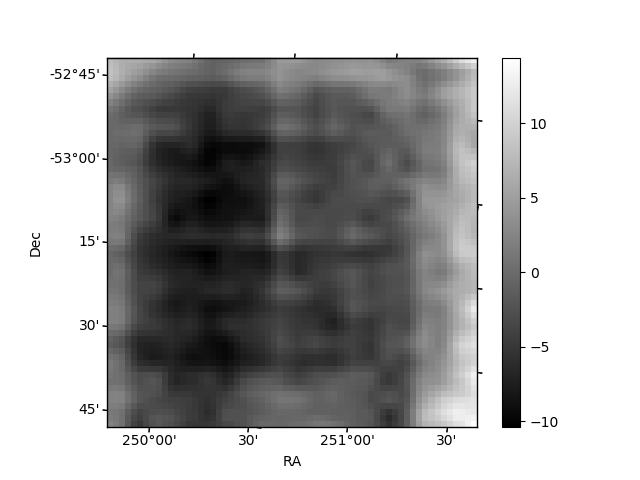
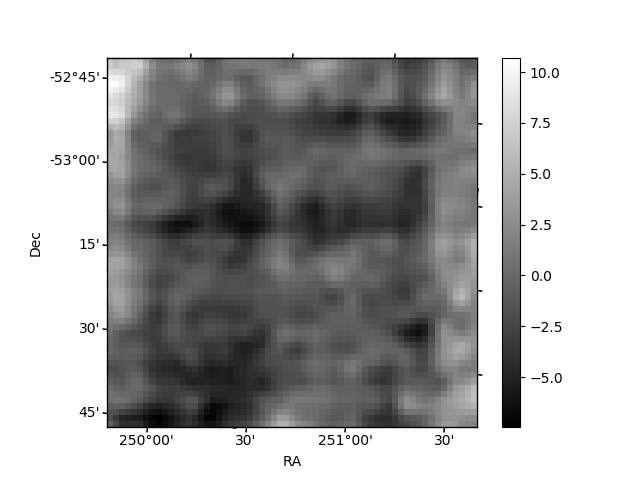
Histogram calculated using DETX and DETY for each event in the final _common_clean file
| Quadrant A | 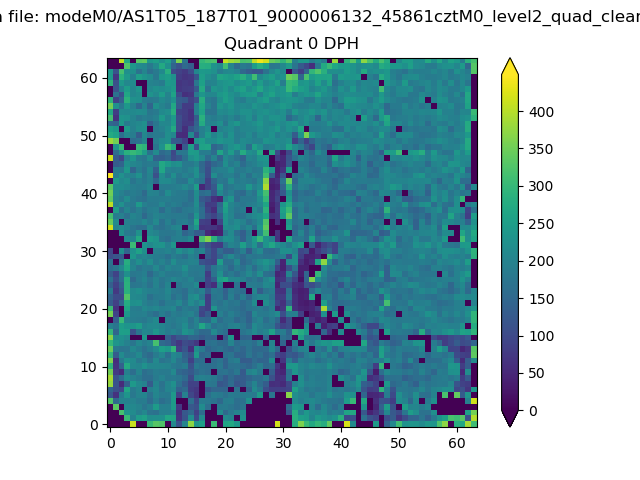 |
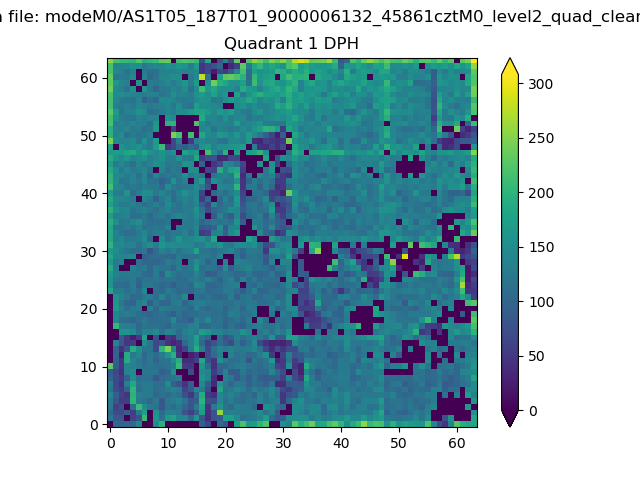 |
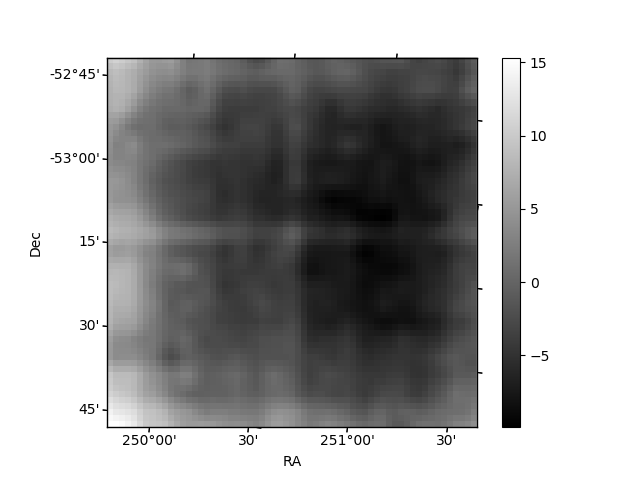
Quadrant B |
|---|---|---|---|
| Quadrant D | 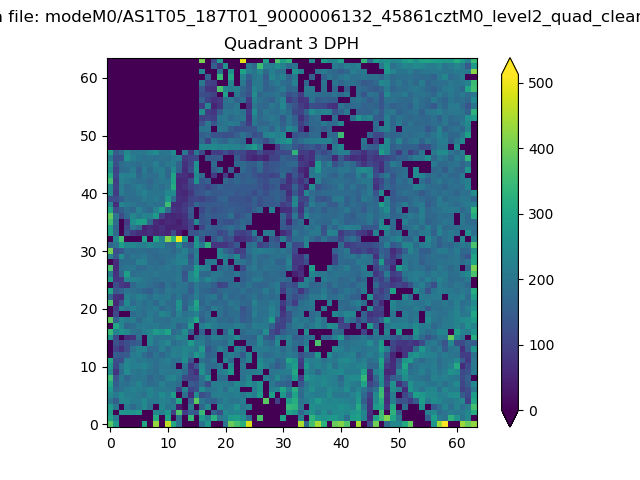 |
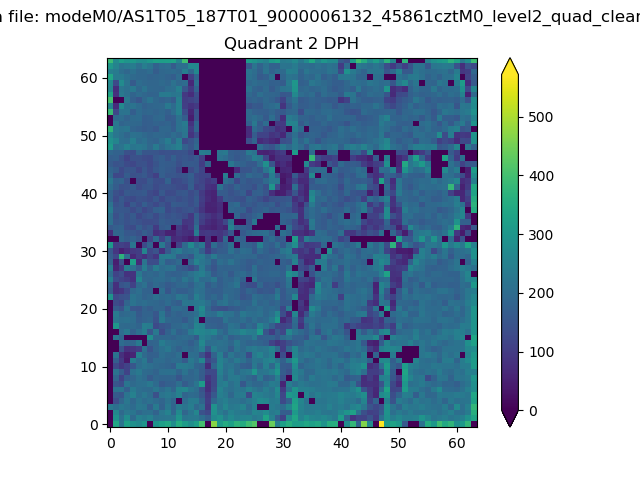 |
Quadrant C |
| Plot type | Count rate plots | Images |
|---|---|---|
| Comparison with Poisson distribution Blue bars denote a histogram of data divided into 1 sec bins. Red curve is a Poisson curve with rate = median count rate of data. |
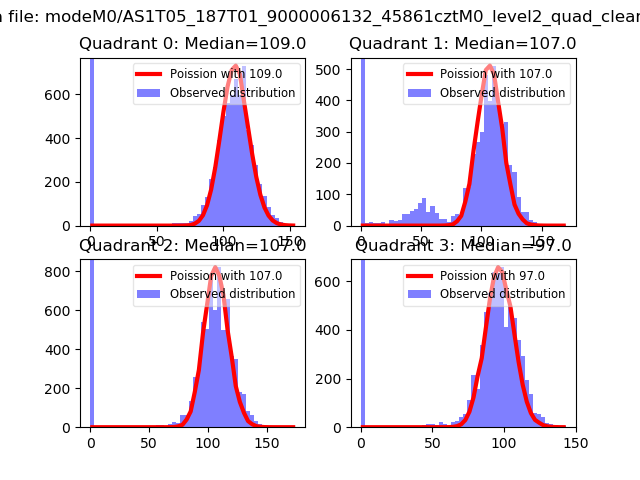 |
 |
| Quadrant-wise count rates Data is divided into 100 sec bins |
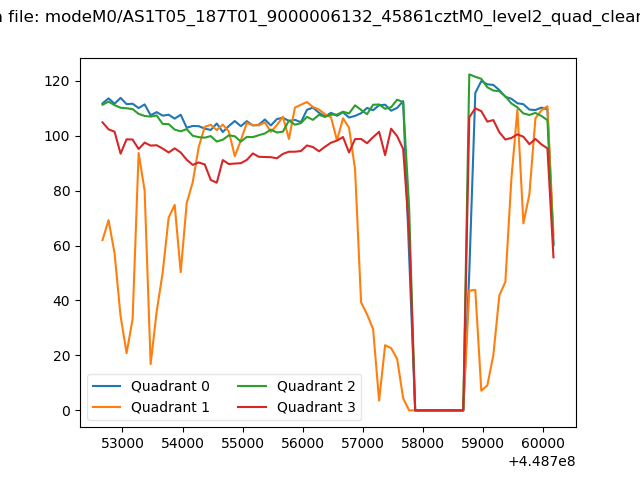 |
|
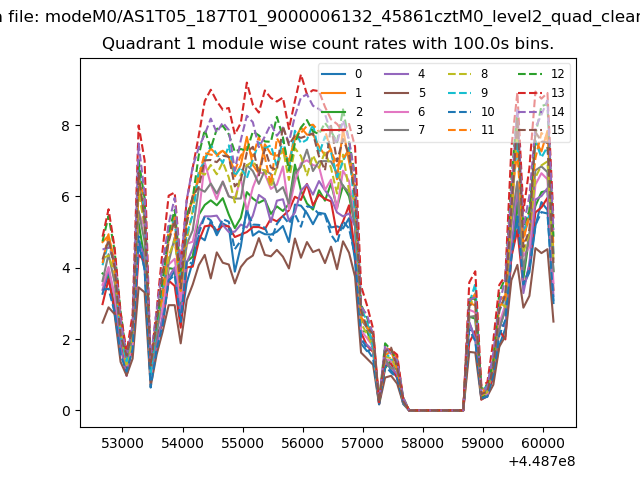
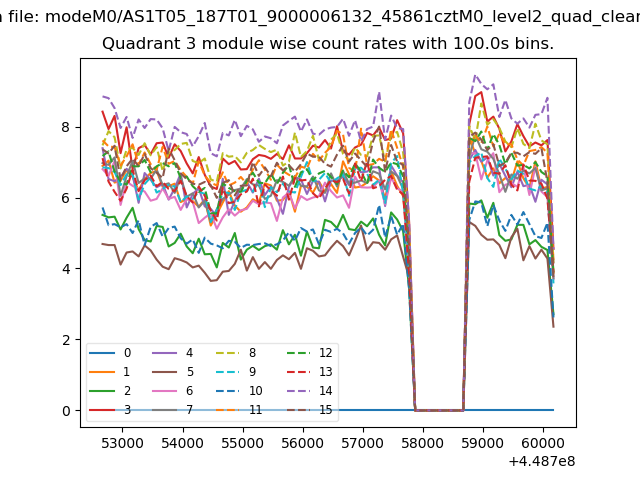
| Module-wise count rates for Quadrant A Data is divided into 100 sec bins |
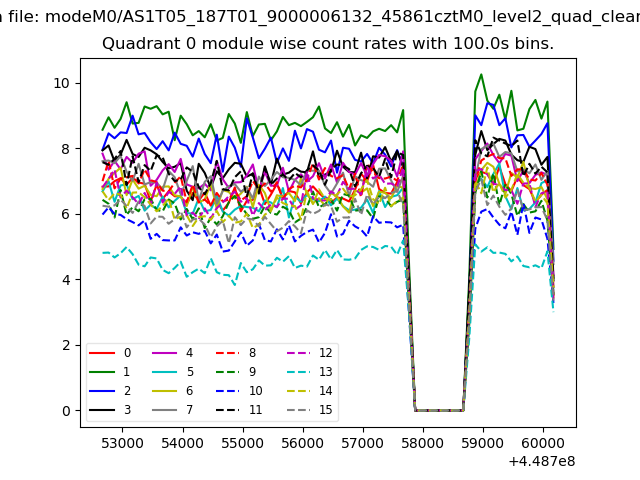 |
 |
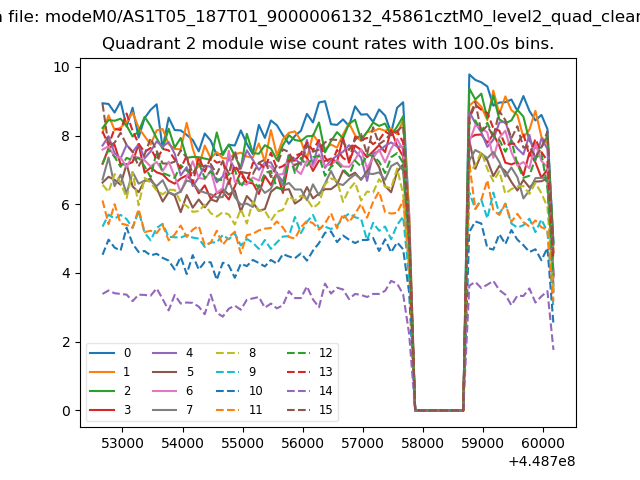
| Module-wise count rates for Quadrant B Data is divided into 100 sec bins |
 |
 |
| Module-wise count rates for Quadrant C Data is divided into 100 sec bins |
 |
 |
| Module-wise count rates for Quadrant D Data is divided into 100 sec bins |
 |
 |
| Parameter | Plot |
|---|---|
| CZT HV Monitor | 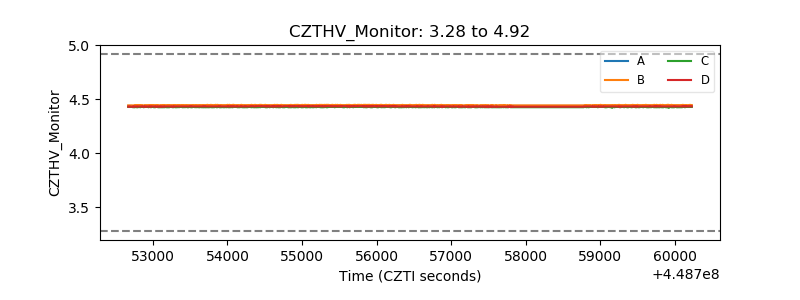 |
| D_VDD | 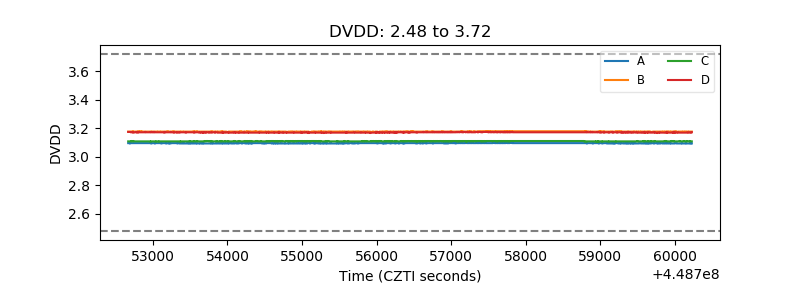 |
| Temperature 1 | 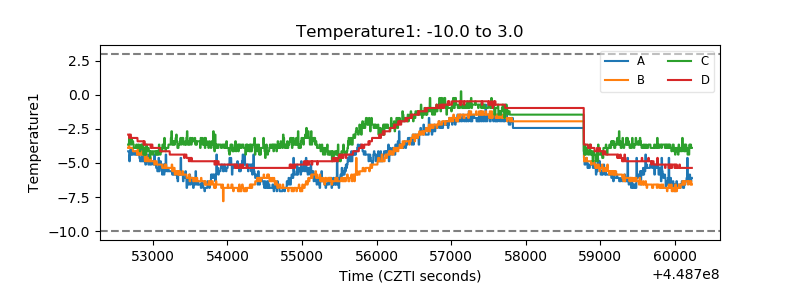 |
| Veto HV Monitor | 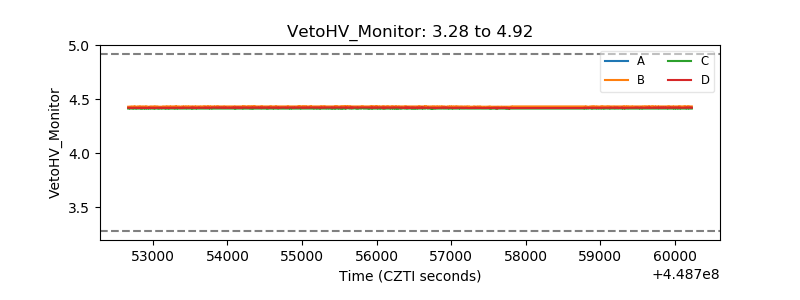 |
| Veto LLD | 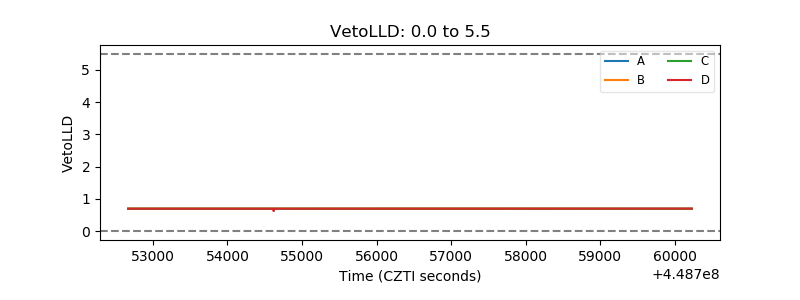 |
| Alpha Counter | 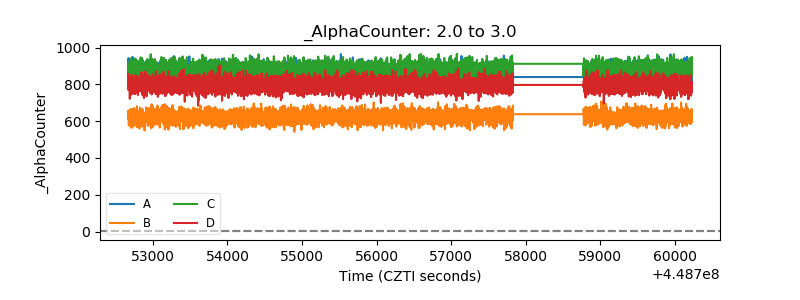 |
| _CPM_Rate | 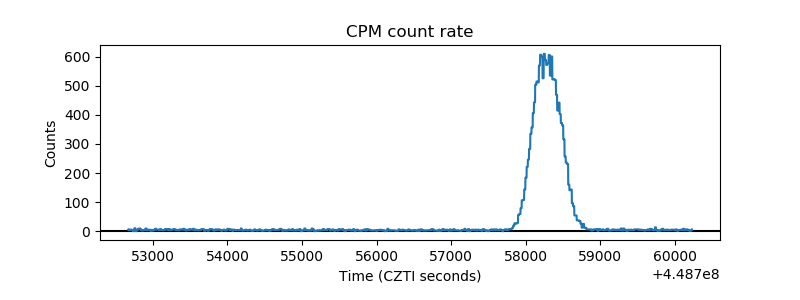 |
| CZT Counter | 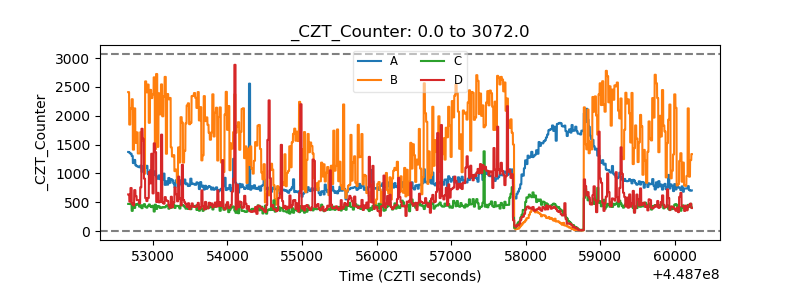 |
| +2.5 Volts monitor | 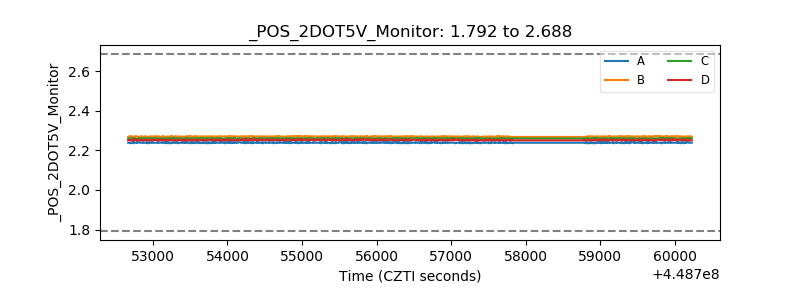 |
| +5 Volts monitor | 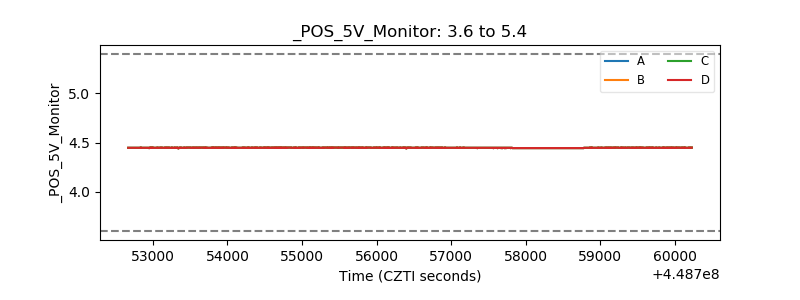 |
| _ROLL_ROT | 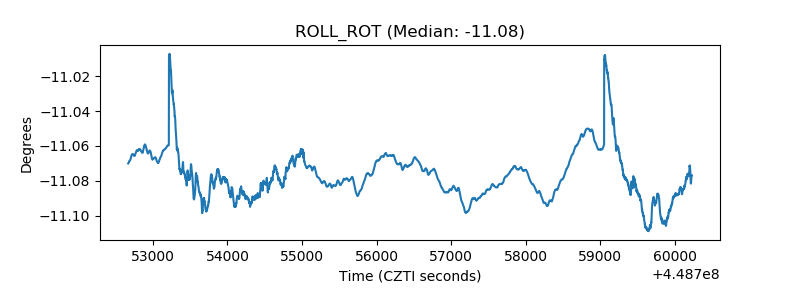 |
| _Roll_DEC | 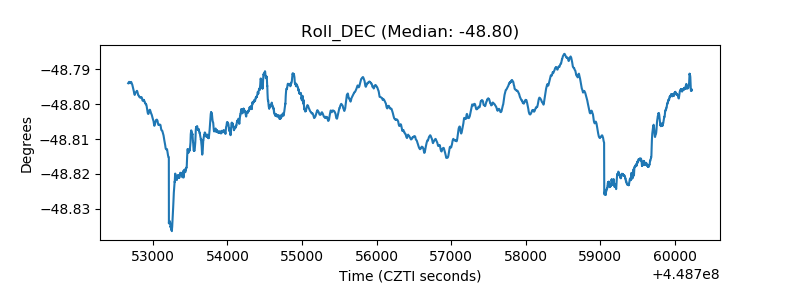 |
| _Roll_RA | 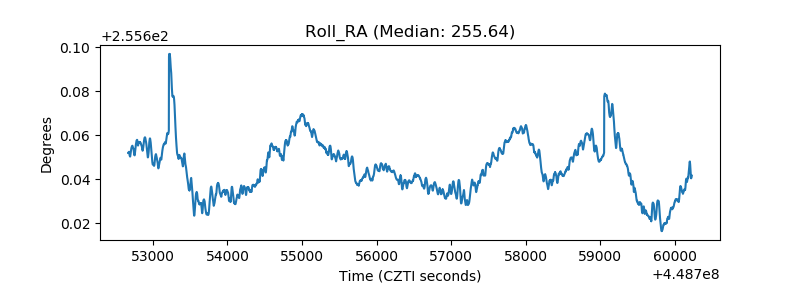 |
| Veto Counter | 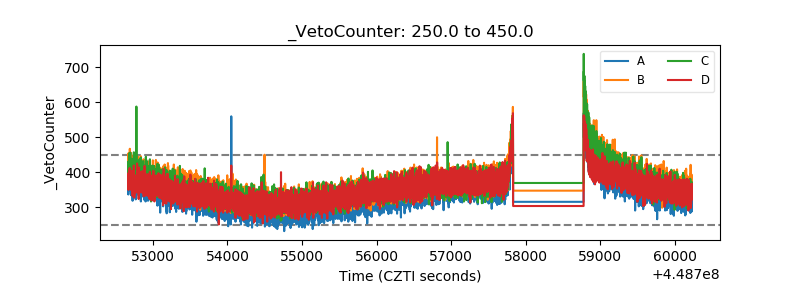 |