| Param | Original file | Final file |
|---|---|---|
| Filename | modeM0/AS1T05_187T01_9000006132_45863cztM0_level2.fits | modeM0/AS1T05_187T01_9000006132_45863cztM0_level2_quad_clean.evt |
| Size (bytes) | 538,960,320 | 99,849,600 |
| Size | 514.0 MB | 95.2 MB |
| Events in quadrant A | 5,353,281 | 691,993 |
| Events in quadrant B | 7,966,962 | 578,053 |
| Events in quadrant C | 2,786,937 | 691,305 |
| Events in quadrant D | 3,356,649 | 623,618 |
| Mode SS | |||
|---|---|---|---|
| Quadrant | BADHDUFLAG | Total packets | Discarded packets |
| A | 0 | 128 | 0 |
| B | 0 | 128 | 0 |
| C | 0 | 128 | 0 |
| D | 0 | 128 | 0 |
| Mode M9 | |||
|---|---|---|---|
| Quadrant | BADHDUFLAG | Total packets | Discarded packets |
| A | 0 | 10 | 0 |
| B | 0 | 10 | 0 |
| C | 0 | 10 | 0 |
| D | 0 | 10 | 0 |
| Mode M0 | |||
|---|---|---|---|
| Quadrant | BADHDUFLAG | Total packets | Discarded packets |
| A | 0 | 20317 | 1 |
| B | 0 | 28185 | 1 |
| C | 0 | 12811 | 2 |
| D | 0 | 14352 | 1 |
| Quadrant | Total seconds | Saturated seconds | Saturation percentage |
|---|---|---|---|
| A | 6276 | 103 | 1.641173% |
| B | 6276 | 1485 | 23.661568% |
| C | 6276 | 14 | 0.223072% |
| D | 6276 | 65 | 1.035692% |
Noise dominated data is calculated using 1-second bins in cleaned event files. If a bin has >2000 counts, and if more than 50% of those come from <1% of pixels, then it is considered to be noise-dominated and hence unusable.
| Quadrant | # 1 sec bins | Bins with >0 counts | Bins with >2000 counts | High rate bins dominated by noise | Noise dominated (total time) | Noise dominated (detector-on time) | Marked lightcurve |
|---|---|---|---|---|---|---|---|
| A | 7336 | 6277 | 17 | 17 | 0.23% | 0.27% | 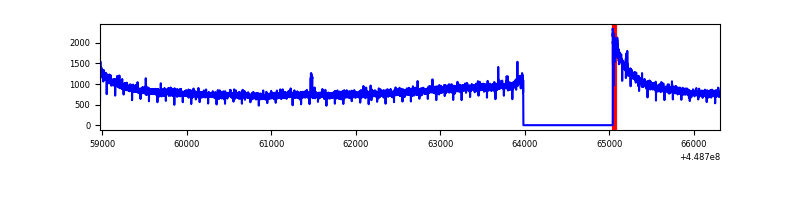 |
| B | 7336 | 6276 | 981 | 981 | 13.37% | 15.63% | 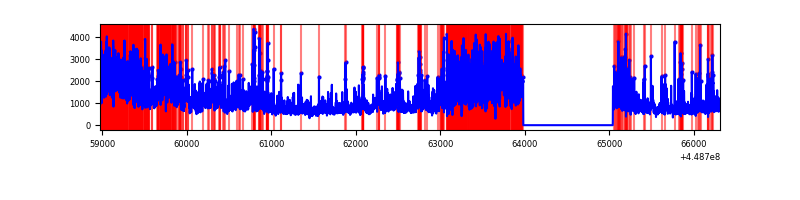 |
| C | 7336 | 6277 | 1 | 1 | 0.01% | 0.02% | 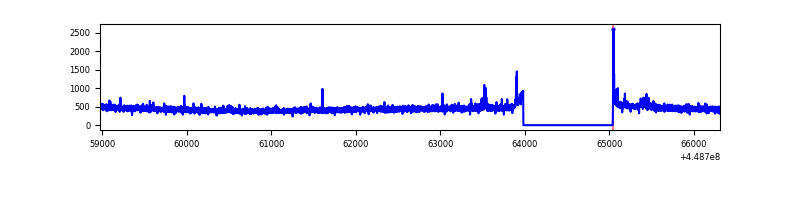 |
| D | 7336 | 6277 | 42 | 42 | 0.57% | 0.67% | 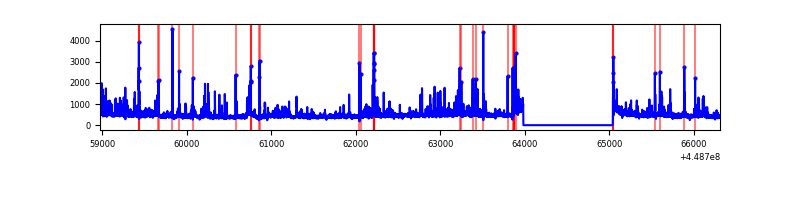 |
Top three noisy pixels from each quadrant. If the there are fewer than three noisy pixels in the level2.evt file, extra rows are filled as -1
| Pixel properties | Quadrant properties | ||||||
|---|---|---|---|---|---|---|---|
| Quadrant | DetID | PixID | Counts | Sigma | Mean | Median | Sigma |
| A | 10 | 83 | 2626260 | 18095.99 | 698 | 683 | 145.1 |
| A | 0 | 243 | 12752 | 83.18 | 698 | 683 | 145.1 |
| A | 13 | 254 | 10562 | 68.09 | 698 | 683 | 145.1 |
| B | 3 | 112 | 4974961 | 39671.87 | 639 | 619 | 125.4 |
| B | 4 | 171 | 313400 | 2494.52 | 639 | 619 | 125.4 |
| B | 0 | 183 | 39760 | 312.16 | 639 | 619 | 125.4 |
| C | 12 | 2 | 26113 | 153.9 | 702 | 706 | 165.1 |
| C | 9 | 237 | 12723 | 72.79 | 702 | 706 | 165.1 |
| C | 12 | 249 | 10050 | 56.6 | 702 | 706 | 165.1 |
| D | 1 | 52 | 217661 | 1230.15 | 689 | 667 | 176.4 |
| D | 2 | 249 | 90668 | 510.22 | 689 | 667 | 176.4 |
| D | 12 | 2 | 76454 | 429.64 | 689 | 667 | 176.4 |
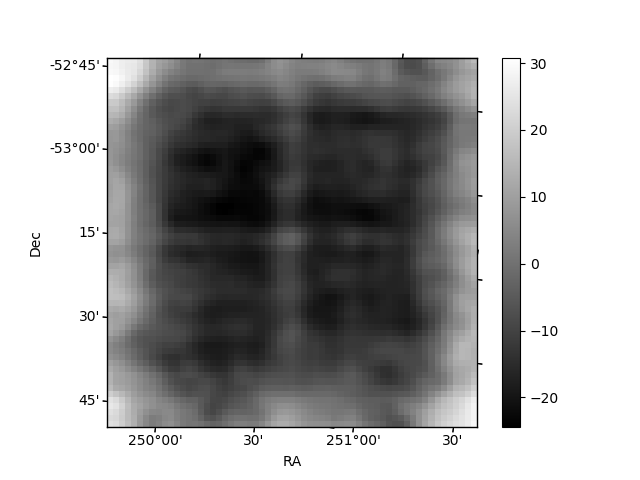
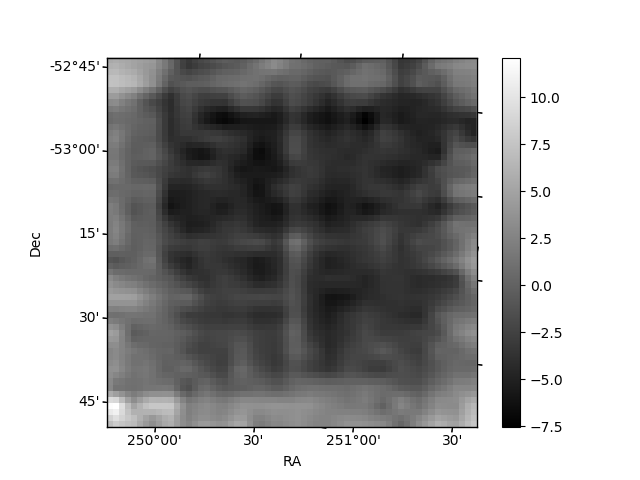
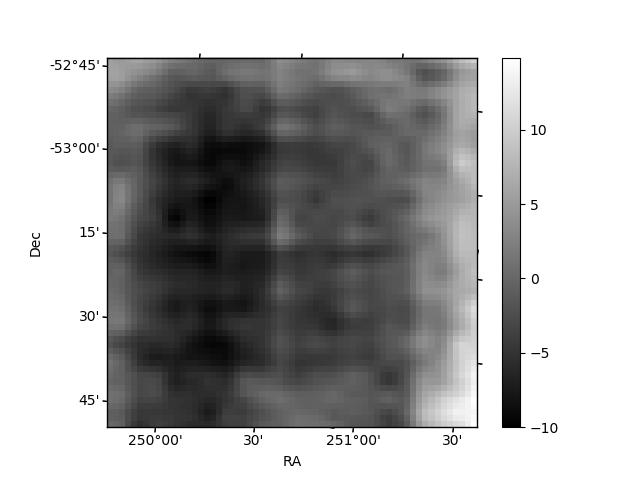
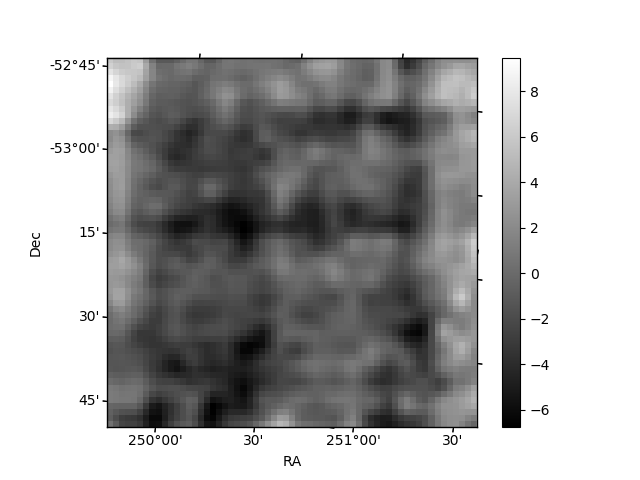
Histogram calculated using DETX and DETY for each event in the final _common_clean file
| Quadrant A | 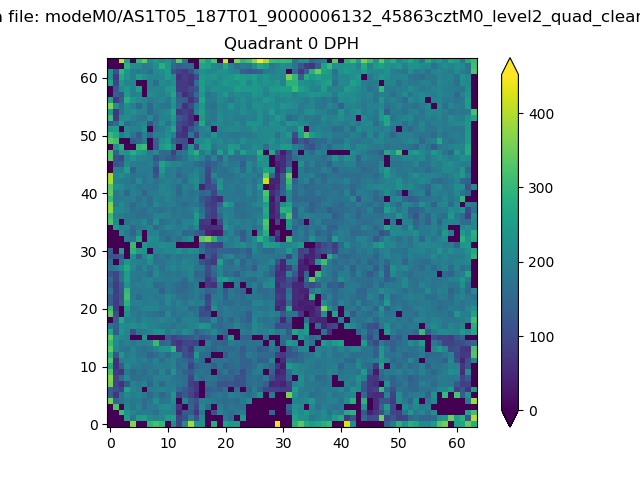 |
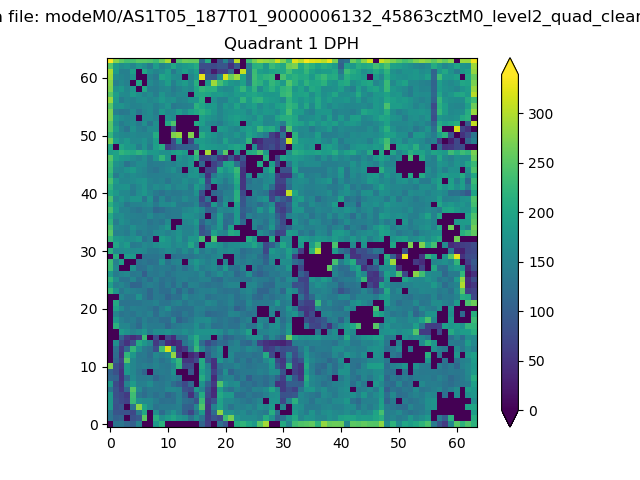 |
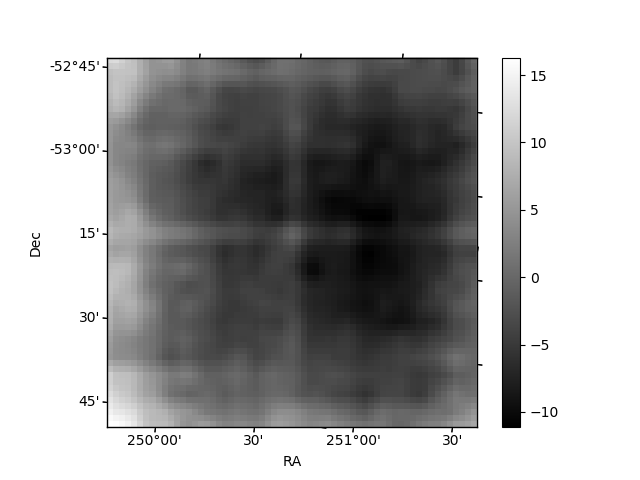
Quadrant B |
|---|---|---|---|
| Quadrant D | 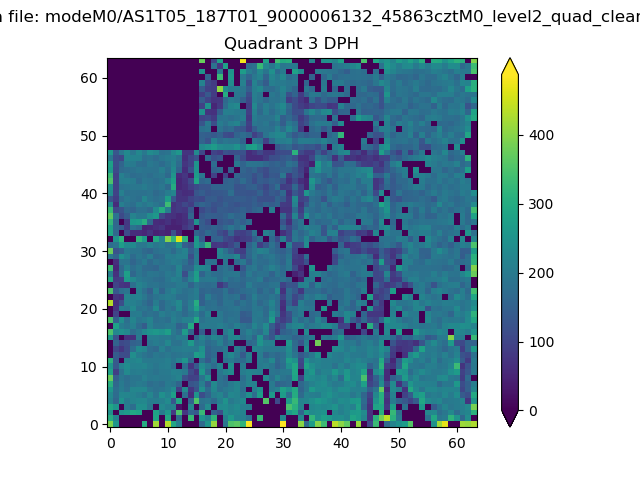 |
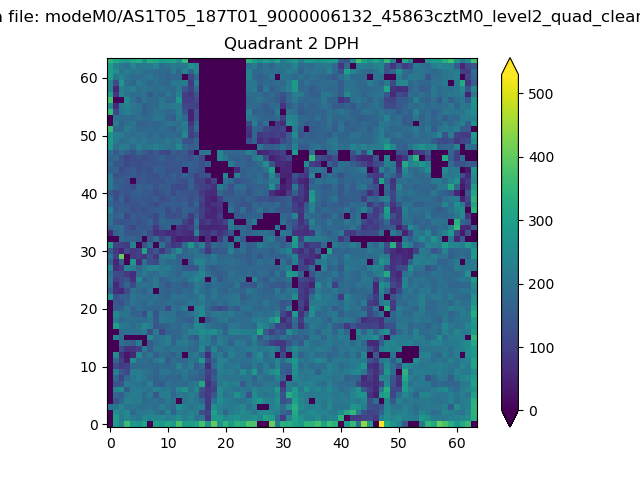 |
Quadrant C |
| Plot type | Count rate plots | Images |
|---|---|---|
| Comparison with Poisson distribution Blue bars denote a histogram of data divided into 1 sec bins. Red curve is a Poisson curve with rate = median count rate of data. |
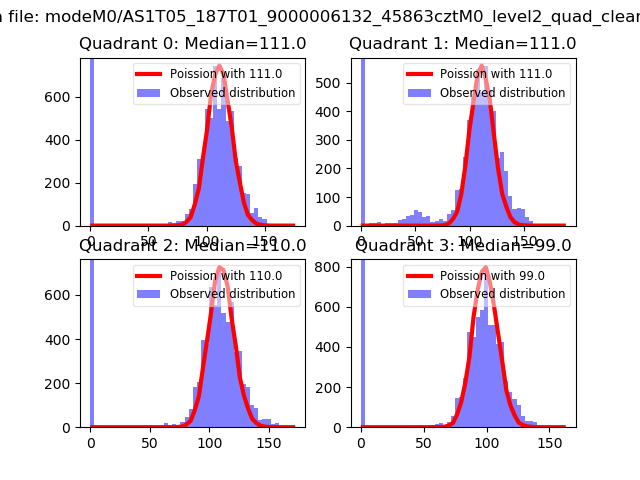 |
 |
| Quadrant-wise count rates Data is divided into 100 sec bins |
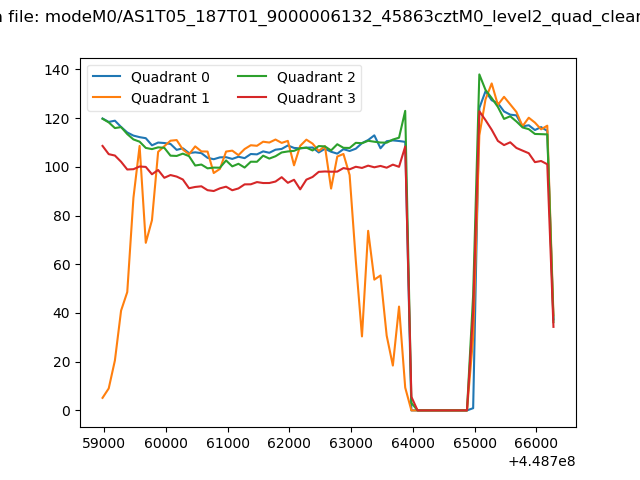 |
|
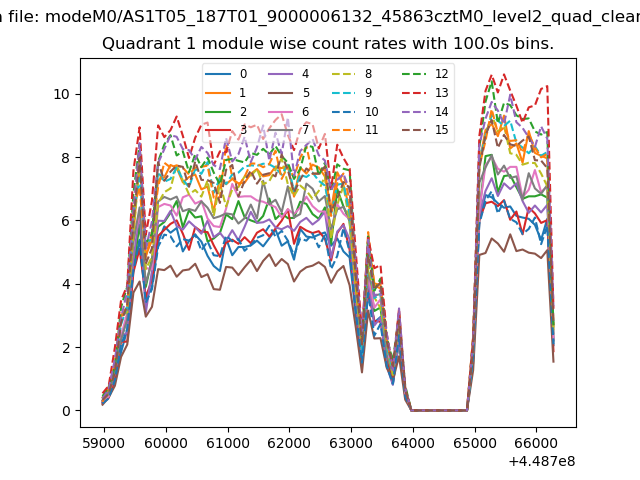
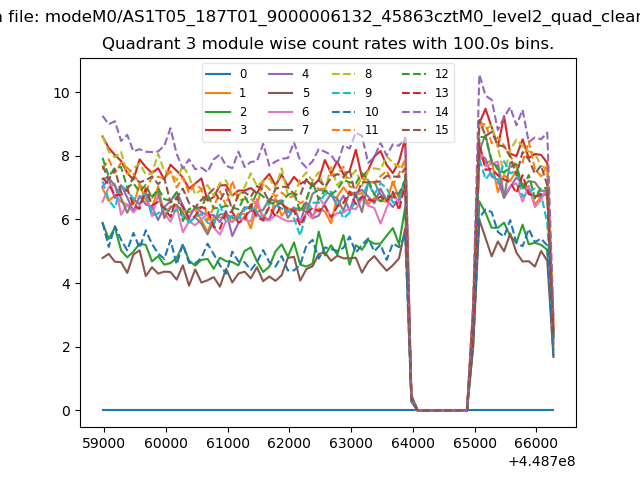
| Module-wise count rates for Quadrant A Data is divided into 100 sec bins |
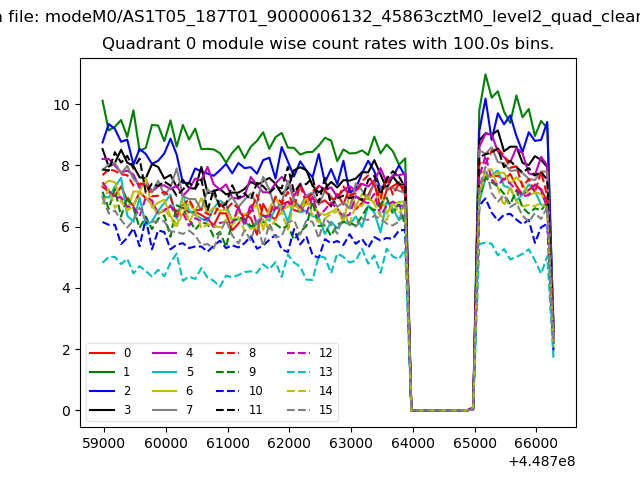 |
 |
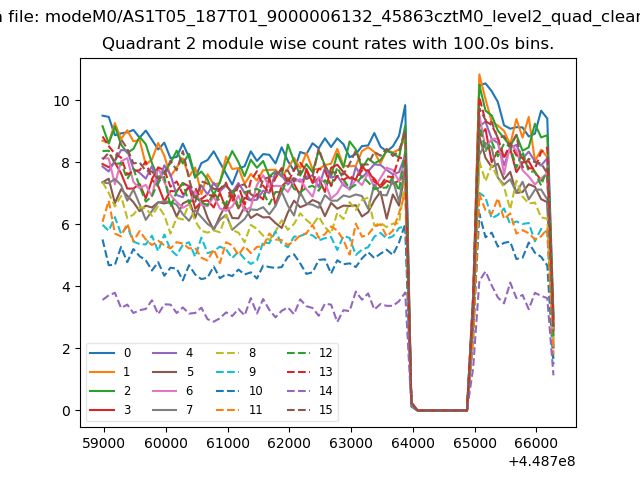
| Module-wise count rates for Quadrant B Data is divided into 100 sec bins |
 |
 |
| Module-wise count rates for Quadrant C Data is divided into 100 sec bins |
 |
 |
| Module-wise count rates for Quadrant D Data is divided into 100 sec bins |
 |
 |
| Parameter | Plot |
|---|---|
| CZT HV Monitor | 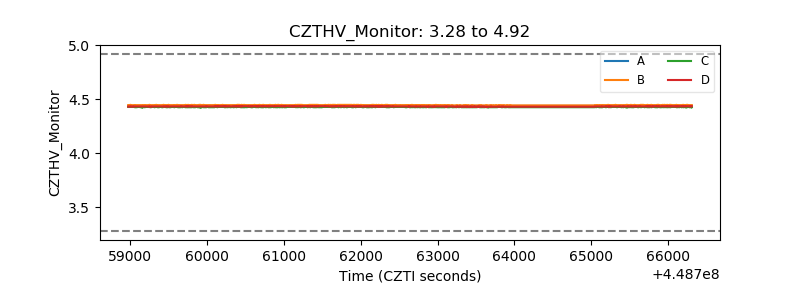 |
| D_VDD | 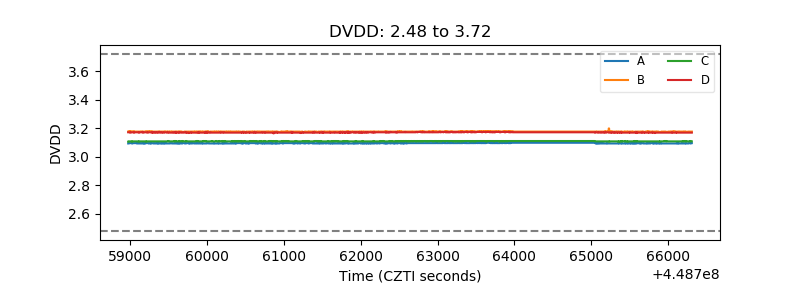 |
| Temperature 1 | 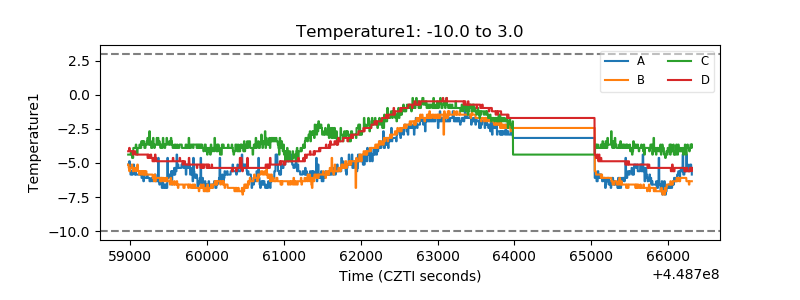 |
| Veto HV Monitor | 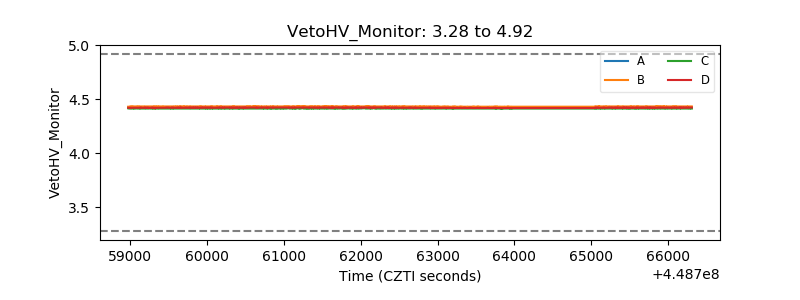 |
| Veto LLD | 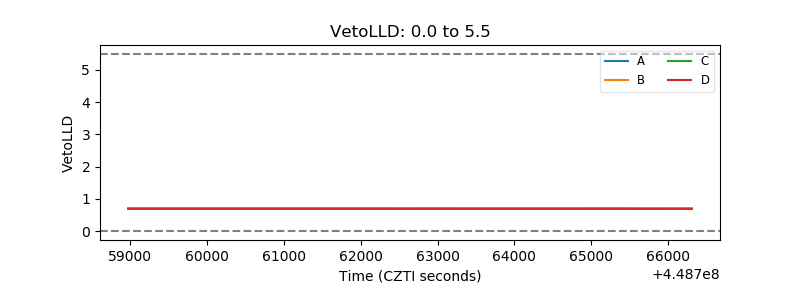 |
| Alpha Counter | 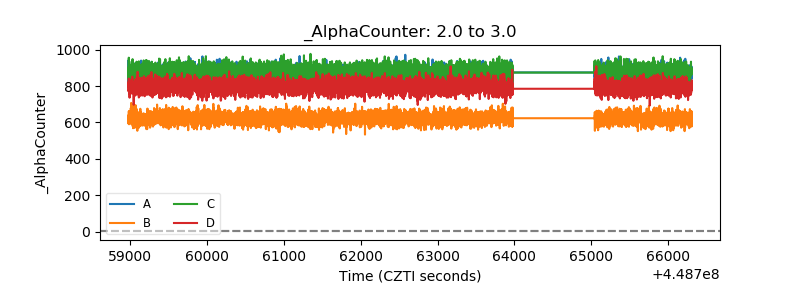 |
| _CPM_Rate | 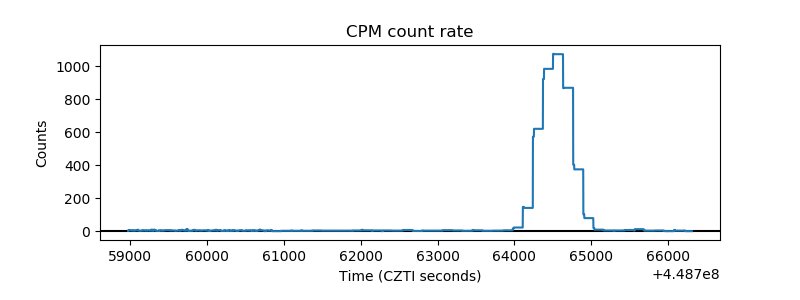 |
| CZT Counter | 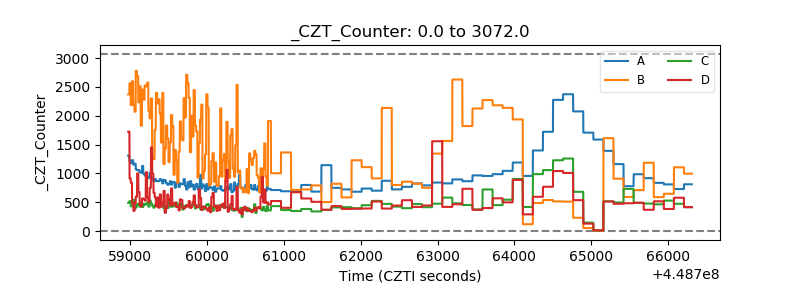 |
| +2.5 Volts monitor | 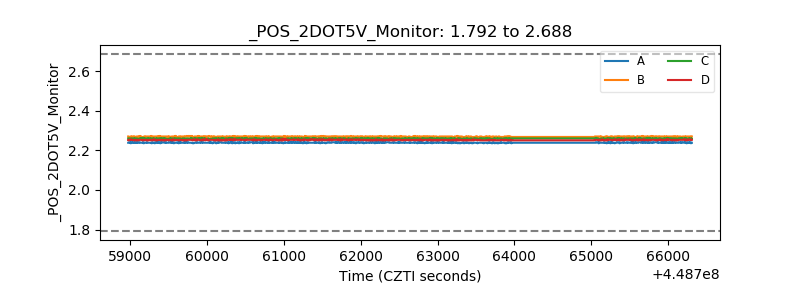 |
| +5 Volts monitor | 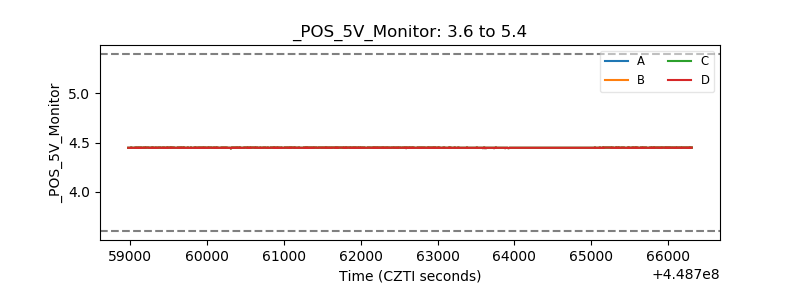 |
| _ROLL_ROT | 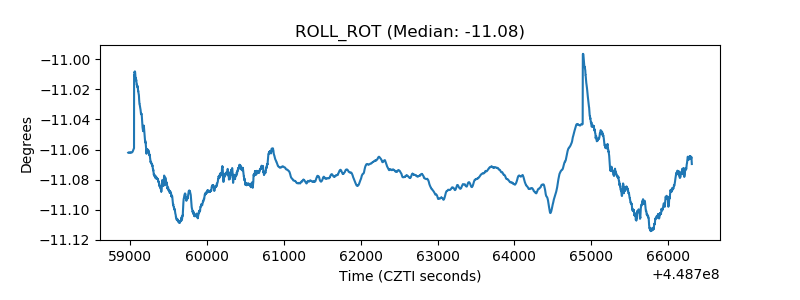 |
| _Roll_DEC | 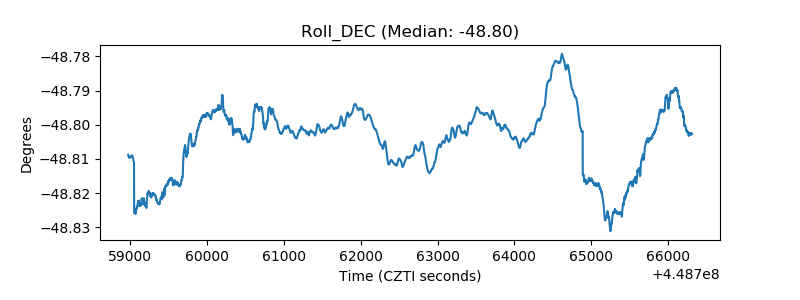 |
| _Roll_RA | 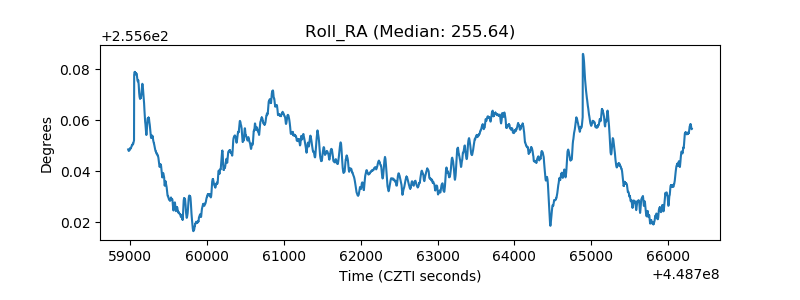 |
| Veto Counter | 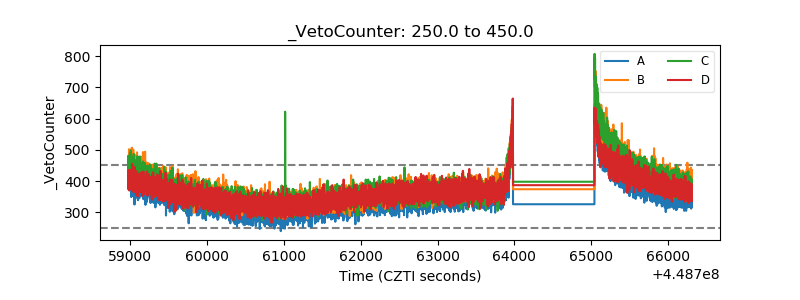 |