| Param | Original file | Final file |
|---|---|---|
| Filename | modeM0/AS1T05_187T01_9000006132_45864cztM0_level2.fits | modeM0/AS1T05_187T01_9000006132_45864cztM0_level2_quad_clean.evt |
| Size (bytes) | 240,802,560 | 52,297,920 |
| Size | 229.6 MB | 49.9 MB |
| Events in quadrant A | 2,637,986 | 349,153 |
| Events in quadrant B | 3,136,003 | 345,506 |
| Events in quadrant C | 1,376,107 | 350,021 |
| Events in quadrant D | 1,520,507 | 317,627 |
| Mode SS | |||
|---|---|---|---|
| Quadrant | BADHDUFLAG | Total packets | Discarded packets |
| A | 0 | 66 | 0 |
| B | 0 | 66 | 0 |
| C | 0 | 66 | 0 |
| D | 0 | 66 | 0 |
| Mode M9 | |||
|---|---|---|---|
| Quadrant | BADHDUFLAG | Total packets | Discarded packets |
| A | 0 | 10 | 0 |
| B | 0 | 10 | 0 |
| C | 0 | 10 | 0 |
| D | 0 | 10 | 0 |
| Mode M0 | |||
|---|---|---|---|
| Quadrant | BADHDUFLAG | Total packets | Discarded packets |
| A | 0 | 10145 | 1 |
| B | 0 | 11584 | 1 |
| C | 0 | 6387 | 1 |
| D | 0 | 6823 | 1 |
| Quadrant | Total seconds | Saturated seconds | Saturation percentage |
|---|---|---|---|
| A | 3107 | 79 | 2.542646% |
| B | 3108 | 295 | 9.491634% |
| C | 3108 | 13 | 0.418275% |
| D | 3108 | 30 | 0.965251% |
Noise dominated data is calculated using 1-second bins in cleaned event files. If a bin has >2000 counts, and if more than 50% of those come from <1% of pixels, then it is considered to be noise-dominated and hence unusable.
| Quadrant | # 1 sec bins | Bins with >0 counts | Bins with >2000 counts | High rate bins dominated by noise | Noise dominated (total time) | Noise dominated (detector-on time) | Marked lightcurve |
|---|---|---|---|---|---|---|---|
| A | 4167 | 3108 | 17 | 17 | 0.41% | 0.55% | 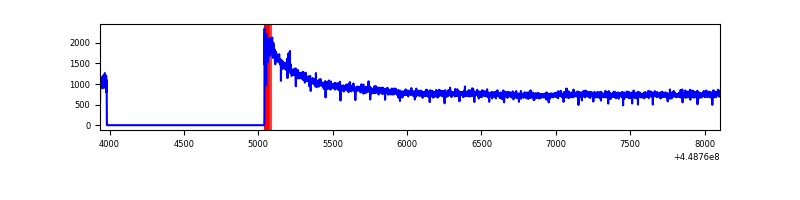 |
| B | 4168 | 3108 | 191 | 191 | 4.58% | 6.15% |  |
| C | 4168 | 3109 | 1 | 1 | 0.02% | 0.03% | 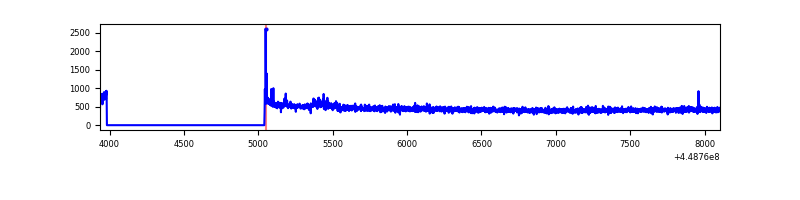 |
| D | 4168 | 3109 | 18 | 18 | 0.43% | 0.58% | 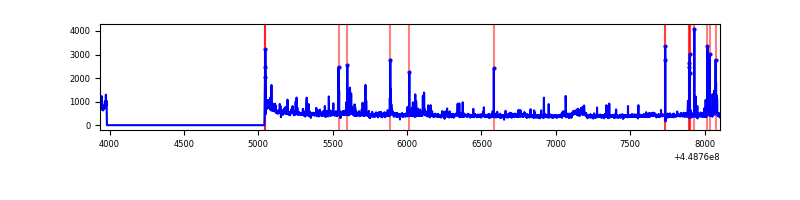 |
Top three noisy pixels from each quadrant. If the there are fewer than three noisy pixels in the level2.evt file, extra rows are filled as -1
| Pixel properties | Quadrant properties | ||||||
|---|---|---|---|---|---|---|---|
| Quadrant | DetID | PixID | Counts | Sigma | Mean | Median | Sigma |
| A | 10 | 83 | 1328163 | 18539.64 | 338 | 332 | 71.6 |
| A | 13 | 254 | 5037 | 65.69 | 338 | 332 | 71.6 |
| A | 3 | 137 | 3671 | 46.62 | 338 | 332 | 71.6 |
| B | 3 | 112 | 1594642 | 24058.79 | 333 | 322 | 66.3 |
| B | 4 | 171 | 153439 | 2310.58 | 333 | 322 | 66.3 |
| B | 5 | 172 | 39929 | 597.68 | 333 | 322 | 66.3 |
| C | 12 | 2 | 23345 | 281.65 | 346 | 348 | 81.7 |
| C | 13 | 61 | 2261 | 23.43 | 346 | 348 | 81.7 |
| C | 3 | 233 | 2260 | 23.42 | 346 | 348 | 81.7 |
| D | 2 | 249 | 66891 | 767.19 | 338 | 328 | 86.8 |
| D | 1 | 52 | 50375 | 576.83 | 338 | 328 | 86.8 |
| D | 6 | 143 | 43007 | 491.91 | 338 | 328 | 86.8 |
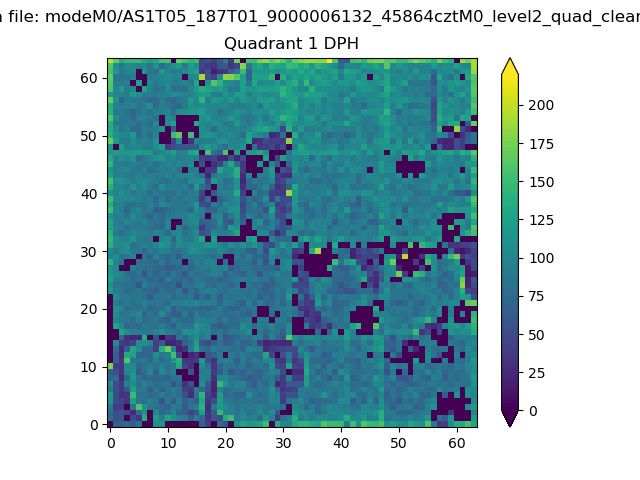
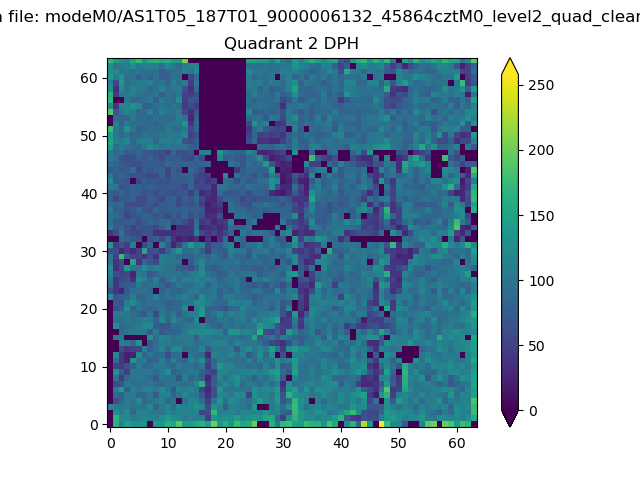
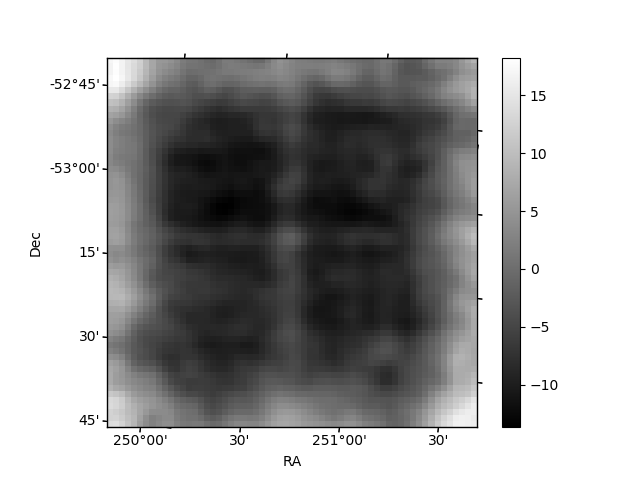
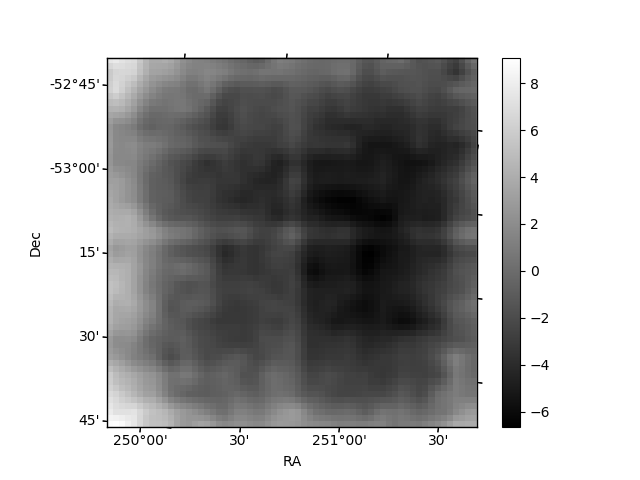
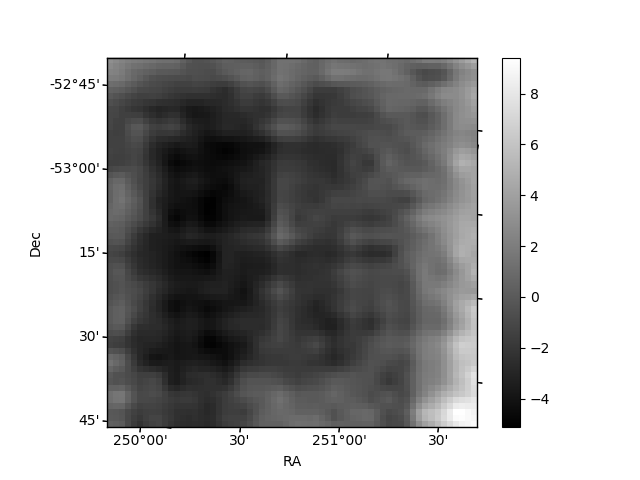
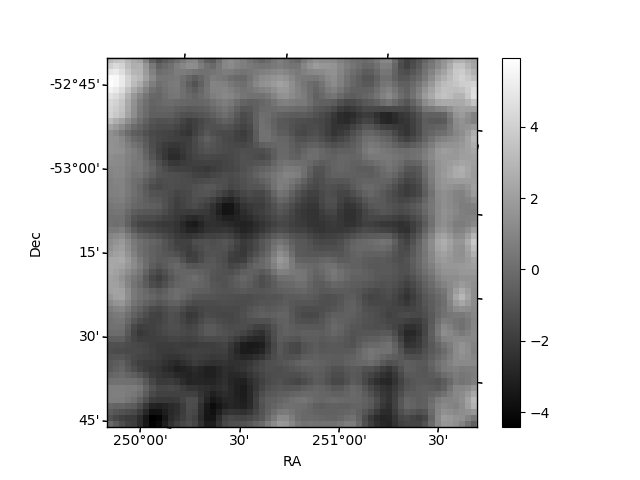
Histogram calculated using DETX and DETY for each event in the final _common_clean file
| Quadrant A | 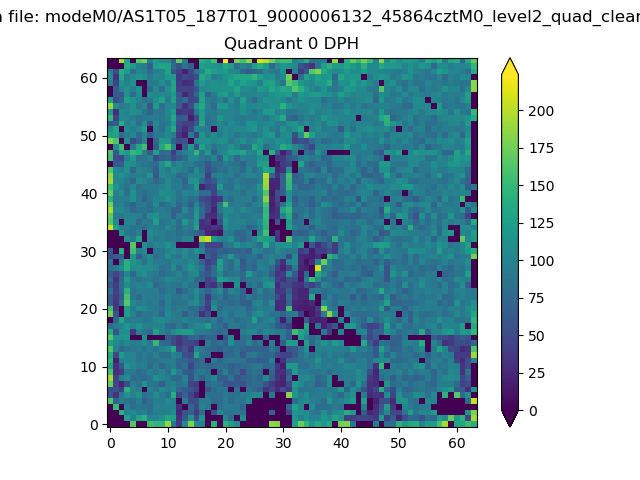 |
 |
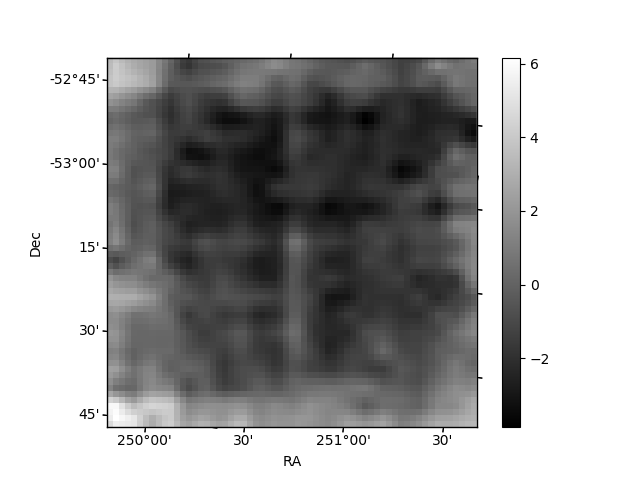
Quadrant B |
|---|---|---|---|
| Quadrant D | 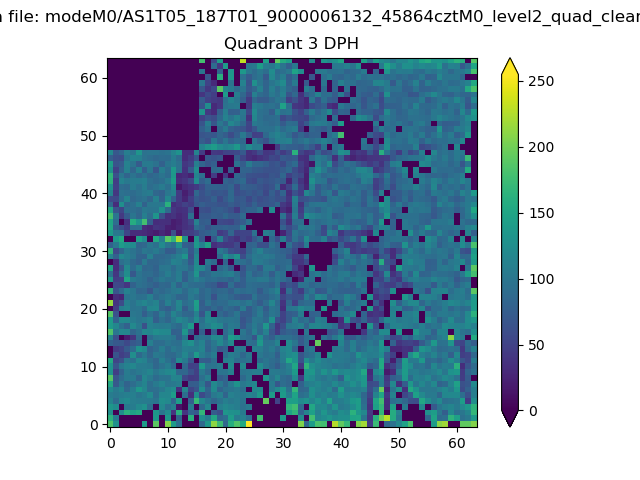 |
 |
Quadrant C |
| Plot type | Count rate plots | Images |
|---|---|---|
| Comparison with Poisson distribution Blue bars denote a histogram of data divided into 1 sec bins. Red curve is a Poisson curve with rate = median count rate of data. |
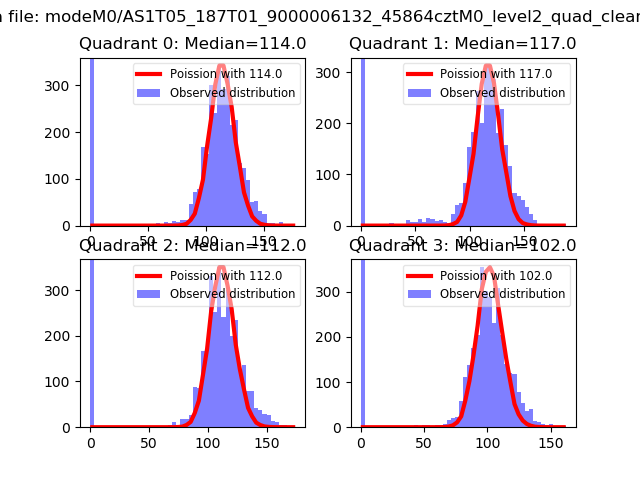 |
 |
| Quadrant-wise count rates Data is divided into 100 sec bins |
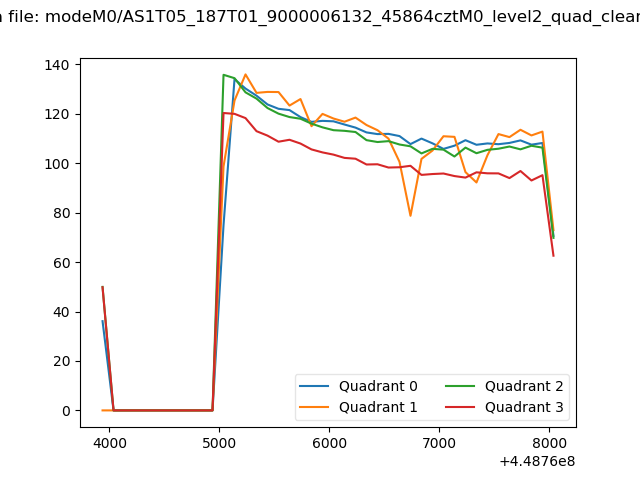 |
|
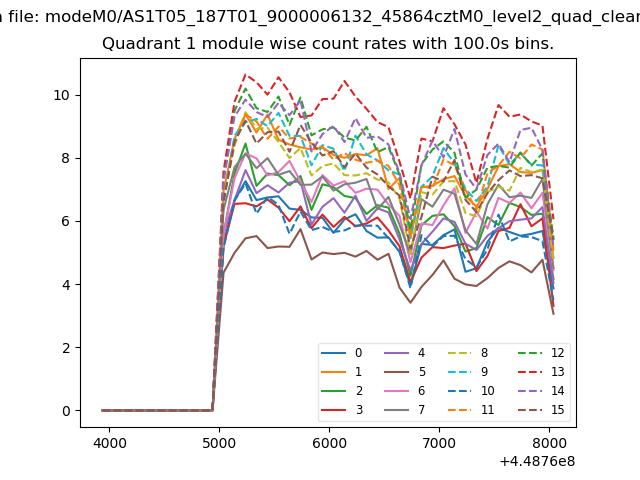
| Module-wise count rates for Quadrant A Data is divided into 100 sec bins |
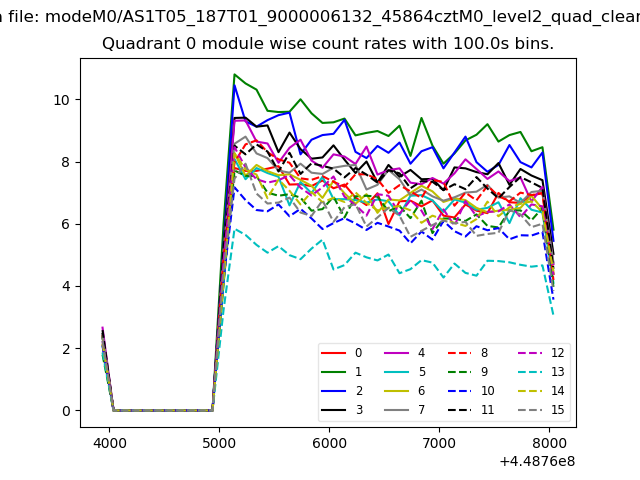 |
 |
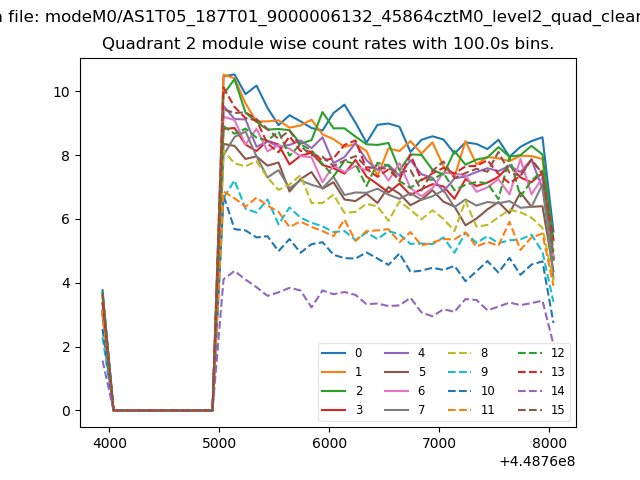
| Module-wise count rates for Quadrant B Data is divided into 100 sec bins |
 |
 |
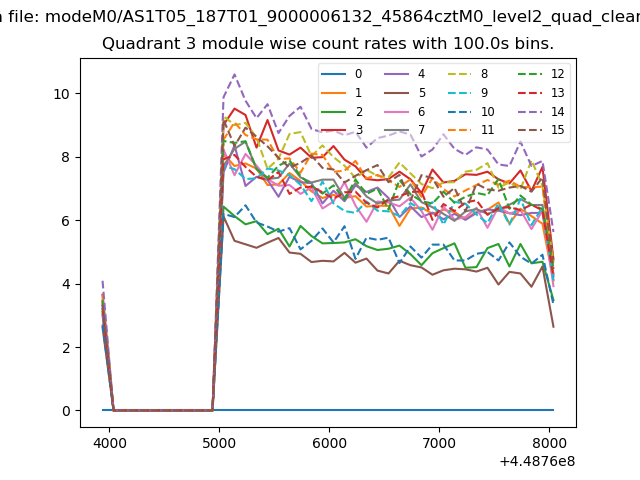
| Module-wise count rates for Quadrant C Data is divided into 100 sec bins |
 |
 |
| Module-wise count rates for Quadrant D Data is divided into 100 sec bins |
 |
 |
| Parameter | Plot |
|---|---|
| CZT HV Monitor | 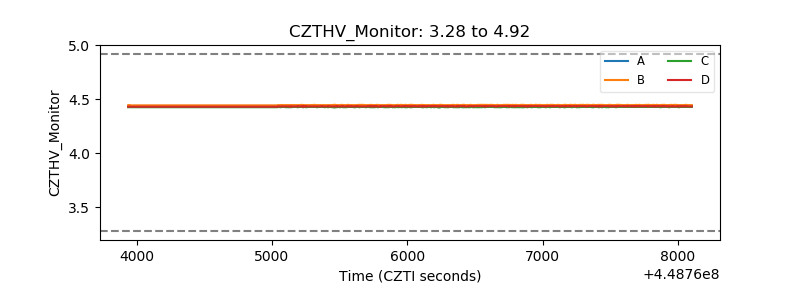 |
| D_VDD | 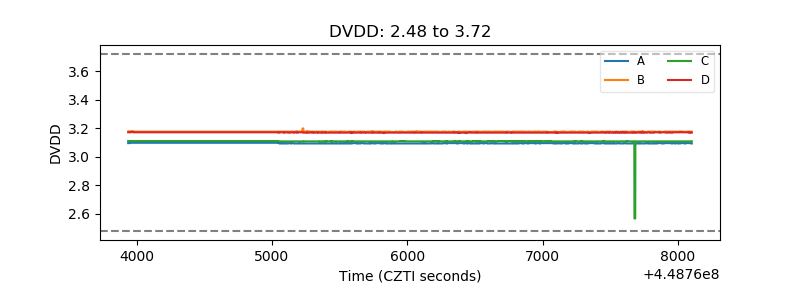 |
| Temperature 1 | 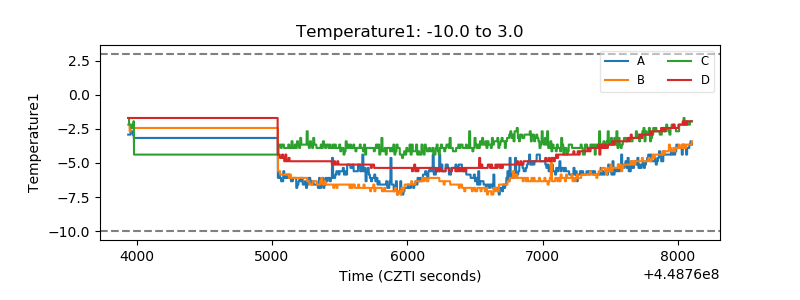 |
| Veto HV Monitor | 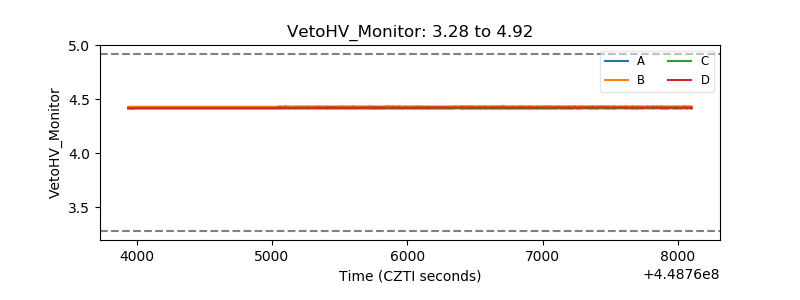 |
| Veto LLD | 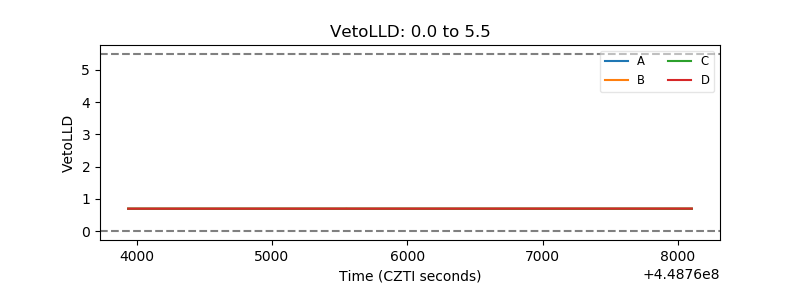 |
| Alpha Counter | 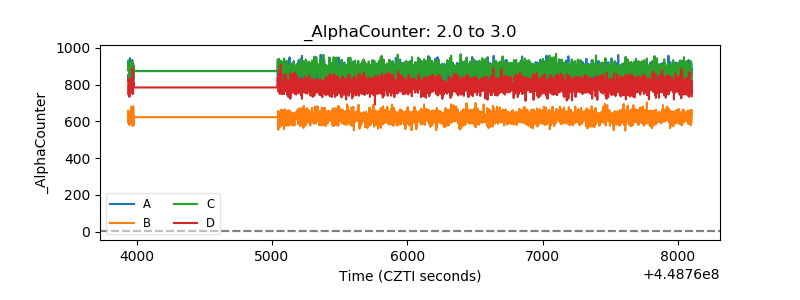 |
| _CPM_Rate | 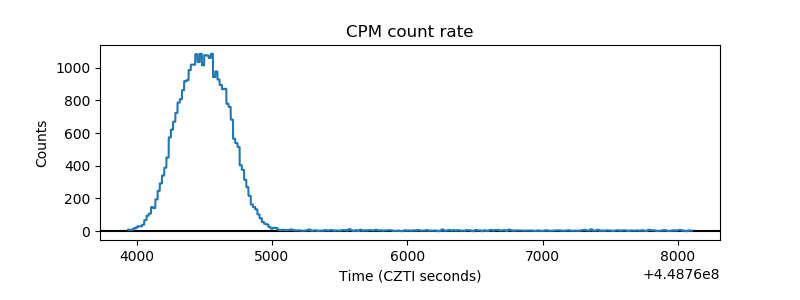 |
| CZT Counter | 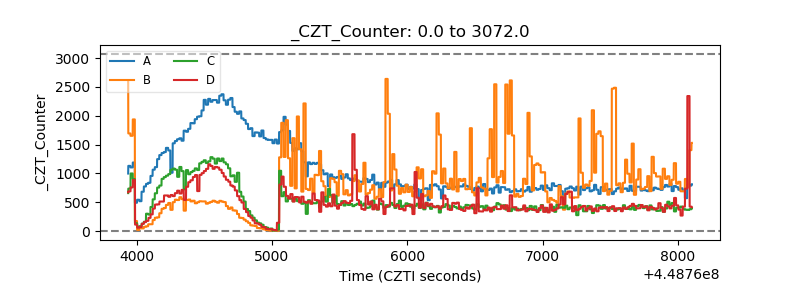 |
| +2.5 Volts monitor | 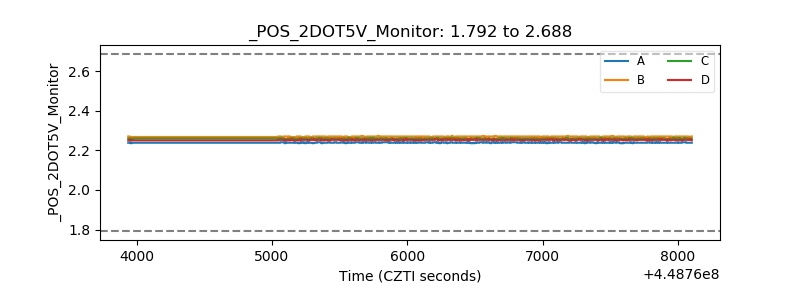 |
| +5 Volts monitor | 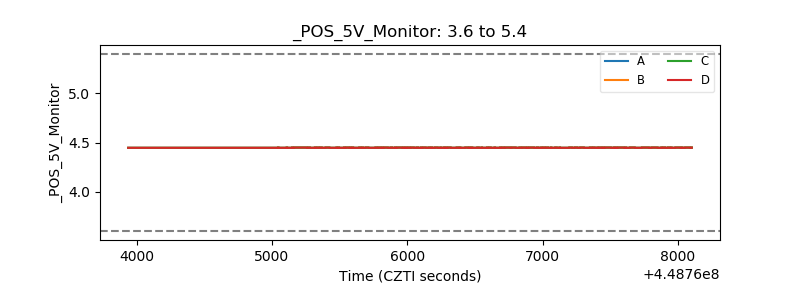 |
| _ROLL_ROT | 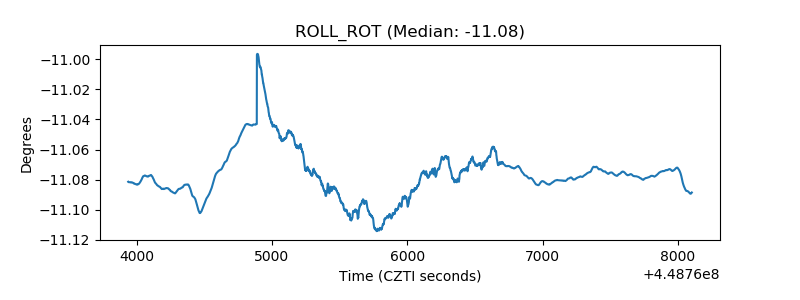 |
| _Roll_DEC | 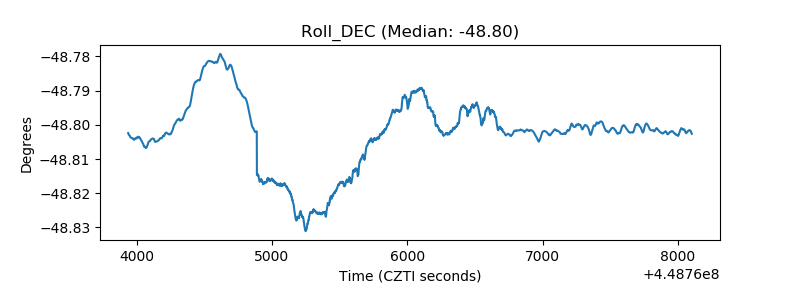 |
| _Roll_RA | 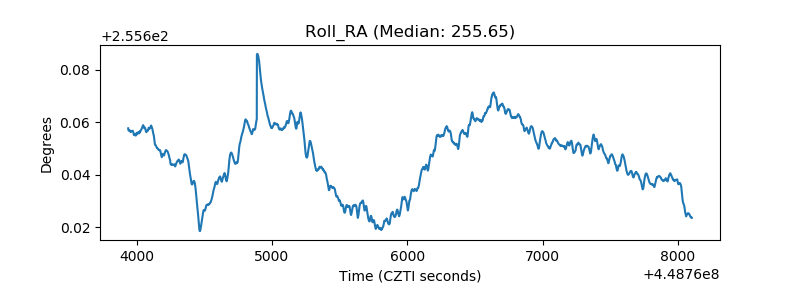 |
| Veto Counter | 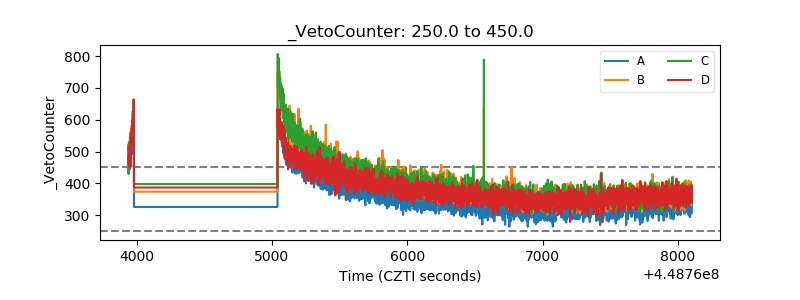 |