| Param | Original file | Final file |
|---|---|---|
| Filename | modeM0/AS1A13_034T01_9000006134_45865cztM0_level2.fits | modeM0/AS1A13_034T01_9000006134_45865cztM0_level2_quad_clean.evt |
| Size (bytes) | 550,584,000 | 108,368,640 |
| Size | 525.1 MB | 103.3 MB |
| Events in quadrant A | 5,804,997 | 737,309 |
| Events in quadrant B | 7,809,530 | 666,685 |
| Events in quadrant C | 2,980,800 | 750,350 |
| Events in quadrant D | 3,290,236 | 680,943 |
| Mode SS | |||
|---|---|---|---|
| Quadrant | BADHDUFLAG | Total packets | Discarded packets |
| A | 0 | 130 | 0 |
| B | 0 | 130 | 0 |
| C | 0 | 130 | 0 |
| D | 0 | 130 | 0 |
| Mode M0 | |||
|---|---|---|---|
| Quadrant | BADHDUFLAG | Total packets | Discarded packets |
| A | 0 | 21695 | 2 |
| B | 0 | 27725 | 2 |
| C | 0 | 13249 | 2 |
| D | 0 | 14097 | 2 |
| Mode M9 | |||
|---|---|---|---|
| Quadrant | BADHDUFLAG | Total packets | Discarded packets |
| A | 0 | 17 | 0 |
| B | 0 | 18 | 0 |
| C | 0 | 18 | 0 |
| D | 0 | 18 | 0 |
| Quadrant | Total seconds | Saturated seconds | Saturation percentage |
|---|---|---|---|
| A | 6391 | 186 | 2.910343% |
| B | 6391 | 1280 | 20.028165% |
| C | 6391 | 15 | 0.234705% |
| D | 6391 | 42 | 0.657174% |
Noise dominated data is calculated using 1-second bins in cleaned event files. If a bin has >2000 counts, and if more than 50% of those come from <1% of pixels, then it is considered to be noise-dominated and hence unusable.
| Quadrant | # 1 sec bins | Bins with >0 counts | Bins with >2000 counts | High rate bins dominated by noise | Noise dominated (total time) | Noise dominated (detector-on time) | Marked lightcurve |
|---|---|---|---|---|---|---|---|
| A | 7611 | 6392 | 50 | 50 | 0.66% | 0.78% | 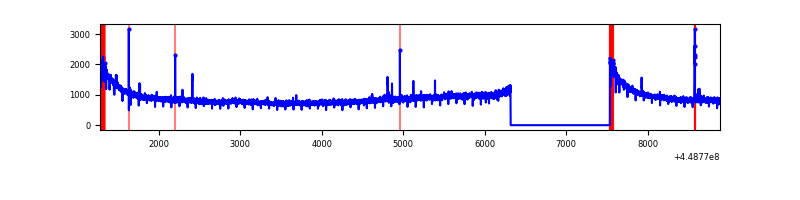 |
| B | 7611 | 6392 | 750 | 750 | 9.85% | 11.73% | 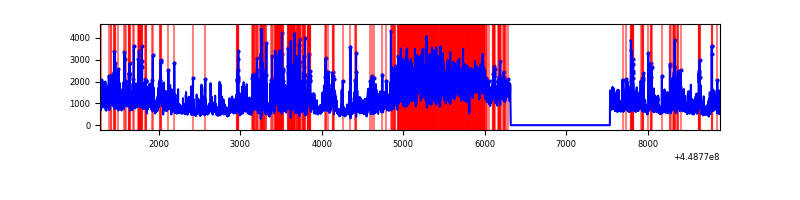 |
| C | 7611 | 6392 | 5 | 5 | 0.07% | 0.08% | 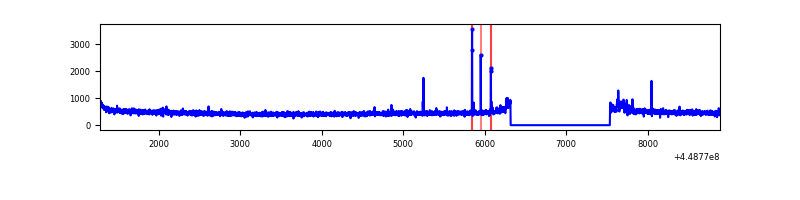 |
| D | 7611 | 6392 | 20 | 20 | 0.26% | 0.31% | 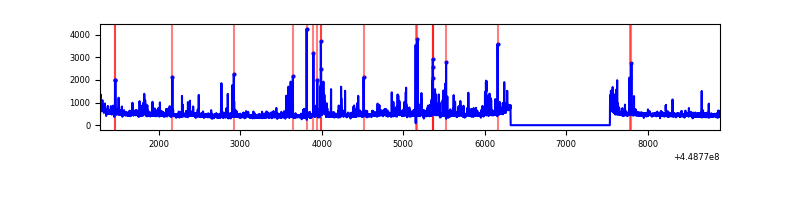 |
Top three noisy pixels from each quadrant. If the there are fewer than three noisy pixels in the level2.evt file, extra rows are filled as -1
| Pixel properties | Quadrant properties | ||||||
|---|---|---|---|---|---|---|---|
| Quadrant | DetID | PixID | Counts | Sigma | Mean | Median | Sigma |
| A | 10 | 83 | 2894730 | 18911.06 | 735 | 719 | 153.0 |
| A | 0 | 243 | 20407 | 128.65 | 735 | 719 | 153.0 |
| A | 4 | 0 | 17143 | 107.32 | 735 | 719 | 153.0 |
| B | 3 | 112 | 4616855 | 33917.67 | 705 | 684 | 136.1 |
| B | 4 | 171 | 218974 | 1603.9 | 705 | 684 | 136.1 |
| B | 0 | 183 | 51875 | 376.13 | 705 | 684 | 136.1 |
| C | 12 | 2 | 55922 | 318.88 | 744 | 748 | 173.0 |
| C | 3 | 254 | 8498 | 44.79 | 744 | 748 | 173.0 |
| C | 12 | 250 | 6382 | 32.56 | 744 | 748 | 173.0 |
| D | 1 | 52 | 165627 | 883.01 | 739 | 717 | 186.8 |
| D | 2 | 249 | 99381 | 528.29 | 739 | 717 | 186.8 |
| D | 13 | 249 | 66894 | 354.34 | 739 | 717 | 186.8 |
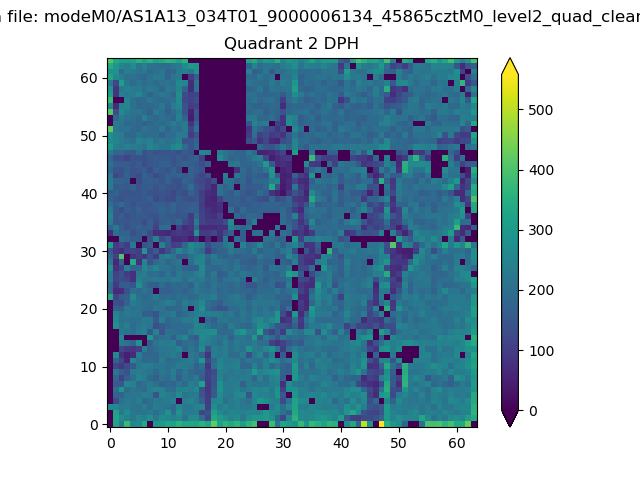
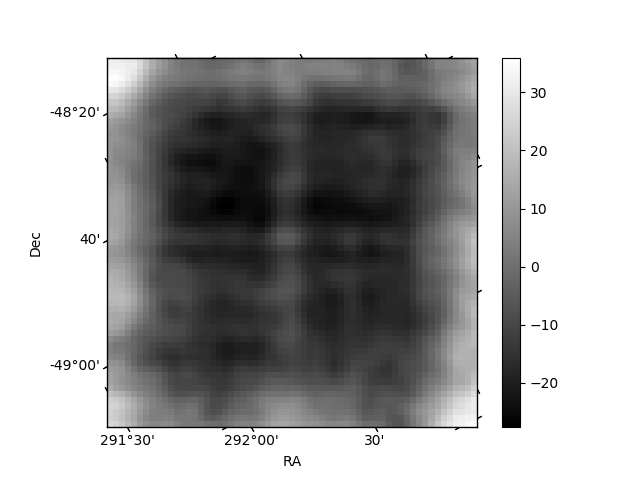
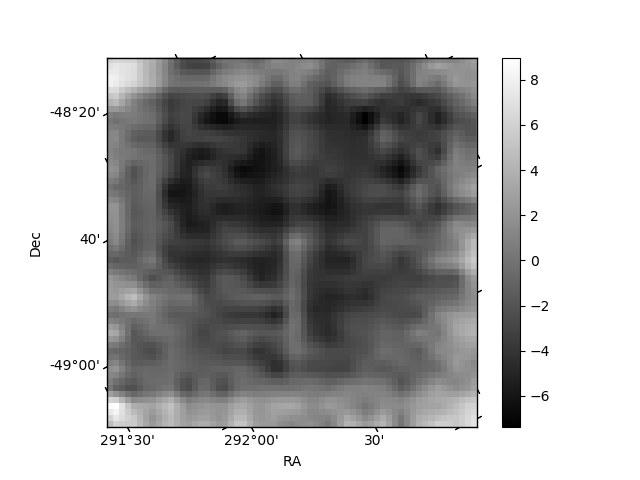
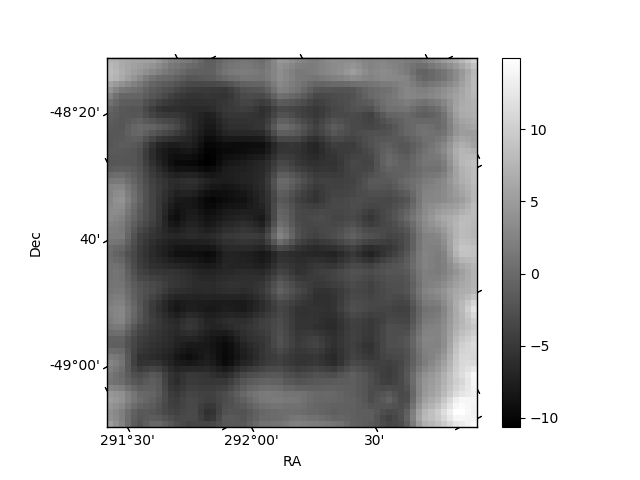
Histogram calculated using DETX and DETY for each event in the final _common_clean file
| Quadrant A | 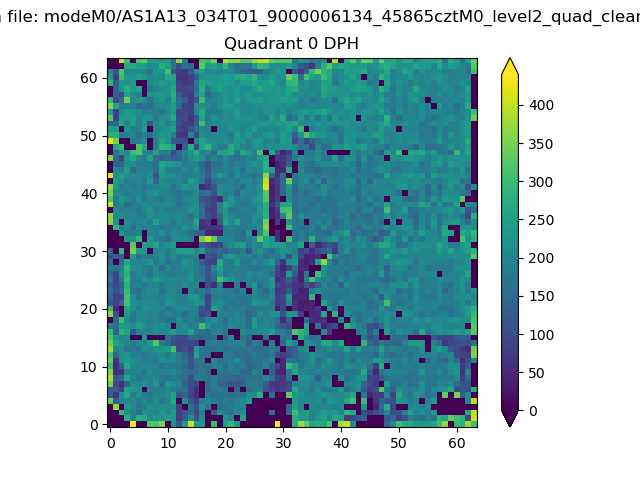 |
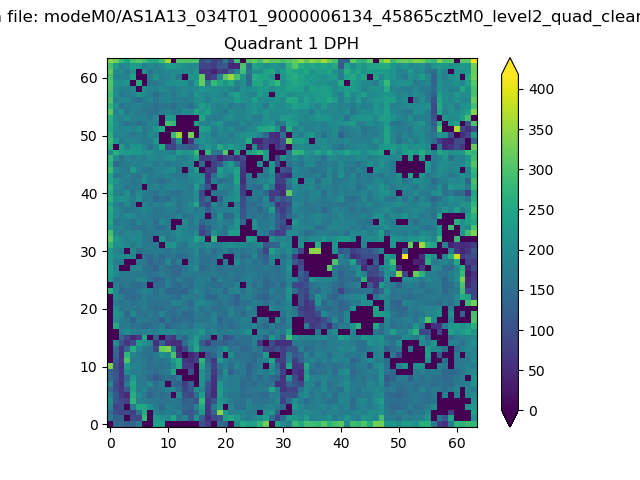 |
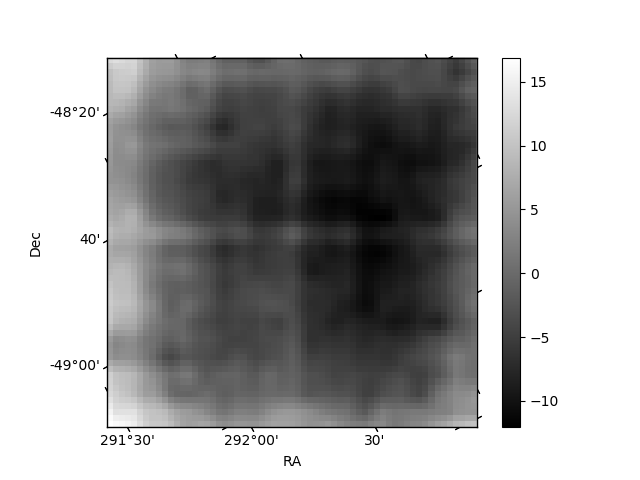
Quadrant B |
|---|---|---|---|
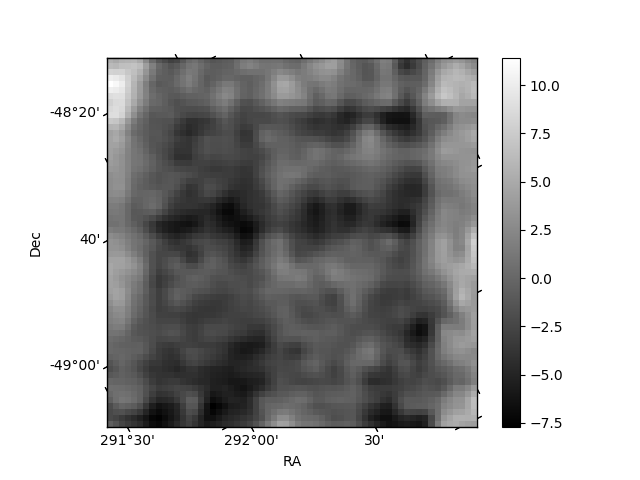
| Quadrant D | 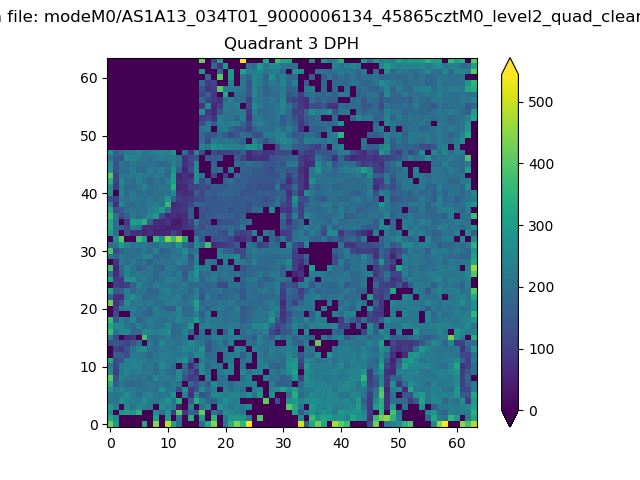 |
 |
Quadrant C |
| Plot type | Count rate plots | Images |
|---|---|---|
| Comparison with Poisson distribution Blue bars denote a histogram of data divided into 1 sec bins. Red curve is a Poisson curve with rate = median count rate of data. |
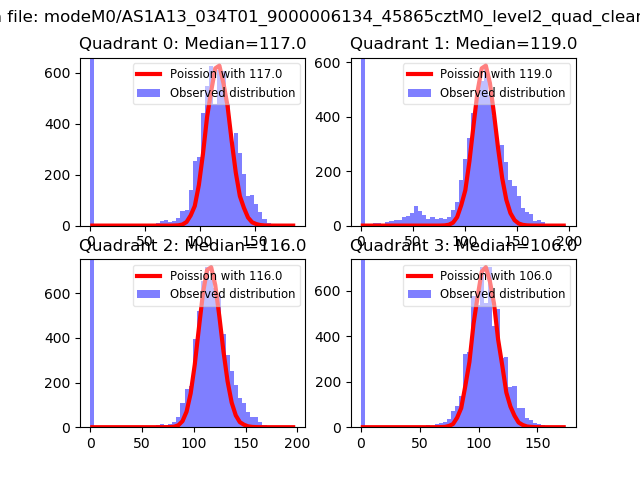 |
 |
| Quadrant-wise count rates Data is divided into 100 sec bins |
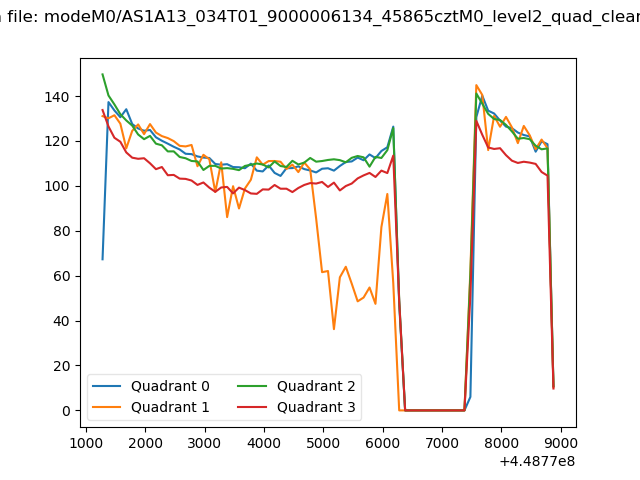 |
|
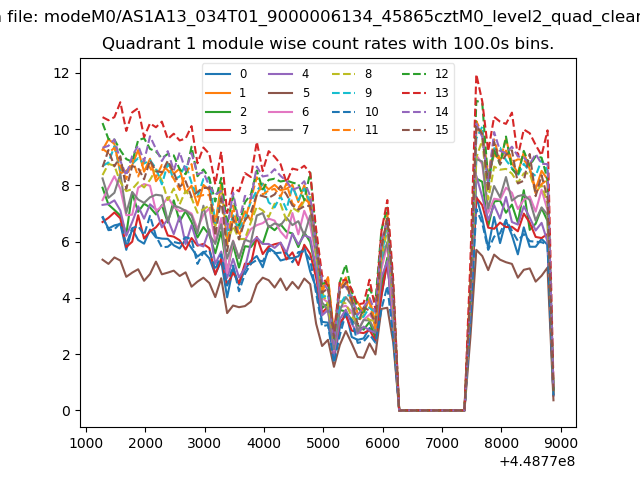
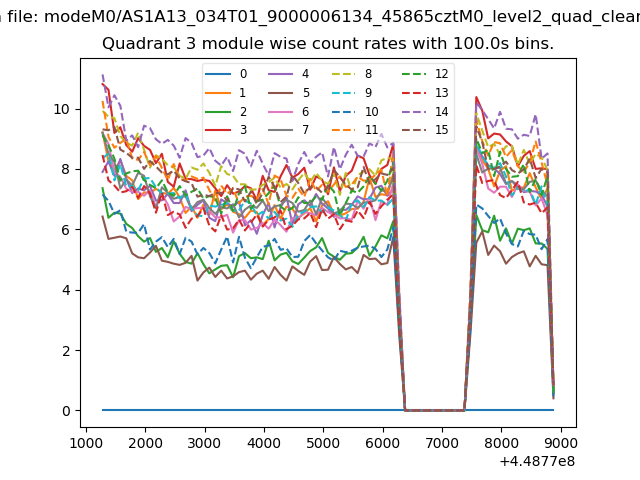
| Module-wise count rates for Quadrant A Data is divided into 100 sec bins |
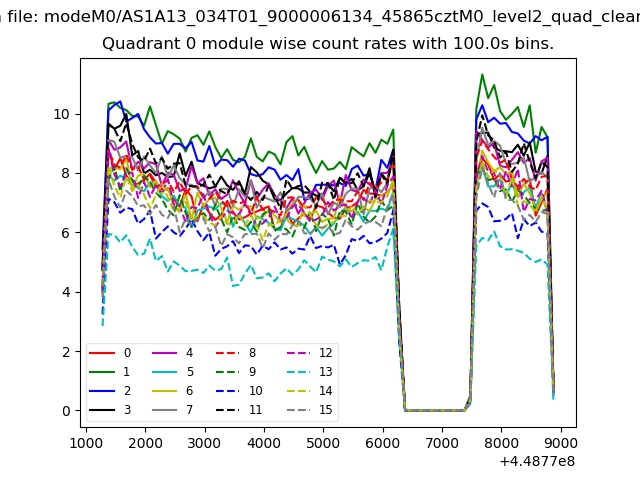 |
 |
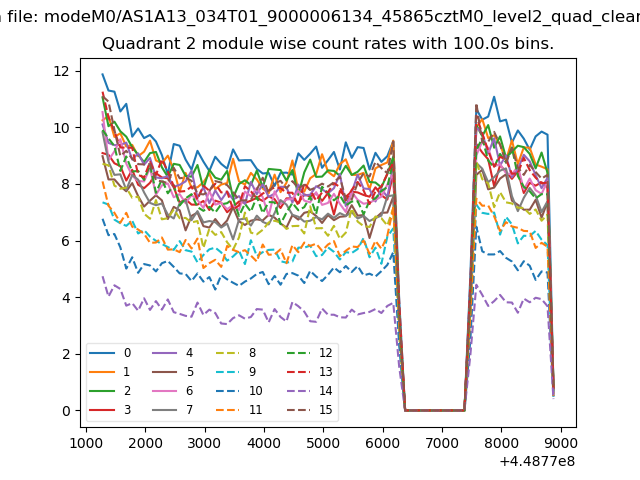
| Module-wise count rates for Quadrant B Data is divided into 100 sec bins |
 |
 |
| Module-wise count rates for Quadrant C Data is divided into 100 sec bins |
 |
 |
| Module-wise count rates for Quadrant D Data is divided into 100 sec bins |
 |
 |
| Parameter | Plot |
|---|---|
| CZT HV Monitor | 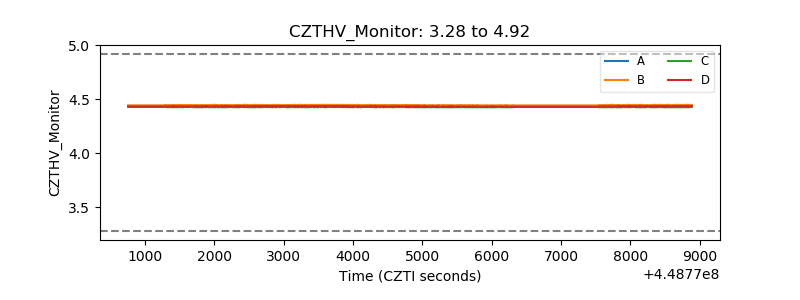 |
| D_VDD | 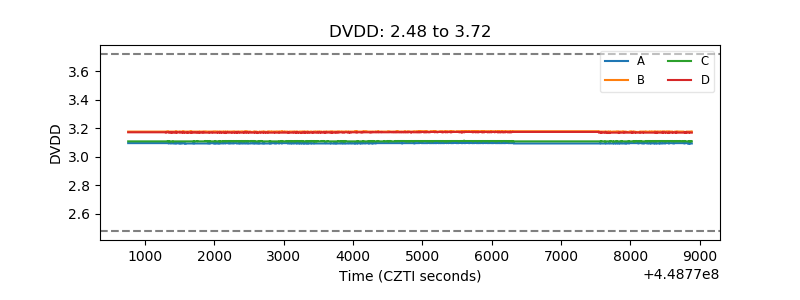 |
| Temperature 1 | 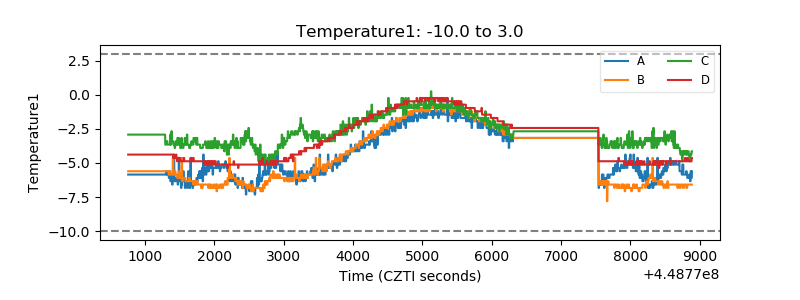 |
| Veto HV Monitor | 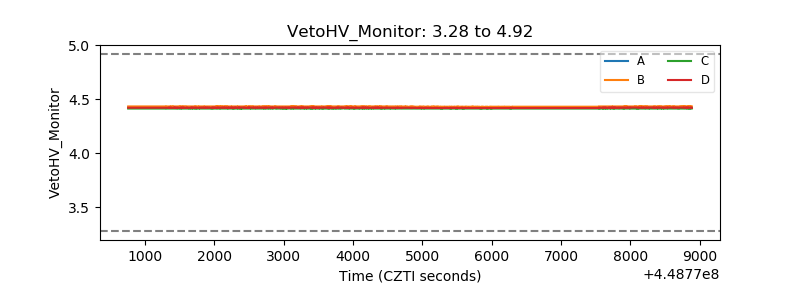 |
| Veto LLD | 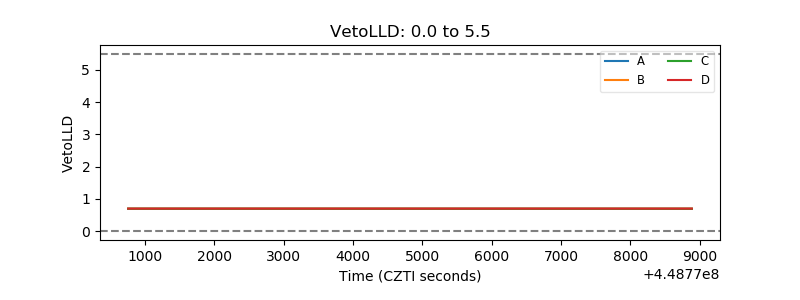 |
| Alpha Counter | 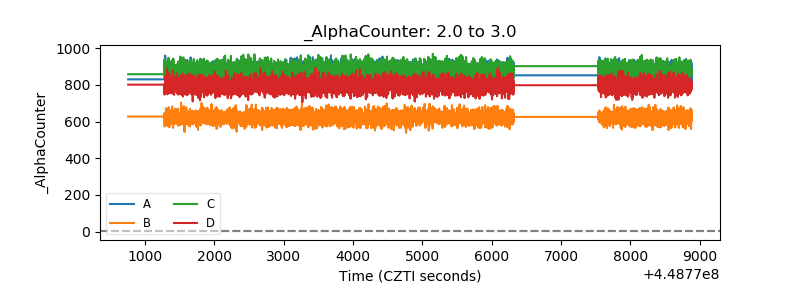 |
| _CPM_Rate |  |
| CZT Counter | 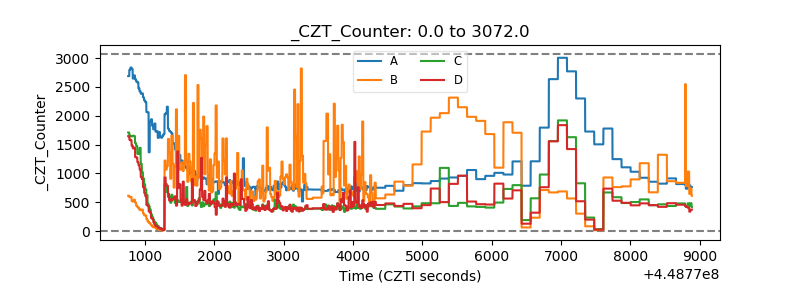 |
| +2.5 Volts monitor | 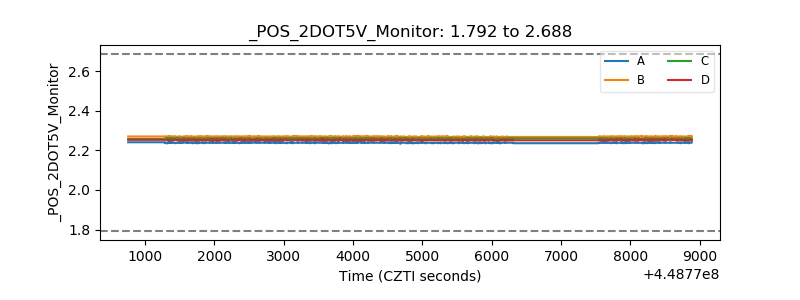 |
| +5 Volts monitor | 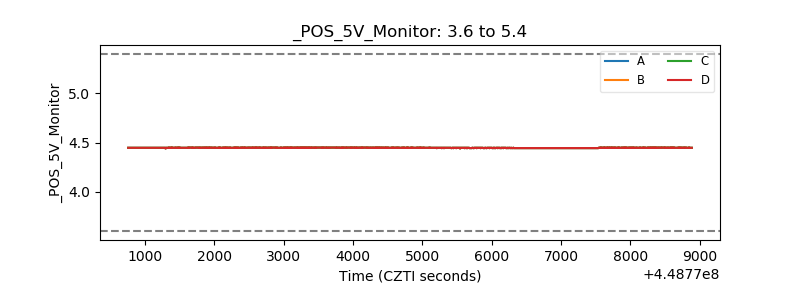 |
| _ROLL_ROT | 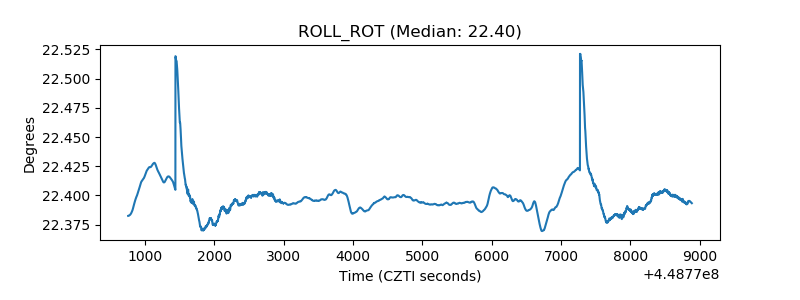 |
| _Roll_DEC | 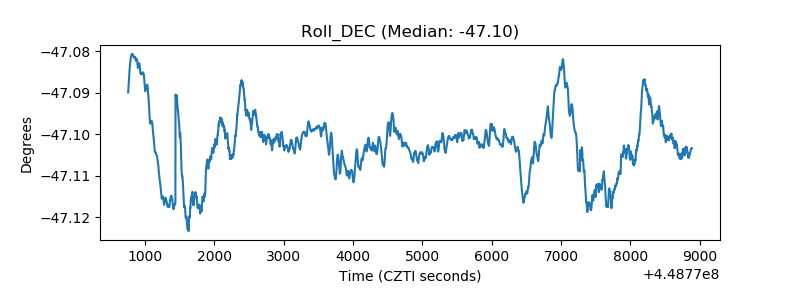 |
| _Roll_RA | 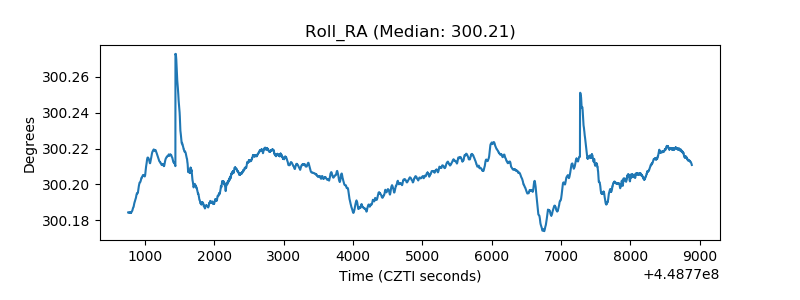 |
| Veto Counter | 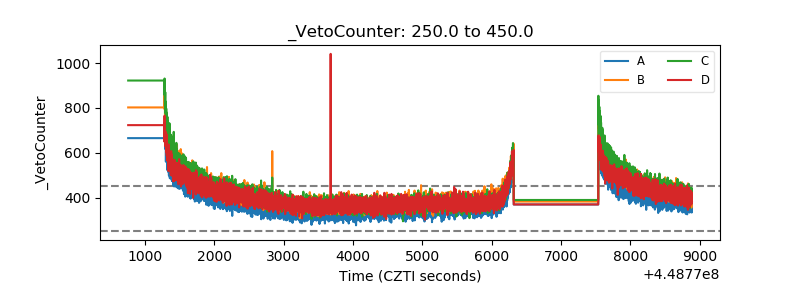 |