| Param | Original file | Final file |
|---|---|---|
| Filename | modeM0/AS1A13_034T01_9000006134_45866cztM0_level2.fits | modeM0/AS1A13_034T01_9000006134_45866cztM0_level2_quad_clean.evt |
| Size (bytes) | 544,550,400 | 96,220,800 |
| Size | 519.3 MB | 91.8 MB |
| Events in quadrant A | 5,210,605 | 670,428 |
| Events in quadrant B | 7,648,186 | 581,884 |
| Events in quadrant C | 2,693,111 | 677,713 |
| Events in quadrant D | 4,148,303 | 571,364 |
| Mode SS | |||
|---|---|---|---|
| Quadrant | BADHDUFLAG | Total packets | Discarded packets |
| A | 0 | 120 | 0 |
| B | 0 | 120 | 0 |
| C | 0 | 120 | 0 |
| D | 0 | 120 | 0 |
| Mode M0 | |||
|---|---|---|---|
| Quadrant | BADHDUFLAG | Total packets | Discarded packets |
| A | 0 | 19589 | 1 |
| B | 0 | 26880 | 1 |
| C | 0 | 12133 | 1 |
| D | 0 | 16470 | 2 |
| Mode M9 | |||
|---|---|---|---|
| Quadrant | BADHDUFLAG | Total packets | Discarded packets |
| A | 0 | 12 | 0 |
| B | 0 | 12 | 0 |
| C | 0 | 12 | 0 |
| D | 0 | 12 | 0 |
| Quadrant | Total seconds | Saturated seconds | Saturation percentage |
|---|---|---|---|
| A | 5898 | 114 | 1.932859% |
| B | 5899 | 1383 | 23.444652% |
| C | 5899 | 18 | 0.305136% |
| D | 5898 | 524 | 8.884368% |
Noise dominated data is calculated using 1-second bins in cleaned event files. If a bin has >2000 counts, and if more than 50% of those come from <1% of pixels, then it is considered to be noise-dominated and hence unusable.
| Quadrant | # 1 sec bins | Bins with >0 counts | Bins with >2000 counts | High rate bins dominated by noise | Noise dominated (total time) | Noise dominated (detector-on time) | Marked lightcurve |
|---|---|---|---|---|---|---|---|
| A | 7088 | 5899 | 8 | 8 | 0.11% | 0.14% | 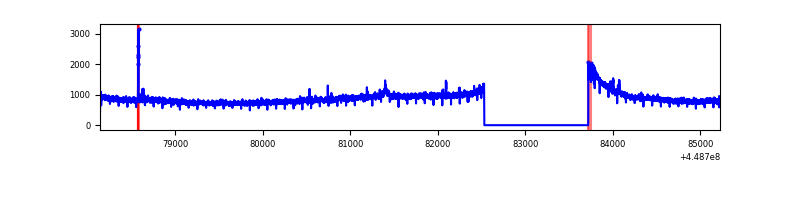 |
| B | 7089 | 5900 | 907 | 907 | 12.79% | 15.37% | 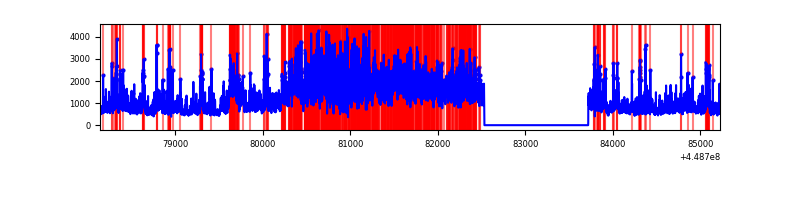 |
| C | 7089 | 5900 | 7 | 7 | 0.10% | 0.12% | 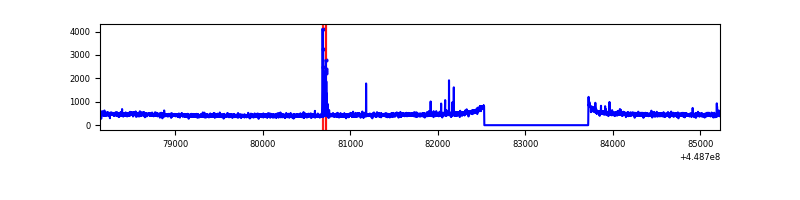 |
| D | 7088 | 5899 | 464 | 464 | 6.55% | 7.87% | 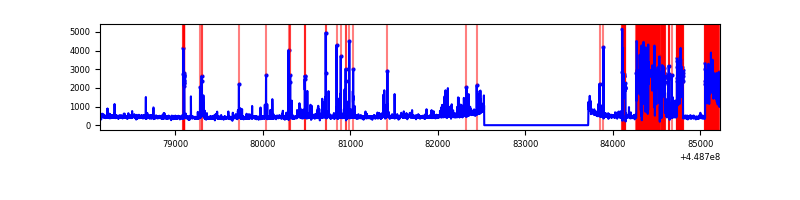 |
Top three noisy pixels from each quadrant. If the there are fewer than three noisy pixels in the level2.evt file, extra rows are filled as -1
| Pixel properties | Quadrant properties | ||||||
|---|---|---|---|---|---|---|---|
| Quadrant | DetID | PixID | Counts | Sigma | Mean | Median | Sigma |
| A | 10 | 83 | 2563367 | 18495.14 | 668 | 654 | 138.6 |
| A | 0 | 243 | 32814 | 232.1 | 668 | 654 | 138.6 |
| A | 4 | 0 | 12540 | 85.78 | 668 | 654 | 138.6 |
| B | 3 | 112 | 4582547 | 37683.11 | 628 | 608 | 121.6 |
| B | 4 | 171 | 153136 | 1254.43 | 628 | 608 | 121.6 |
| B | 5 | 172 | 134255 | 1099.15 | 628 | 608 | 121.6 |
| C | 12 | 2 | 50632 | 315.58 | 673 | 677 | 158.3 |
| C | 3 | 233 | 10644 | 62.96 | 673 | 677 | 158.3 |
| C | 12 | 250 | 4524 | 24.3 | 673 | 677 | 158.3 |
| D | 13 | 138 | 963824 | 5976.18 | 643 | 623 | 161.2 |
| D | 13 | 249 | 417210 | 2584.71 | 643 | 623 | 161.2 |
| D | 2 | 249 | 90556 | 557.99 | 643 | 623 | 161.2 |
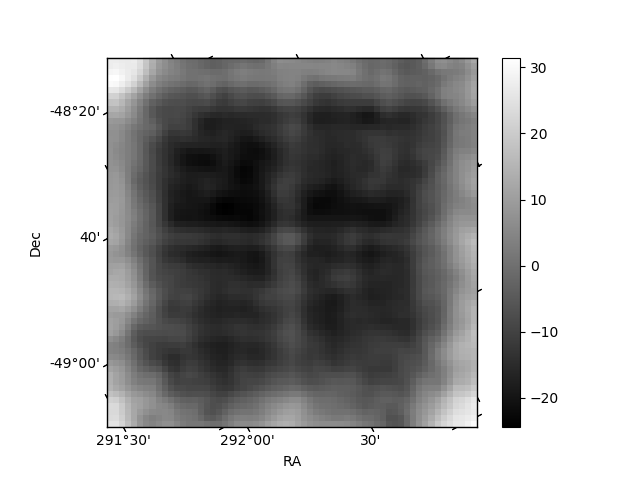
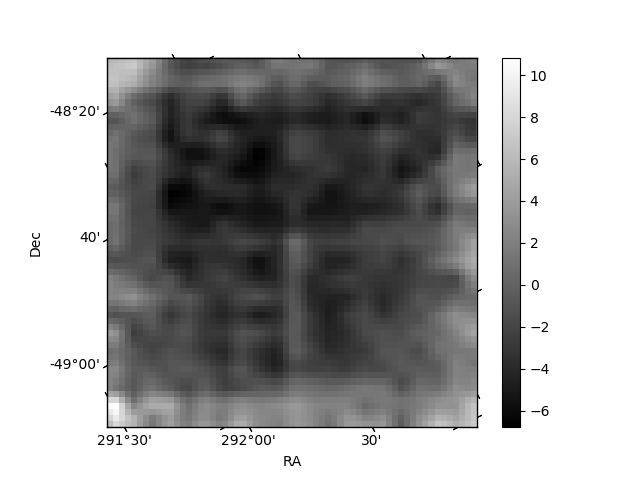
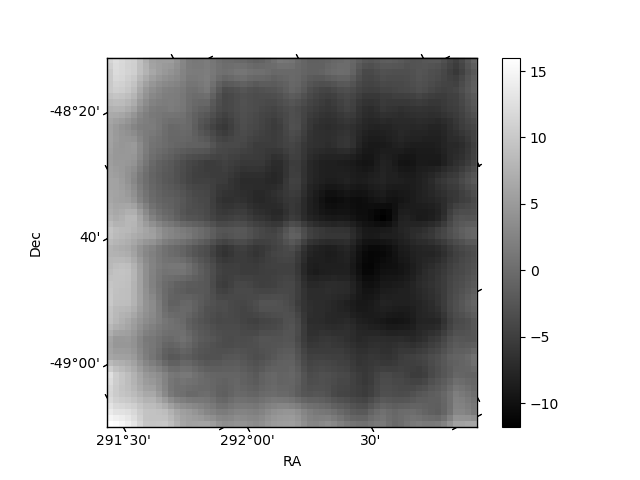
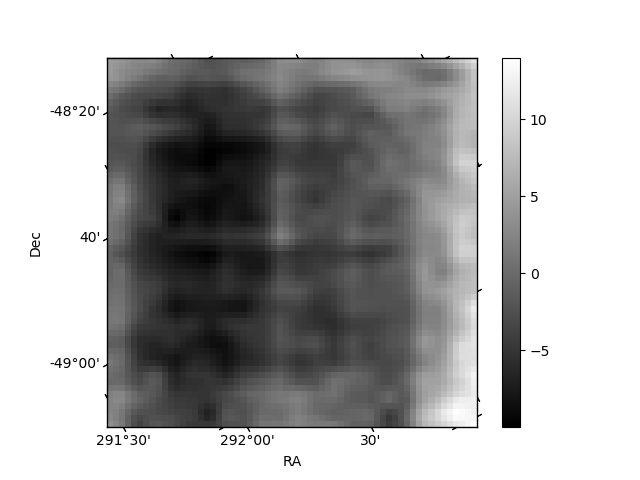
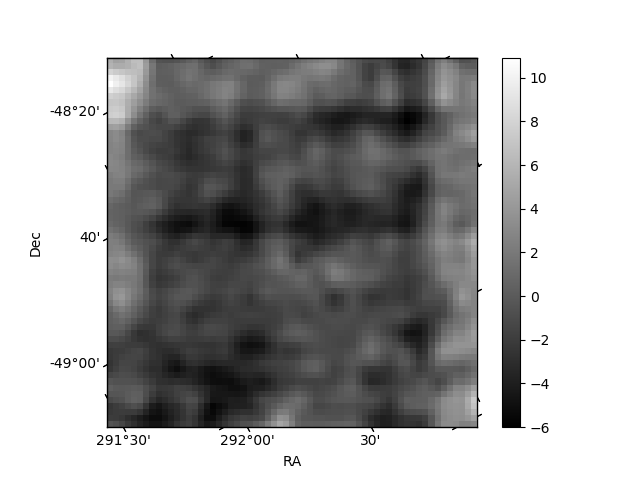
Histogram calculated using DETX and DETY for each event in the final _common_clean file
| Quadrant A | 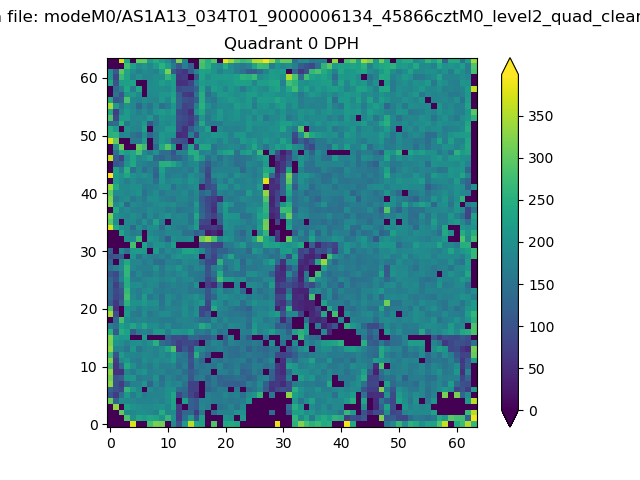 |
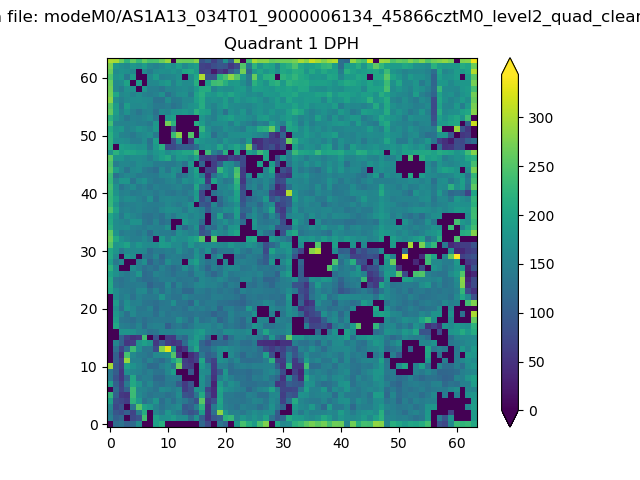 |
Quadrant B |
|---|---|---|---|
| Quadrant D | 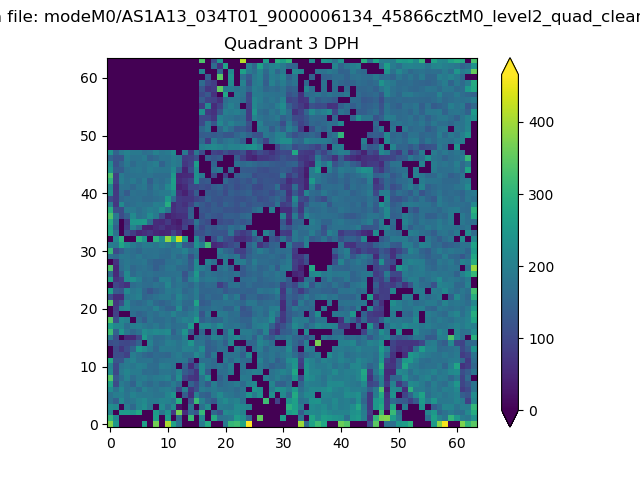 |
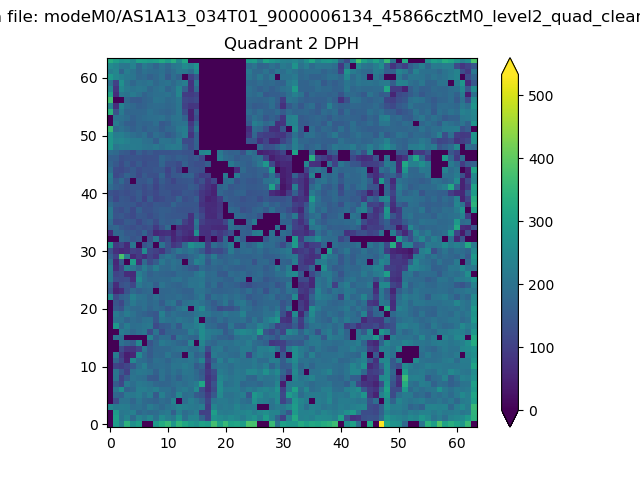 |
Quadrant C |
| Plot type | Count rate plots | Images |
|---|---|---|
| Comparison with Poisson distribution Blue bars denote a histogram of data divided into 1 sec bins. Red curve is a Poisson curve with rate = median count rate of data. |
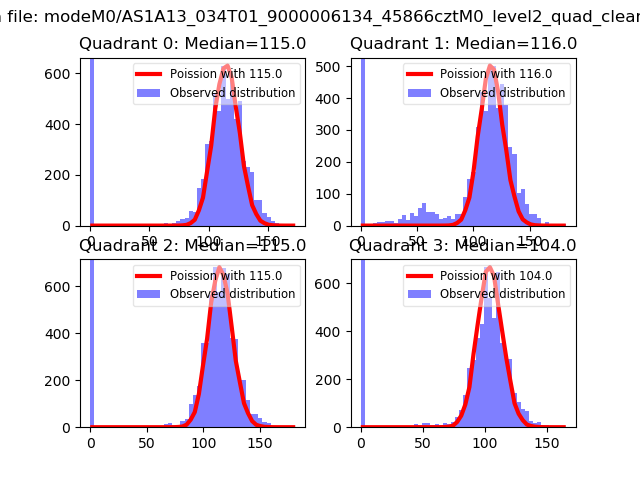 |
 |
| Quadrant-wise count rates Data is divided into 100 sec bins |
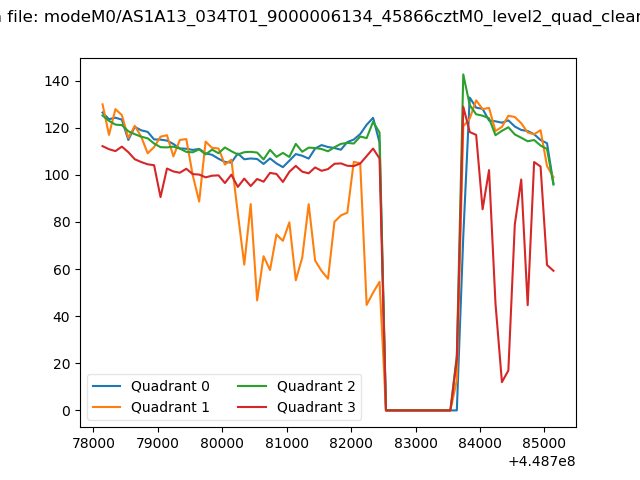 |
|
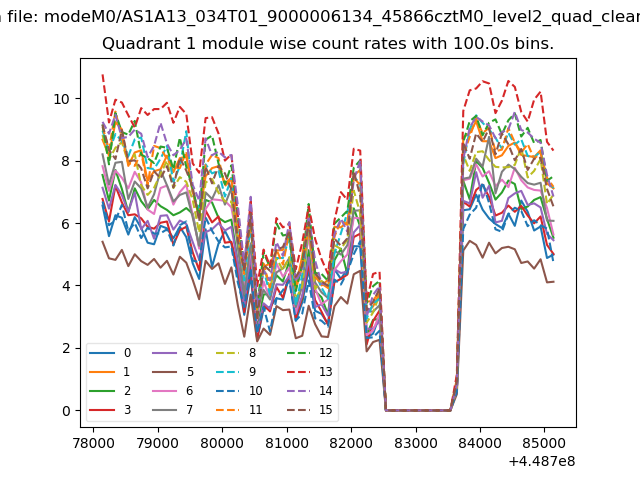
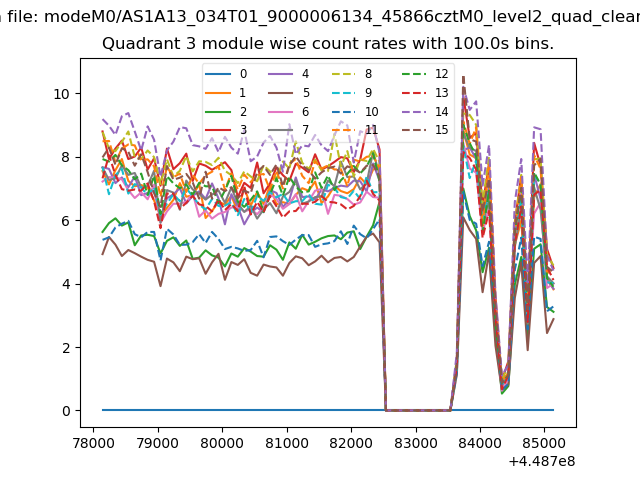
| Module-wise count rates for Quadrant A Data is divided into 100 sec bins |
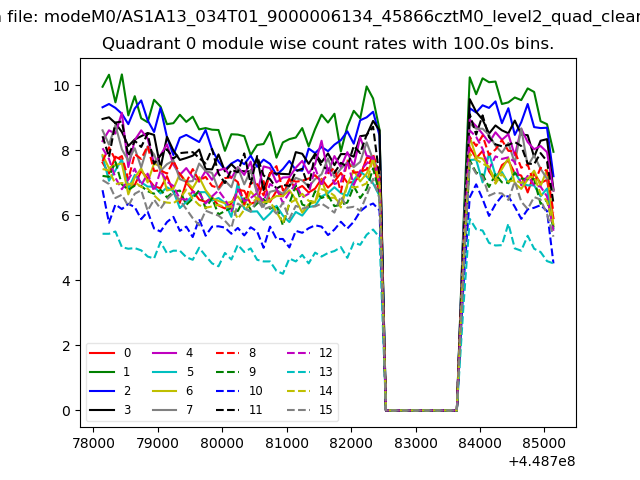 |
 |
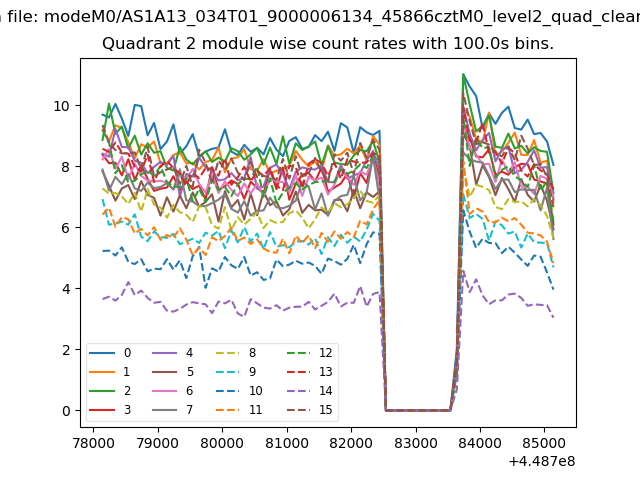
| Module-wise count rates for Quadrant B Data is divided into 100 sec bins |
 |
 |
| Module-wise count rates for Quadrant C Data is divided into 100 sec bins |
 |
 |
| Module-wise count rates for Quadrant D Data is divided into 100 sec bins |
 |
 |
| Parameter | Plot |
|---|---|
| CZT HV Monitor |  |
| D_VDD | 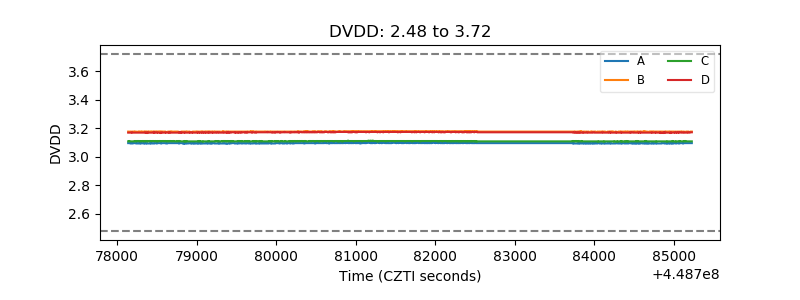 |
| Temperature 1 | 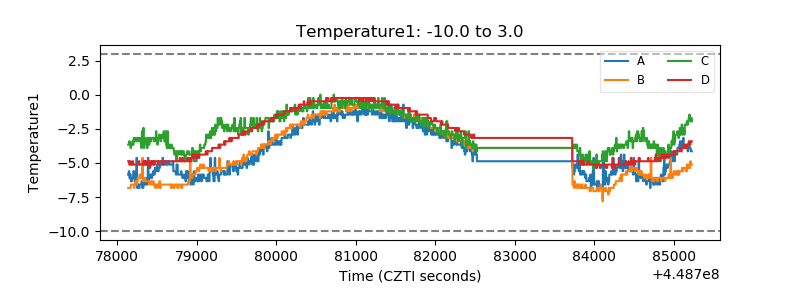 |
| Veto HV Monitor | 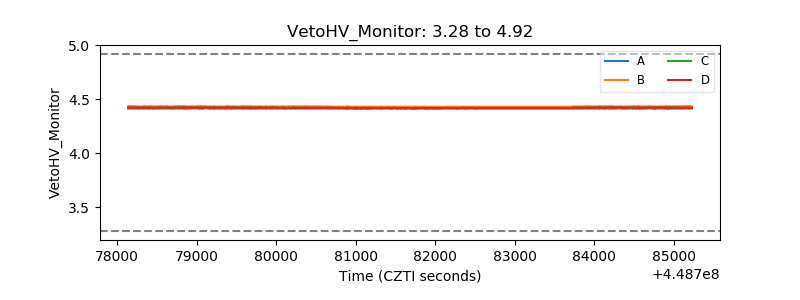 |
| Veto LLD | 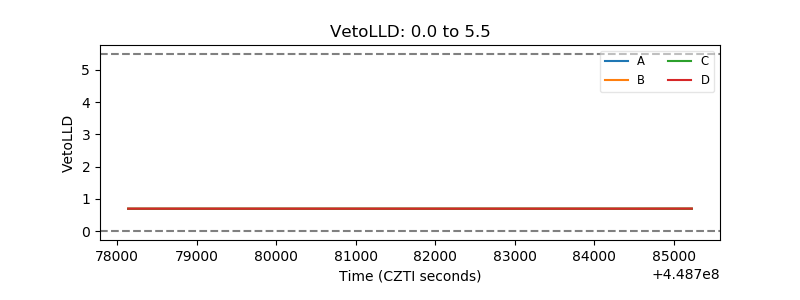 |
| Alpha Counter |  |
| _CPM_Rate | 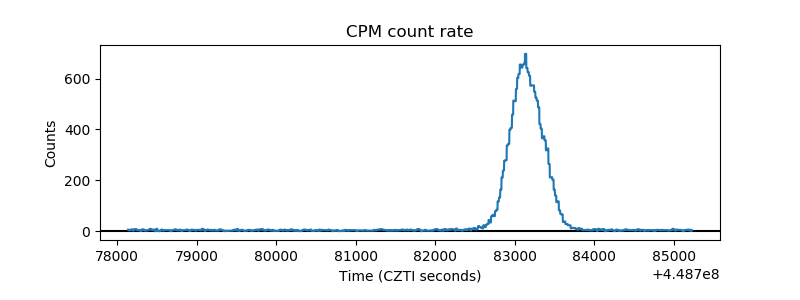 |
| CZT Counter | 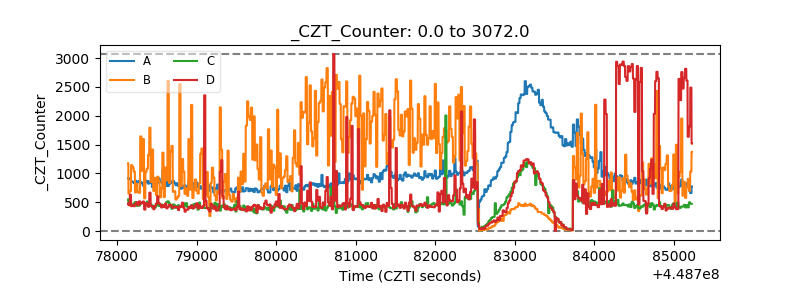 |
| +2.5 Volts monitor | 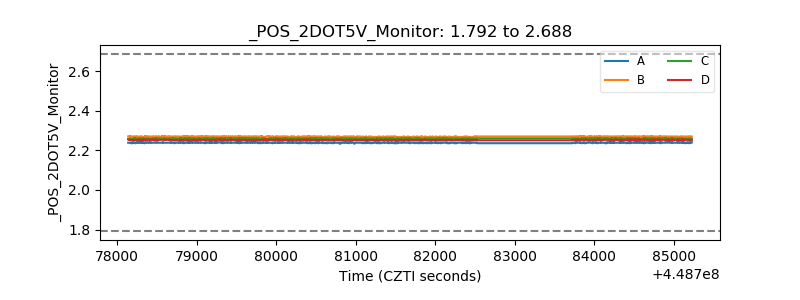 |
| +5 Volts monitor | 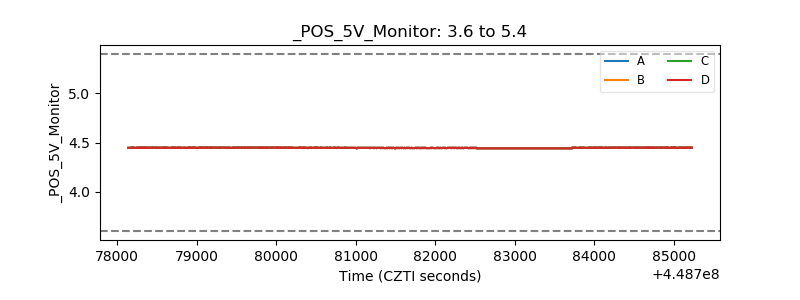 |
| _ROLL_ROT | 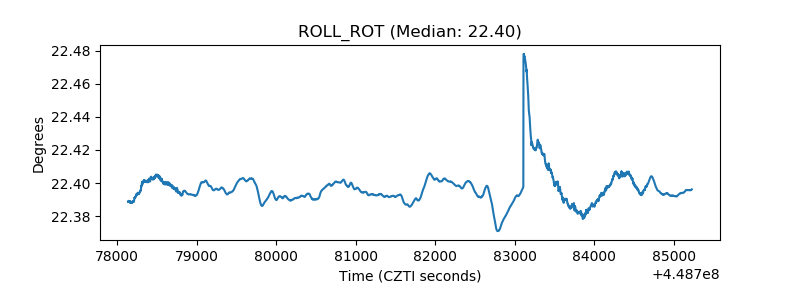 |
| _Roll_DEC | 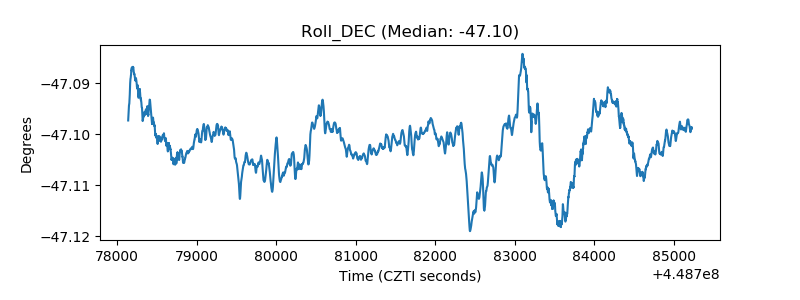 |
| _Roll_RA | 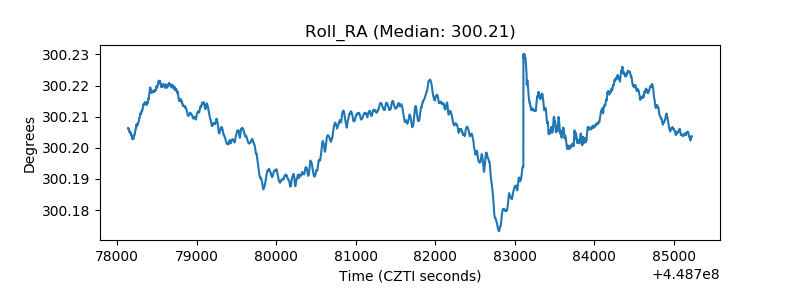 |
| Veto Counter | 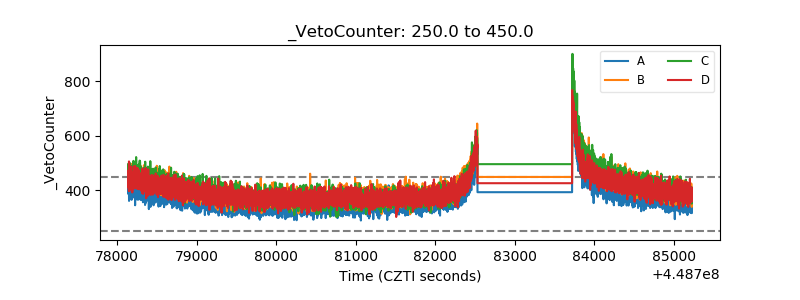 |