| Param | Original file | Final file |
|---|---|---|
| Filename | modeM0/AS1A13_034T01_9000006134_45867cztM0_level2.fits | modeM0/AS1A13_034T01_9000006134_45867cztM0_level2_quad_clean.evt |
| Size (bytes) | 656,458,560 | 89,611,200 |
| Size | 626.0 MB | 85.5 MB |
| Events in quadrant A | 5,530,756 | 674,822 |
| Events in quadrant B | 10,881,632 | 362,904 |
| Events in quadrant C | 2,755,286 | 676,579 |
| Events in quadrant D | 4,657,244 | 571,294 |
| Mode SS | |||
|---|---|---|---|
| Quadrant | BADHDUFLAG | Total packets | Discarded packets |
| A | 0 | 124 | 0 |
| B | 0 | 124 | 0 |
| C | 0 | 124 | 0 |
| D | 0 | 124 | 0 |
| Mode M0 | |||
|---|---|---|---|
| Quadrant | BADHDUFLAG | Total packets | Discarded packets |
| A | 0 | 20653 | 1 |
| B | 0 | 36537 | 1 |
| C | 0 | 12629 | 1 |
| D | 0 | 18086 | 1 |
| Mode M9 | |||
|---|---|---|---|
| Quadrant | BADHDUFLAG | Total packets | Discarded packets |
| A | 0 | 10 | 0 |
| B | 0 | 10 | 0 |
| C | 0 | 10 | 0 |
| D | 0 | 10 | 0 |
| Quadrant | Total seconds | Saturated seconds | Saturation percentage |
|---|---|---|---|
| A | 6122 | 170 | 2.776870% |
| B | 6122 | 3357 | 54.835021% |
| C | 6123 | 41 | 0.669606% |
| D | 6123 | 595 | 9.717459% |
Noise dominated data is calculated using 1-second bins in cleaned event files. If a bin has >2000 counts, and if more than 50% of those come from <1% of pixels, then it is considered to be noise-dominated and hence unusable.
| Quadrant | # 1 sec bins | Bins with >0 counts | Bins with >2000 counts | High rate bins dominated by noise | Noise dominated (total time) | Noise dominated (detector-on time) | Marked lightcurve |
|---|---|---|---|---|---|---|---|
| A | 7172 | 6124 | 12 | 12 | 0.17% | 0.20% | 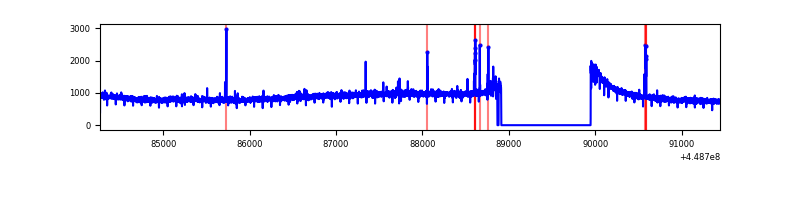 |
| B | 7171 | 6123 | 2535 | 2535 | 35.35% | 41.40% | 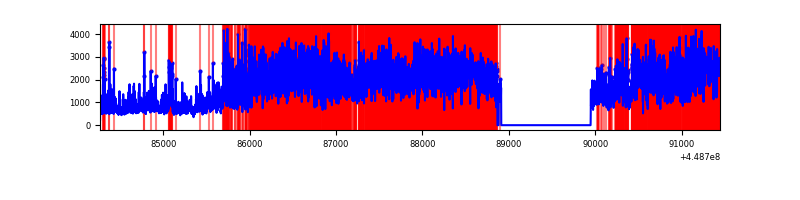 |
| C | 7173 | 6125 | 7 | 7 | 0.10% | 0.11% | 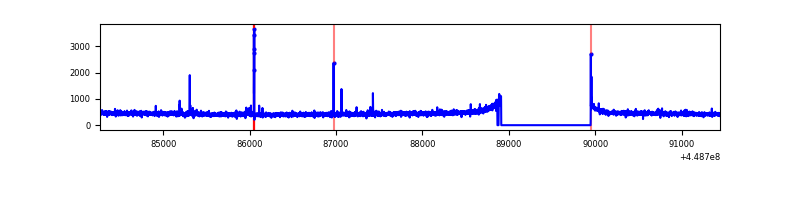 |
| D | 7173 | 6125 | 508 | 508 | 7.08% | 8.29% | 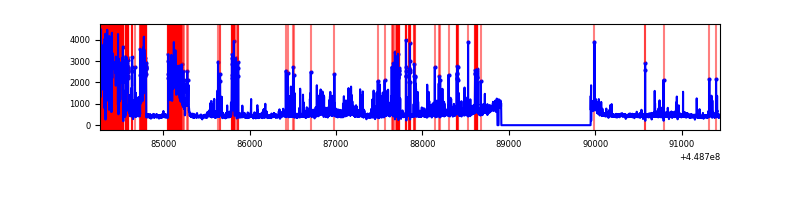 |
Top three noisy pixels from each quadrant. If the there are fewer than three noisy pixels in the level2.evt file, extra rows are filled as -1
| Pixel properties | Quadrant properties | ||||||
|---|---|---|---|---|---|---|---|
| Quadrant | DetID | PixID | Counts | Sigma | Mean | Median | Sigma |
| A | 10 | 83 | 2783490 | 19318.81 | 690 | 673 | 144.0 |
| A | 0 | 247 | 40590 | 277.11 | 690 | 673 | 144.0 |
| A | 13 | 248 | 14310 | 94.67 | 690 | 673 | 144.0 |
| B | 3 | 112 | 8239772 | 76191.44 | 555 | 539 | 108.1 |
| B | 0 | 183 | 99181 | 912.18 | 555 | 539 | 108.1 |
| B | 0 | 189 | 88253 | 811.13 | 555 | 539 | 108.1 |
| C | 12 | 2 | 40094 | 242.5 | 691 | 693 | 162.5 |
| C | 12 | 249 | 11442 | 66.16 | 691 | 693 | 162.5 |
| C | 3 | 233 | 6868 | 38.01 | 691 | 693 | 162.5 |
| D | 13 | 138 | 909340 | 5477.27 | 664 | 644 | 165.9 |
| D | 13 | 249 | 438073 | 2636.65 | 664 | 644 | 165.9 |
| D | 1 | 52 | 286384 | 1722.33 | 664 | 644 | 165.9 |
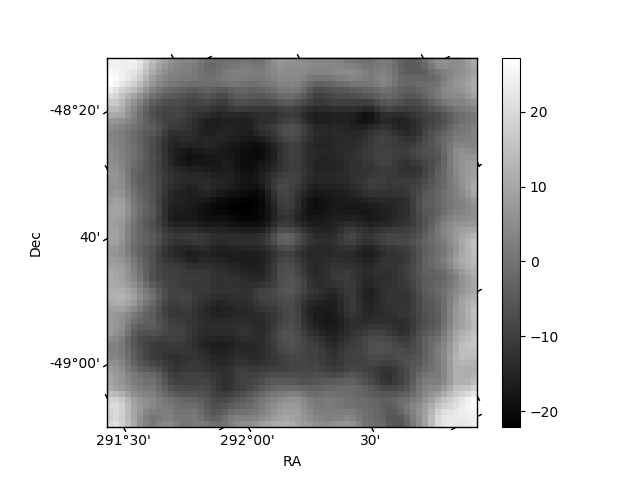
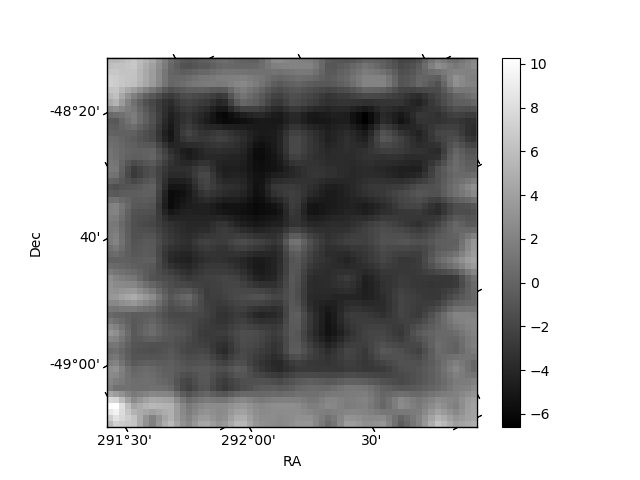
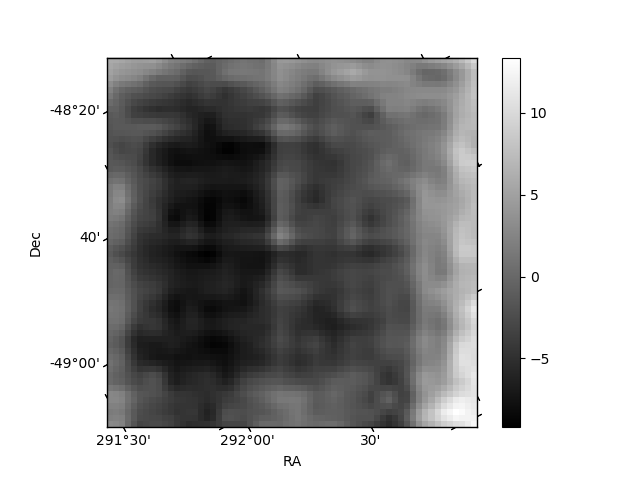
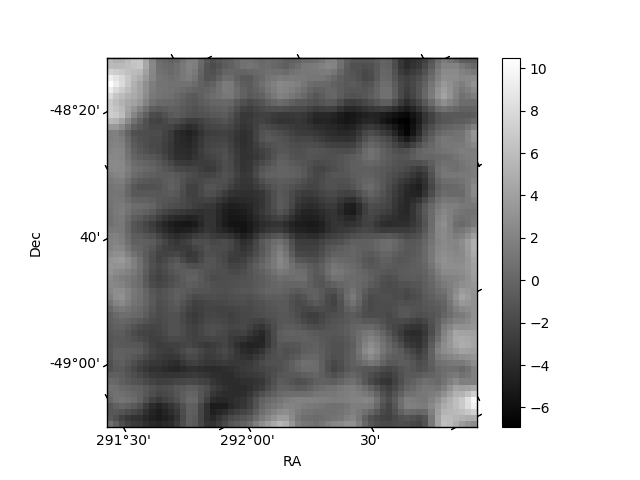
Histogram calculated using DETX and DETY for each event in the final _common_clean file
| Quadrant A | 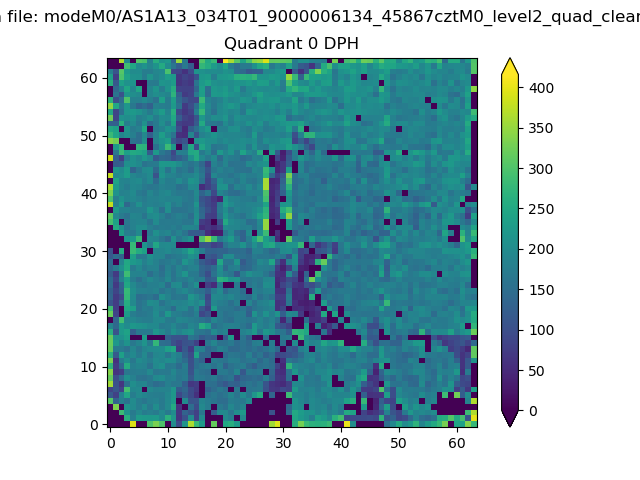 |
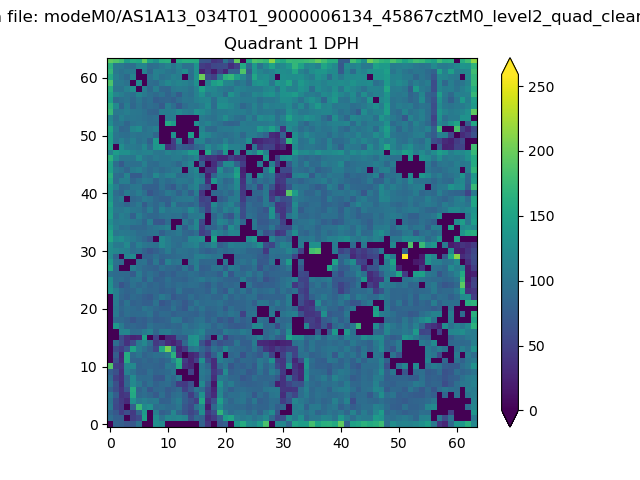 |
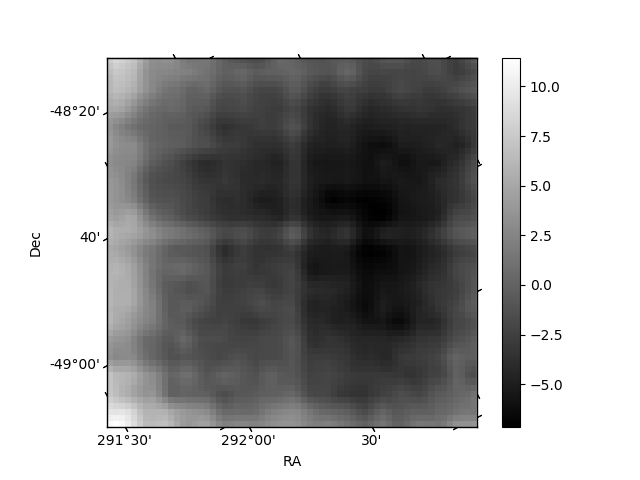
Quadrant B |
|---|---|---|---|
| Quadrant D | 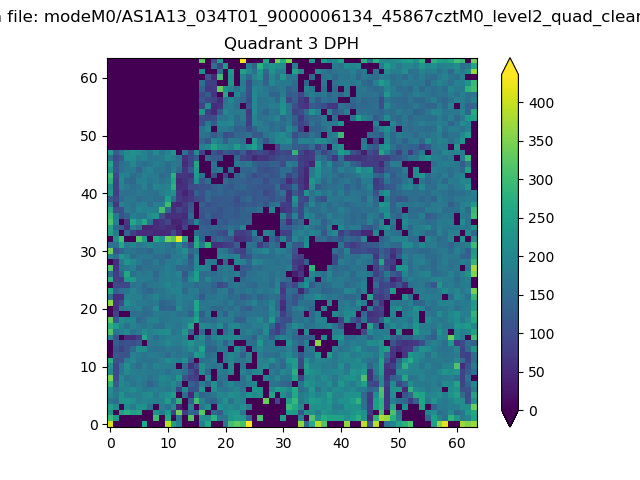 |
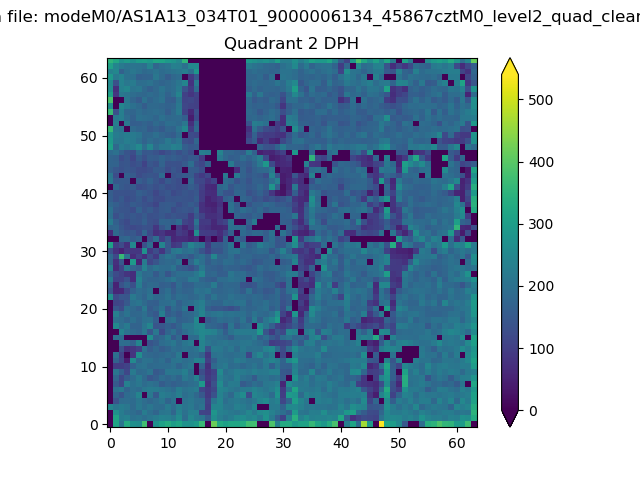 |
Quadrant C |
| Plot type | Count rate plots | Images |
|---|---|---|
| Comparison with Poisson distribution Blue bars denote a histogram of data divided into 1 sec bins. Red curve is a Poisson curve with rate = median count rate of data. |
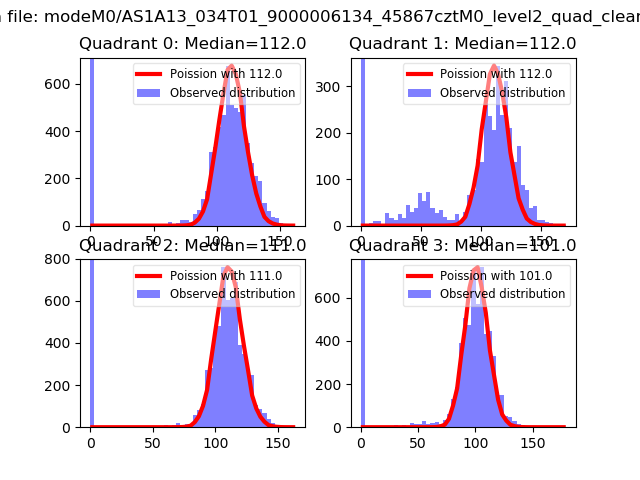 |
 |
| Quadrant-wise count rates Data is divided into 100 sec bins |
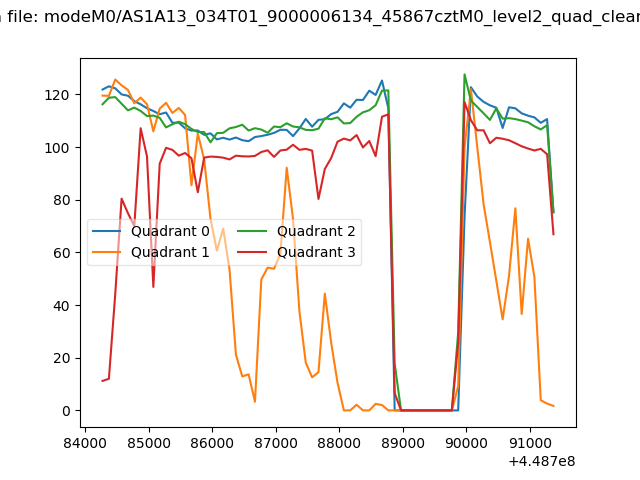 |
|
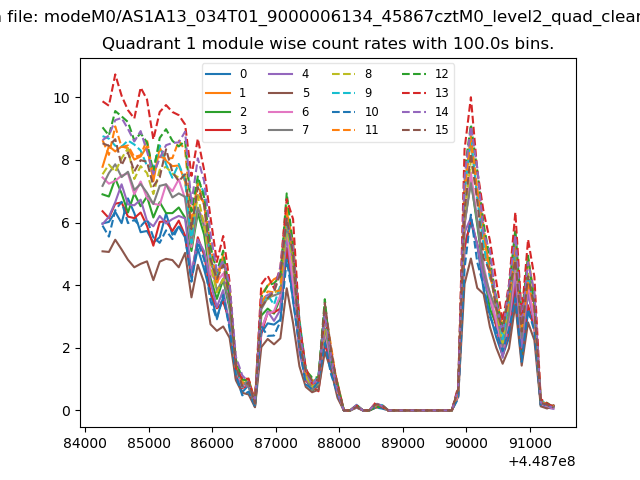
| Module-wise count rates for Quadrant A Data is divided into 100 sec bins |
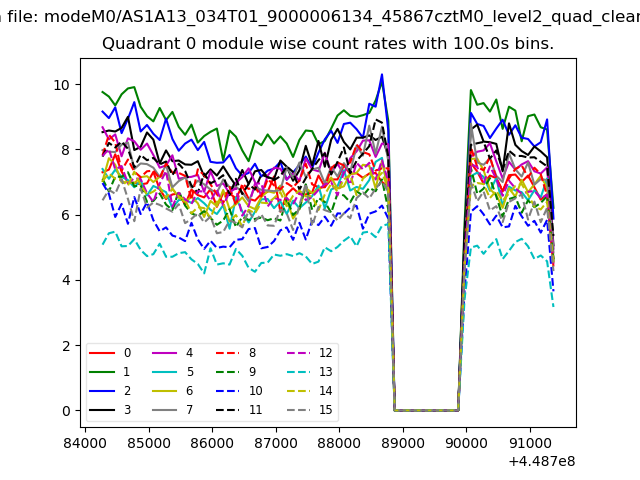 |
 |
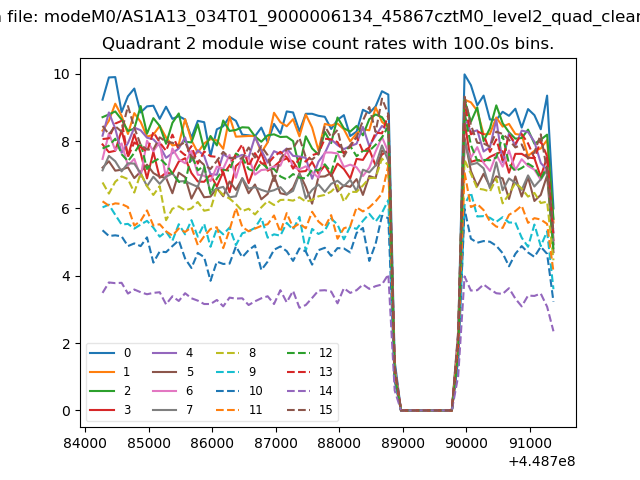
| Module-wise count rates for Quadrant B Data is divided into 100 sec bins |
 |
 |
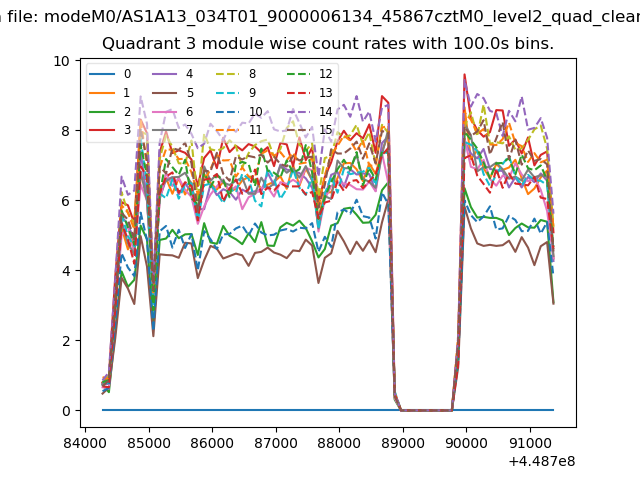
| Module-wise count rates for Quadrant C Data is divided into 100 sec bins |
 |
 |
| Module-wise count rates for Quadrant D Data is divided into 100 sec bins |
 |
 |
| Parameter | Plot |
|---|---|
| CZT HV Monitor | 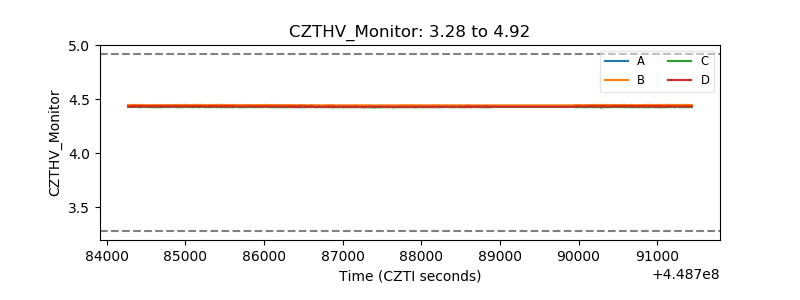 |
| D_VDD | 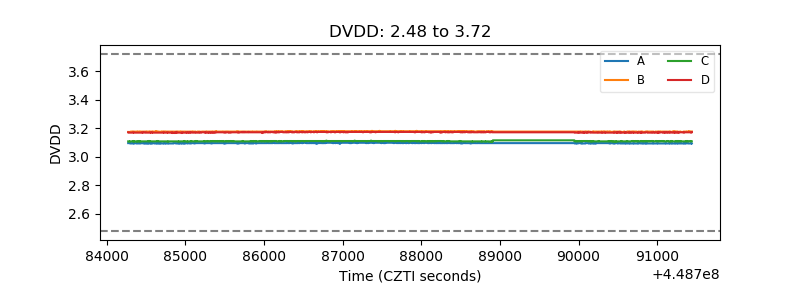 |
| Temperature 1 | 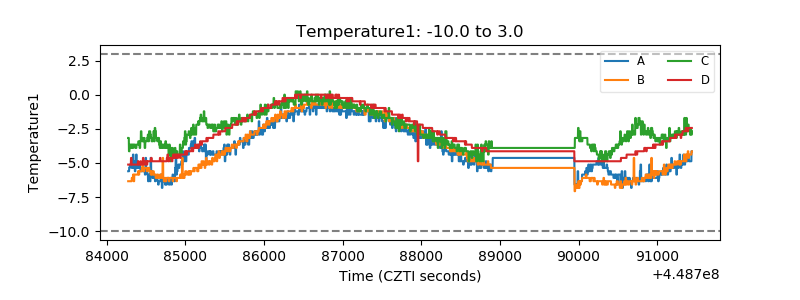 |
| Veto HV Monitor | 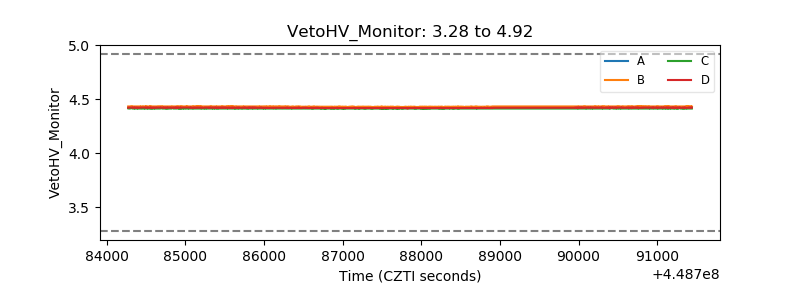 |
| Veto LLD | 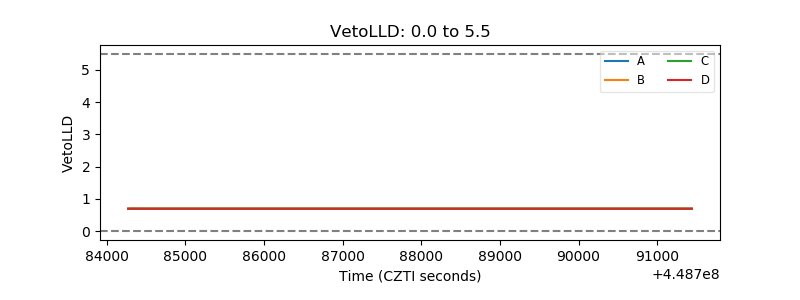 |
| Alpha Counter | 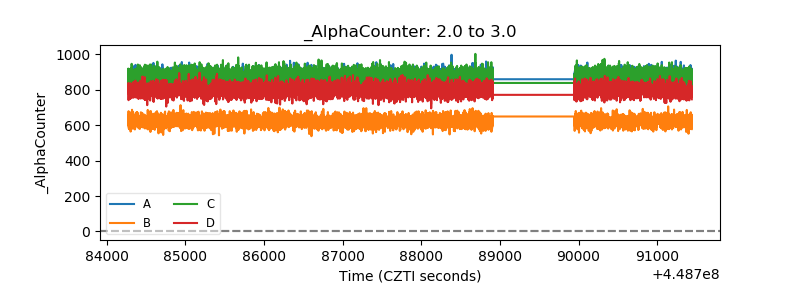 |
| _CPM_Rate | 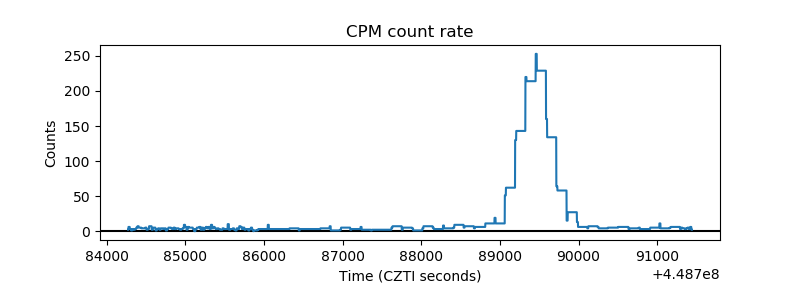 |
| CZT Counter | 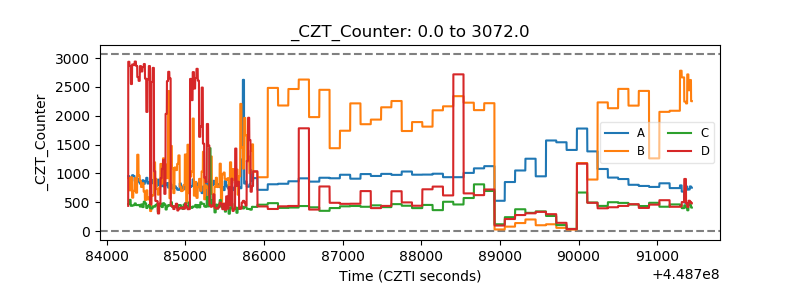 |
| +2.5 Volts monitor | 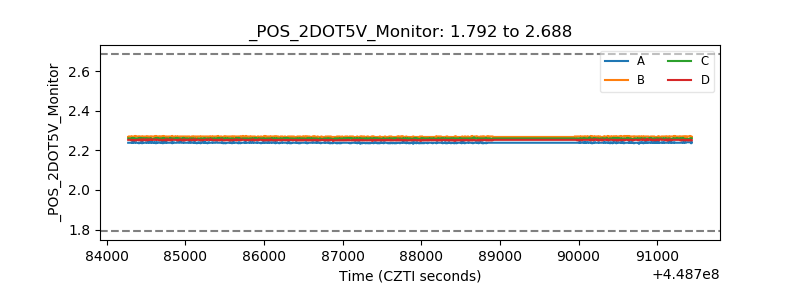 |
| +5 Volts monitor |  |
| _ROLL_ROT | 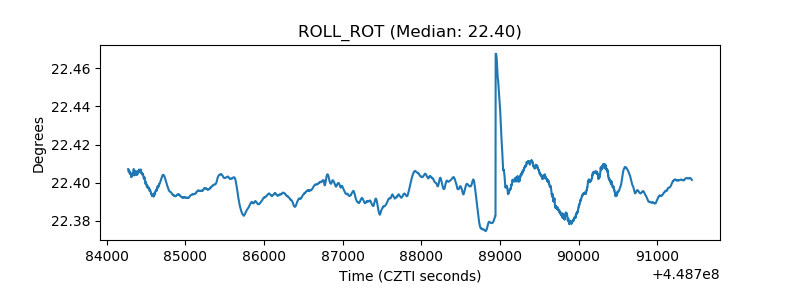 |
| _Roll_DEC | 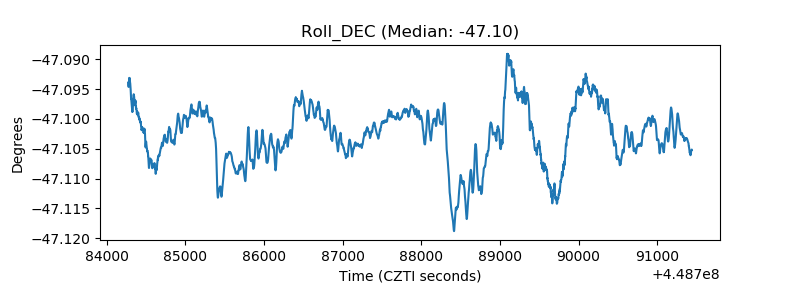 |
| _Roll_RA | 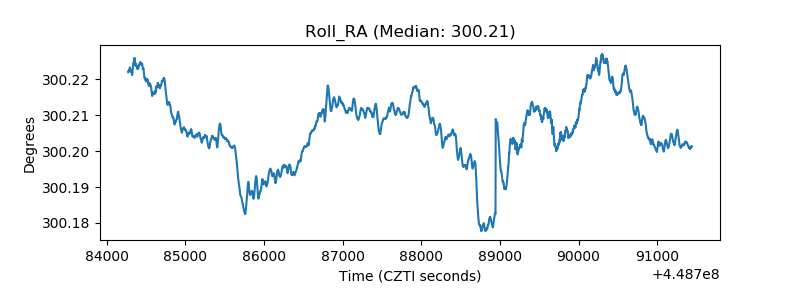 |
| Veto Counter | 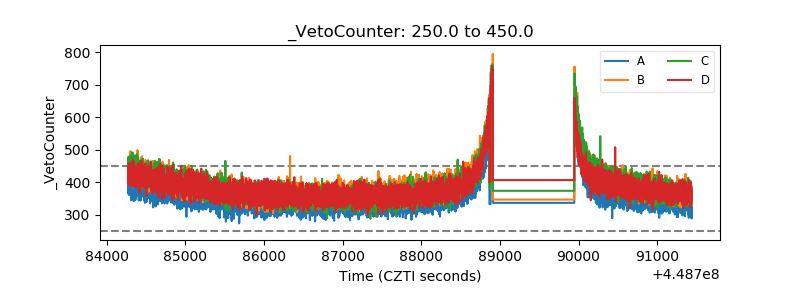 |