| Param | Original file | Final file |
|---|---|---|
| Filename | modeM0/AS1A13_034T01_9000006134_45868cztM0_level2.fits | modeM0/AS1A13_034T01_9000006134_45868cztM0_level2_quad_clean.evt |
| Size (bytes) | 689,446,080 | 101,494,080 |
| Size | 657.5 MB | 96.8 MB |
| Events in quadrant A | 6,383,773 | 706,896 |
| Events in quadrant B | 11,404,337 | 498,421 |
| Events in quadrant C | 3,090,287 | 739,575 |
| Events in quadrant D | 4,111,036 | 649,589 |
| Mode SS | |||
|---|---|---|---|
| Quadrant | BADHDUFLAG | Total packets | Discarded packets |
| A | 0 | 140 | 0 |
| B | 0 | 140 | 0 |
| C | 0 | 140 | 0 |
| D | 0 | 140 | 0 |
| Mode M0 | |||
|---|---|---|---|
| Quadrant | BADHDUFLAG | Total packets | Discarded packets |
| A | 0 | 23492 | 1 |
| B | 0 | 38693 | 1 |
| C | 0 | 14148 | 1 |
| D | 0 | 16959 | 1 |
| Mode M9 | |||
|---|---|---|---|
| Quadrant | BADHDUFLAG | Total packets | Discarded packets |
| A | 0 | 7 | 0 |
| B | 0 | 7 | 0 |
| C | 0 | 7 | 0 |
| D | 0 | 7 | 0 |
| Quadrant | Total seconds | Saturated seconds | Saturation percentage |
|---|---|---|---|
| A | 6862 | 390 | 5.683474% |
| B | 6861 | 2894 | 42.180440% |
| C | 6861 | 49 | 0.714182% |
| D | 6861 | 323 | 4.707769% |
Noise dominated data is calculated using 1-second bins in cleaned event files. If a bin has >2000 counts, and if more than 50% of those come from <1% of pixels, then it is considered to be noise-dominated and hence unusable.
| Quadrant | # 1 sec bins | Bins with >0 counts | Bins with >2000 counts | High rate bins dominated by noise | Noise dominated (total time) | Noise dominated (detector-on time) | Marked lightcurve |
|---|---|---|---|---|---|---|---|
| A | 7602 | 6863 | 141 | 141 | 1.85% | 2.05% | 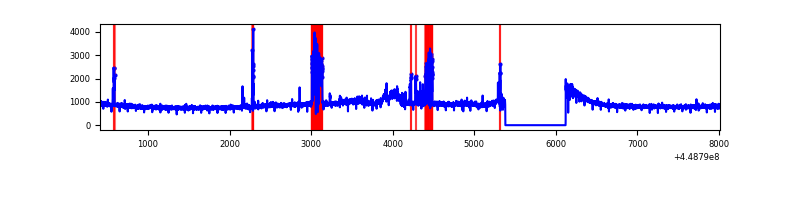 |
| B | 7600 | 6861 | 2137 | 2137 | 28.12% | 31.15% | 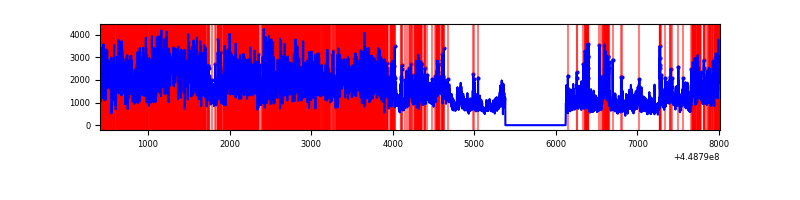 |
| C | 7601 | 6862 | 5 | 5 | 0.07% | 0.07% | 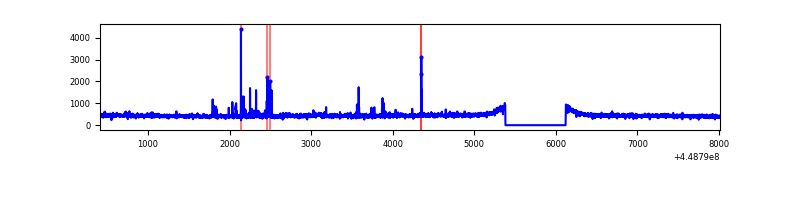 |
| D | 7601 | 6862 | 163 | 163 | 2.14% | 2.38% | 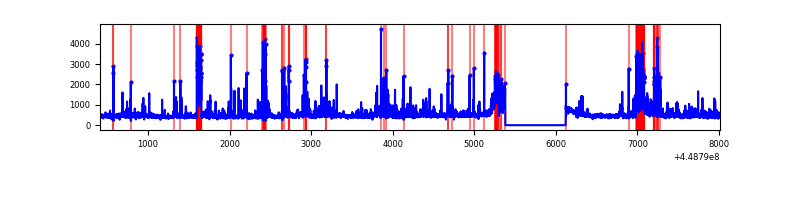 |
Top three noisy pixels from each quadrant. If the there are fewer than three noisy pixels in the level2.evt file, extra rows are filled as -1
| Pixel properties | Quadrant properties | ||||||
|---|---|---|---|---|---|---|---|
| Quadrant | DetID | PixID | Counts | Sigma | Mean | Median | Sigma |
| A | 10 | 83 | 2900696 | 18232.04 | 758 | 738 | 159.1 |
| A | 0 | 247 | 475332 | 2983.77 | 758 | 738 | 159.1 |
| A | 0 | 226 | 33981 | 209.0 | 758 | 738 | 159.1 |
| B | 3 | 112 | 7448344 | 57605.93 | 662 | 641 | 129.3 |
| B | 4 | 171 | 656900 | 5075.98 | 662 | 641 | 129.3 |
| B | 12 | 18 | 193480 | 1491.56 | 662 | 641 | 129.3 |
| C | 12 | 2 | 78208 | 429.83 | 762 | 765 | 180.2 |
| C | 3 | 233 | 38994 | 212.18 | 762 | 765 | 180.2 |
| C | 13 | 61 | 4953 | 23.24 | 762 | 765 | 180.2 |
| D | 12 | 2 | 325925 | 1723.61 | 754 | 730 | 188.7 |
| D | 1 | 52 | 181294 | 957.03 | 754 | 730 | 188.7 |
| D | 6 | 143 | 160468 | 846.65 | 754 | 730 | 188.7 |
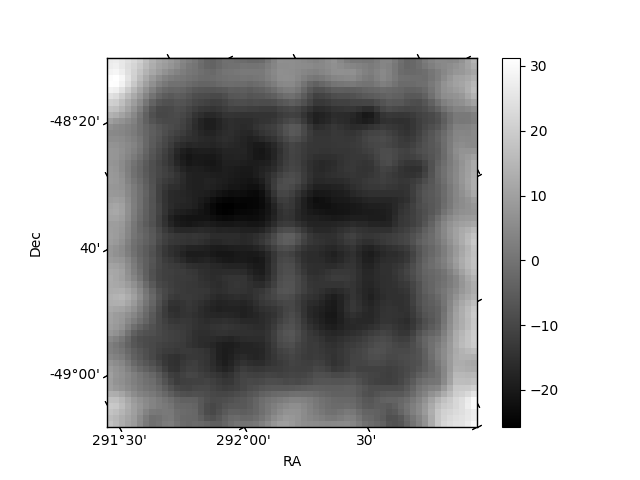
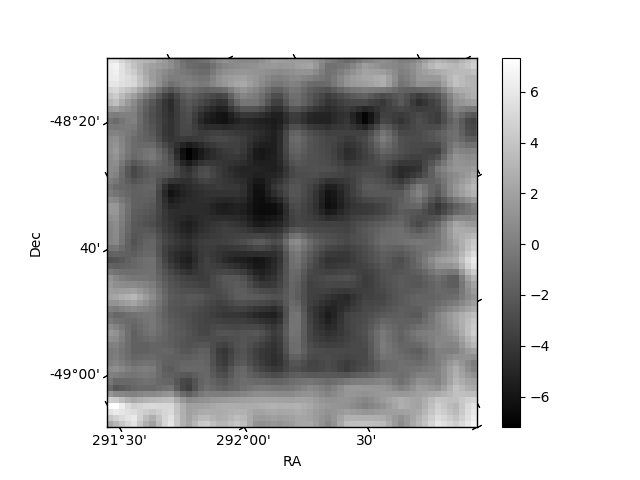
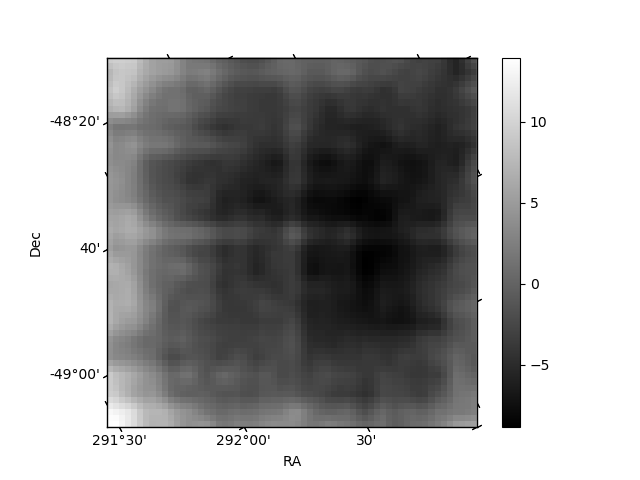
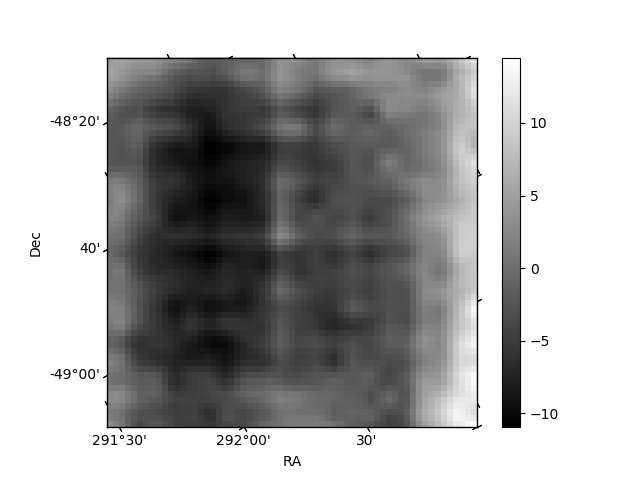
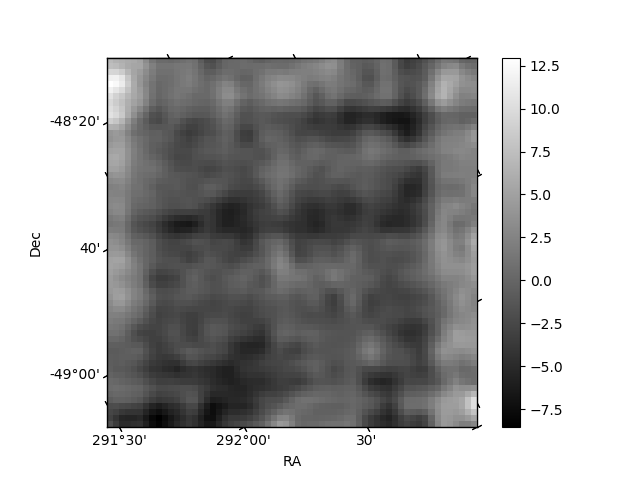
Histogram calculated using DETX and DETY for each event in the final _common_clean file
| Quadrant A | 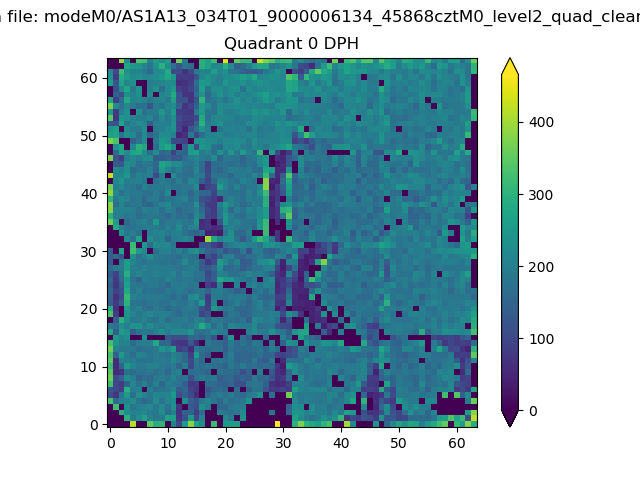 |
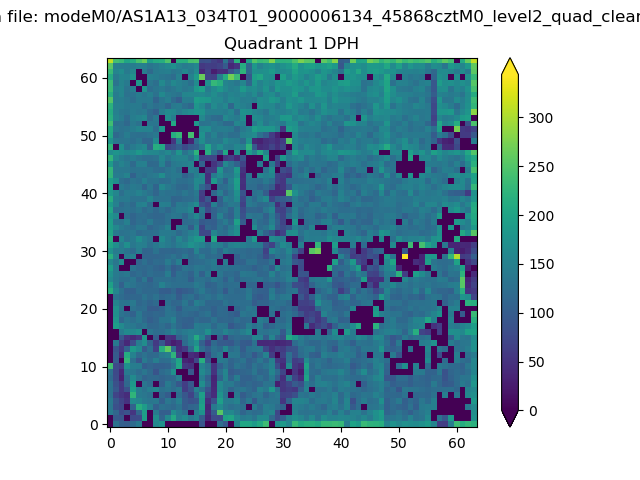 |
Quadrant B |
|---|---|---|---|
| Quadrant D | 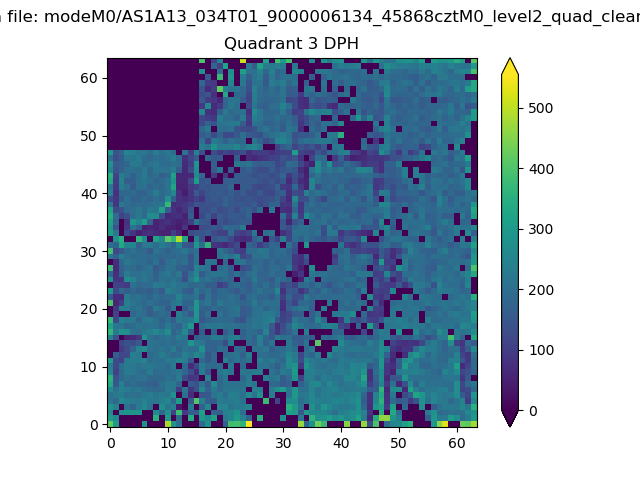 |
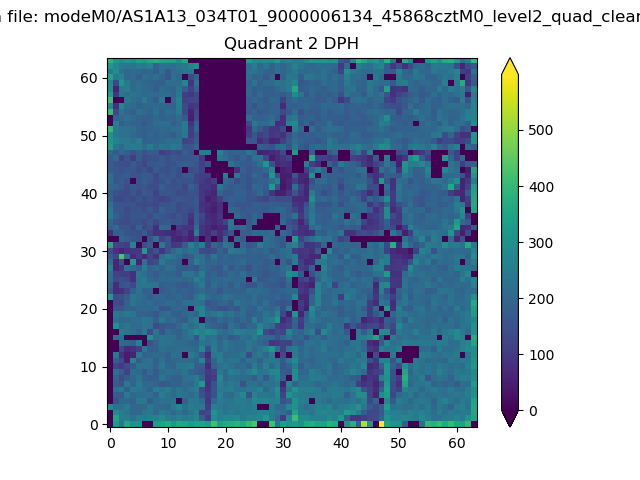 |
Quadrant C |
| Plot type | Count rate plots | Images |
|---|---|---|
| Comparison with Poisson distribution Blue bars denote a histogram of data divided into 1 sec bins. Red curve is a Poisson curve with rate = median count rate of data. |
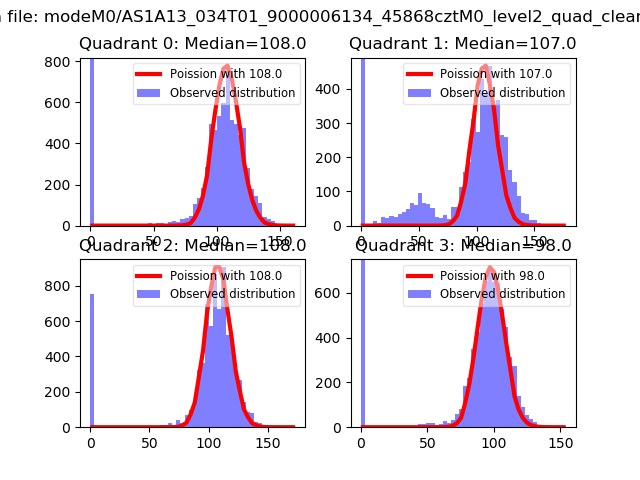 |
 |
| Quadrant-wise count rates Data is divided into 100 sec bins |
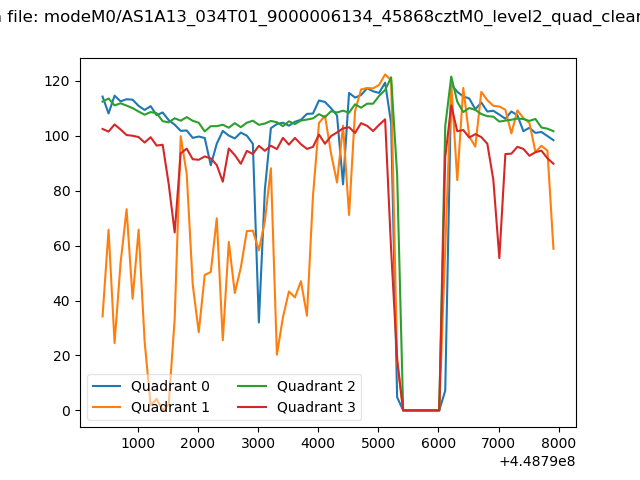 |
|
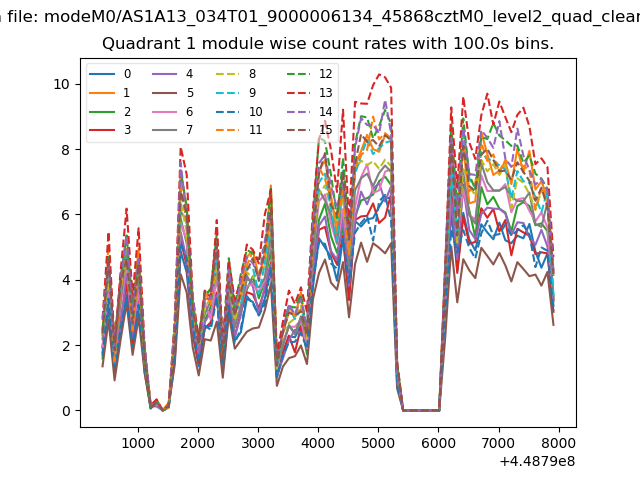
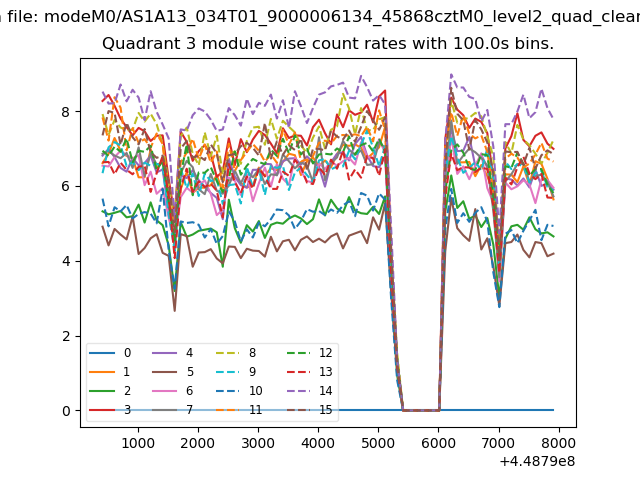
| Module-wise count rates for Quadrant A Data is divided into 100 sec bins |
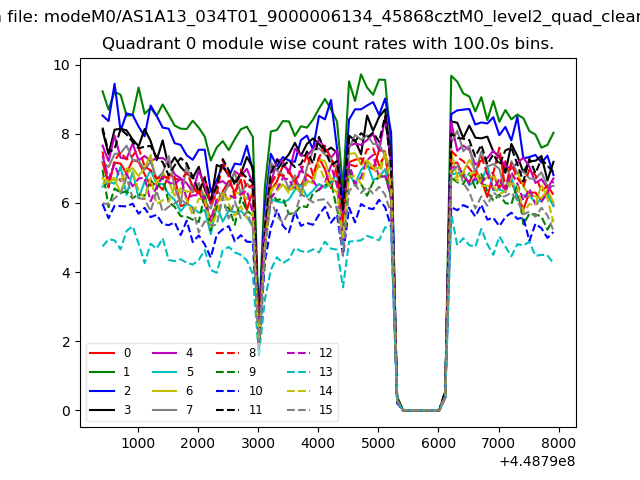 |
 |
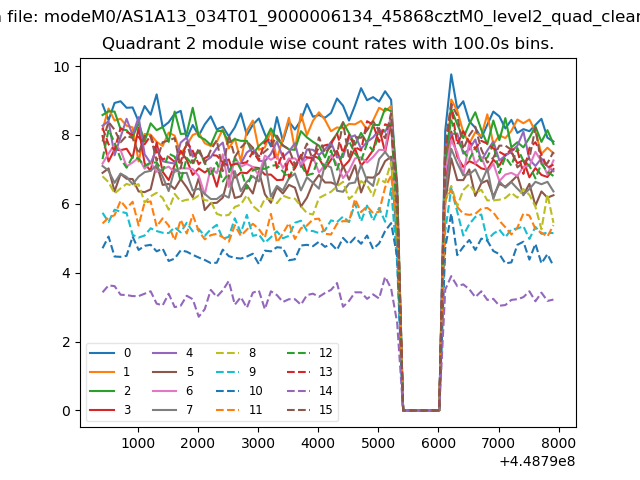
| Module-wise count rates for Quadrant B Data is divided into 100 sec bins |
 |
 |
| Module-wise count rates for Quadrant C Data is divided into 100 sec bins |
 |
 |
| Module-wise count rates for Quadrant D Data is divided into 100 sec bins |
 |
 |
| Parameter | Plot |
|---|---|
| CZT HV Monitor | 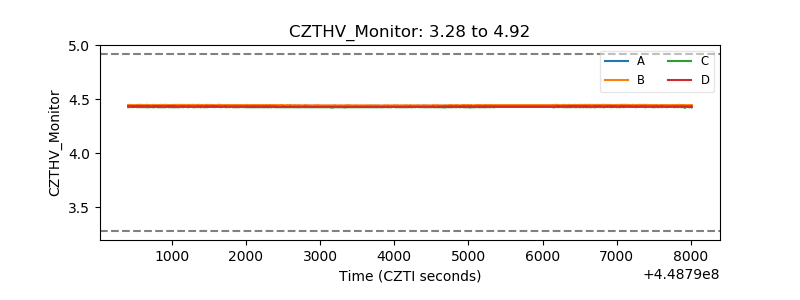 |
| D_VDD | 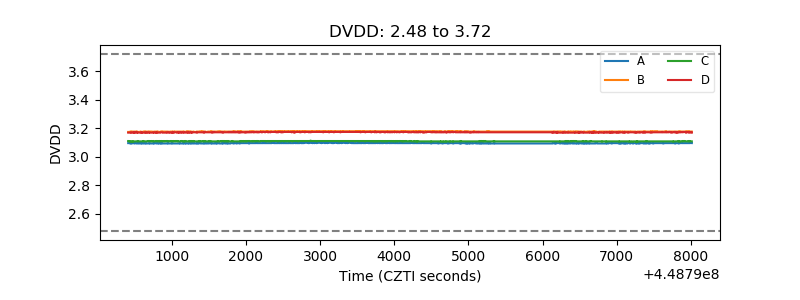 |
| Temperature 1 | 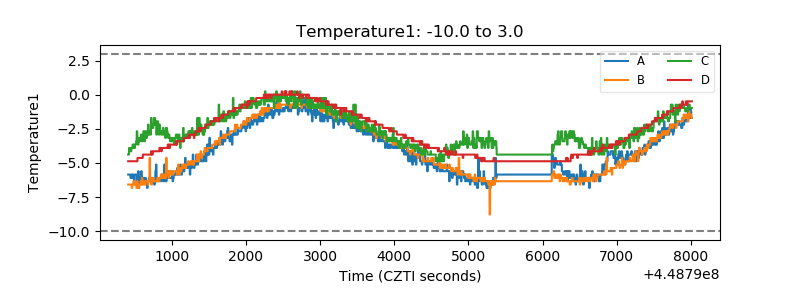 |
| Veto HV Monitor | 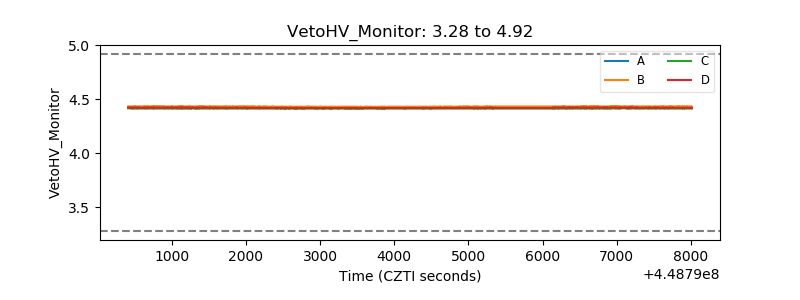 |
| Veto LLD | 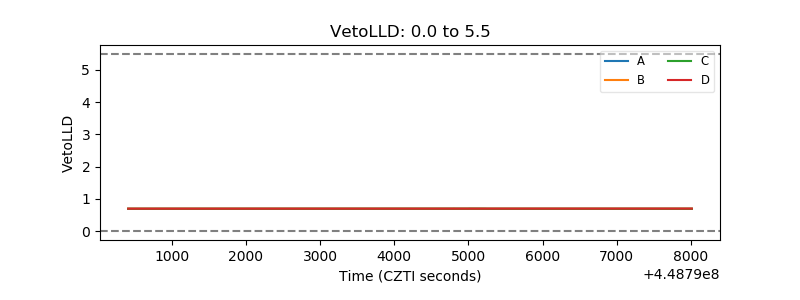 |
| Alpha Counter | 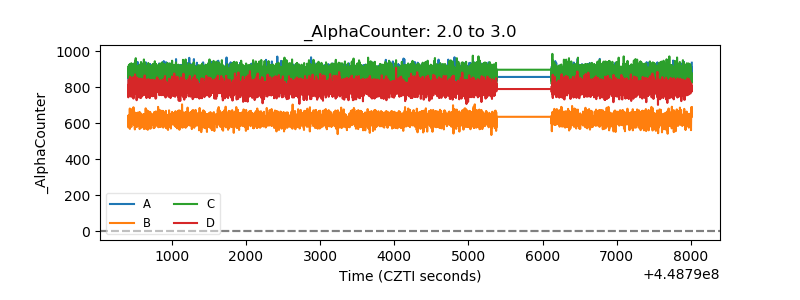 |
| _CPM_Rate | 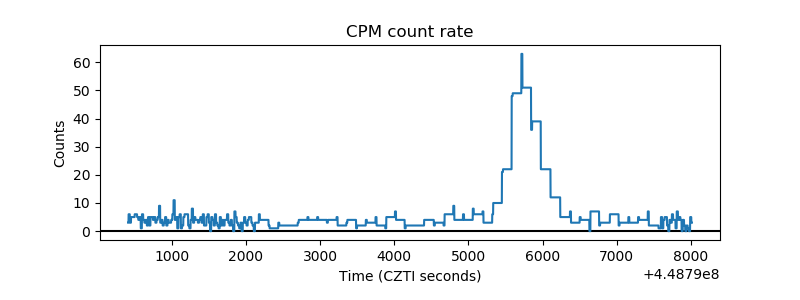 |
| CZT Counter | 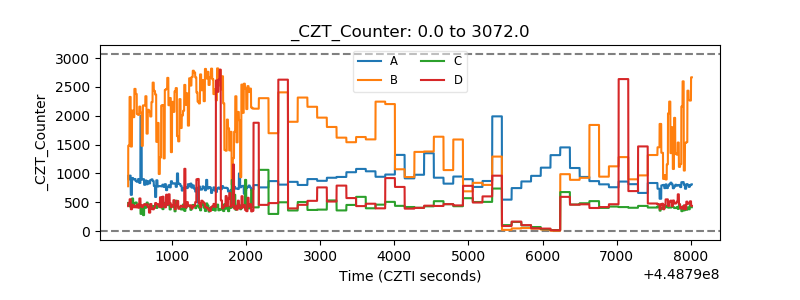 |
| +2.5 Volts monitor | 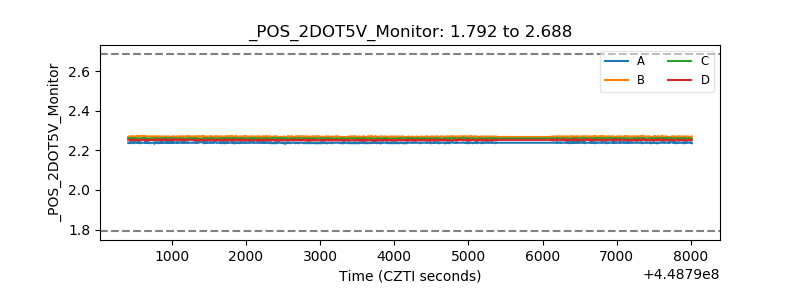 |
| +5 Volts monitor | 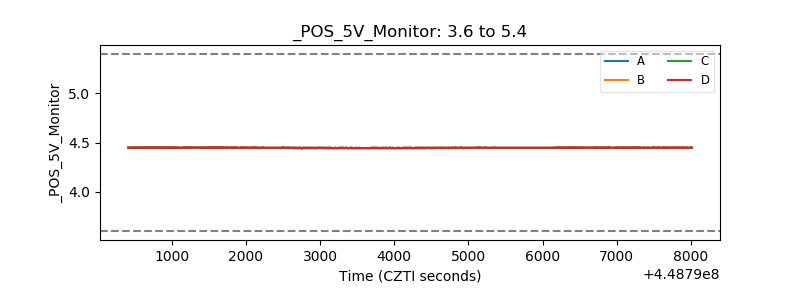 |
| _ROLL_ROT | 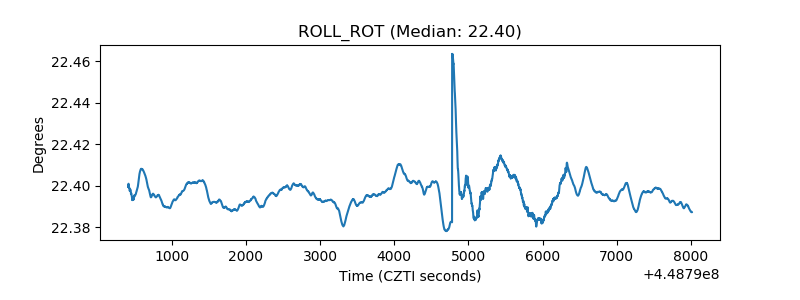 |
| _Roll_DEC | 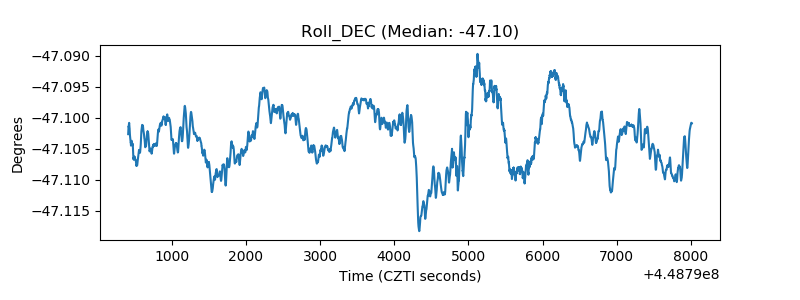 |
| _Roll_RA | 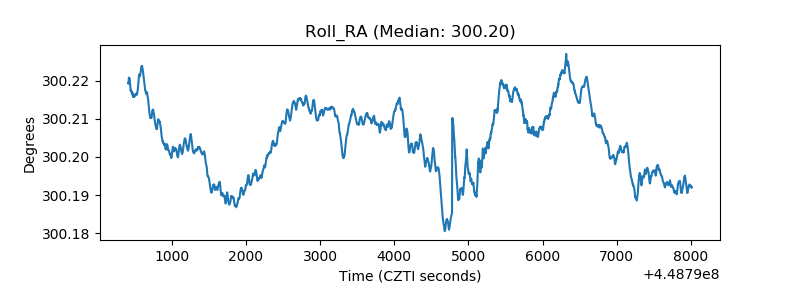 |
| Veto Counter | 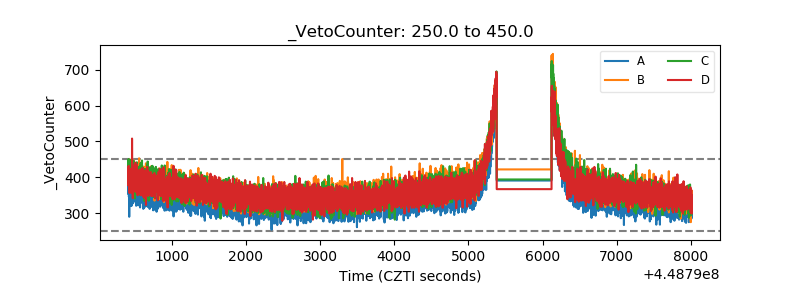 |