| Param | Original file | Final file |
|---|---|---|
| Filename | modeM0/AS1A13_034T01_9000006134_45870cztM0_level2.fits | modeM0/AS1A13_034T01_9000006134_45870cztM0_level2_quad_clean.evt |
| Size (bytes) | 862,669,440 | 98,470,080 |
| Size | 822.7 MB | 93.9 MB |
| Events in quadrant A | 6,459,136 | 785,084 |
| Events in quadrant B | 15,709,225 | 230,060 |
| Events in quadrant C | 3,230,295 | 789,550 |
| Events in quadrant D | 5,954,851 | 656,612 |
| Mode SS | |||
|---|---|---|---|
| Quadrant | BADHDUFLAG | Total packets | Discarded packets |
| A | 0 | 148 | 0 |
| B | 0 | 148 | 0 |
| C | 0 | 148 | 0 |
| D | 0 | 148 | 0 |
| Mode M0 | |||
|---|---|---|---|
| Quadrant | BADHDUFLAG | Total packets | Discarded packets |
| A | 0 | 23645 | 0 |
| B | 0 | 51793 | 0 |
| C | 0 | 15342 | 0 |
| D | 0 | 22820 | 0 |
| Quadrant | Total seconds | Saturated seconds | Saturation percentage |
|---|---|---|---|
| A | 7474 | 133 | 1.779502% |
| B | 7474 | 5864 | 78.458657% |
| C | 7474 | 8 | 0.107038% |
| D | 7475 | 771 | 10.314381% |
Noise dominated data is calculated using 1-second bins in cleaned event files. If a bin has >2000 counts, and if more than 50% of those come from <1% of pixels, then it is considered to be noise-dominated and hence unusable.
| Quadrant | # 1 sec bins | Bins with >0 counts | Bins with >2000 counts | High rate bins dominated by noise | Noise dominated (total time) | Noise dominated (detector-on time) | Marked lightcurve |
|---|---|---|---|---|---|---|---|
| A | 7474 | 7474 | 14 | 14 | 0.19% | 0.19% | 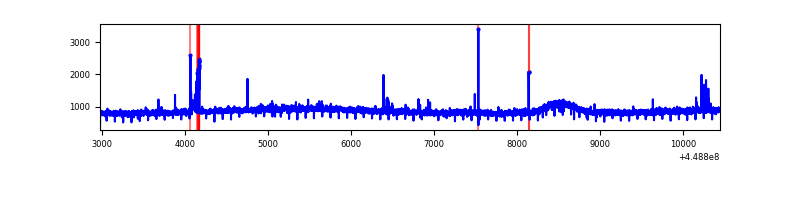 |
| B | 7473 | 7473 | 4253 | 4253 | 56.91% | 56.91% |  |
| C | 7474 | 7474 | 0 | 0 | 0.00% | 0.00% | 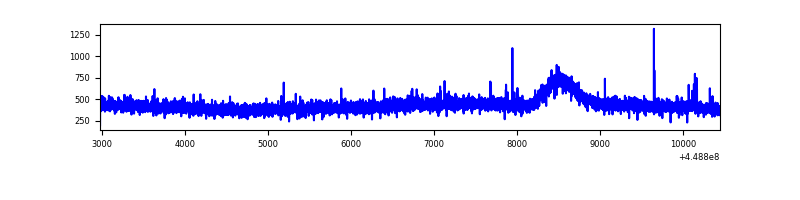 |
| D | 7475 | 7475 | 569 | 569 | 7.61% | 7.61% | 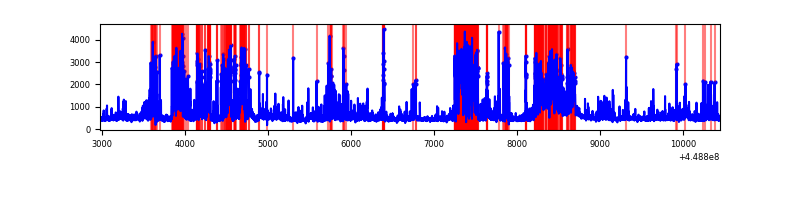 |
Top three noisy pixels from each quadrant. If the there are fewer than three noisy pixels in the level2.evt file, extra rows are filled as -1
| Pixel properties | Quadrant properties | ||||||
|---|---|---|---|---|---|---|---|
| Quadrant | DetID | PixID | Counts | Sigma | Mean | Median | Sigma |
| A | 10 | 83 | 3113626 | 17805.94 | 836 | 817 | 174.8 |
| A | 0 | 247 | 60265 | 340.06 | 836 | 817 | 174.8 |
| A | 14 | 235 | 17280 | 94.17 | 836 | 817 | 174.8 |
| B | 3 | 112 | 12966871 | 110610.82 | 590 | 571 | 117.2 |
| B | 4 | 171 | 119791 | 1017.02 | 590 | 571 | 117.2 |
| B | 0 | 183 | 52896 | 446.37 | 590 | 571 | 117.2 |
| C | 12 | 2 | 11334 | 54.09 | 823 | 826 | 194.3 |
| C | 3 | 233 | 10408 | 49.32 | 823 | 826 | 194.3 |
| C | 13 | 61 | 5669 | 24.93 | 823 | 826 | 194.3 |
| D | 2 | 249 | 1067048 | 5310.7 | 791 | 765 | 200.8 |
| D | 13 | 249 | 598745 | 2978.28 | 791 | 765 | 200.8 |
| D | 1 | 52 | 362735 | 1802.82 | 791 | 765 | 200.8 |
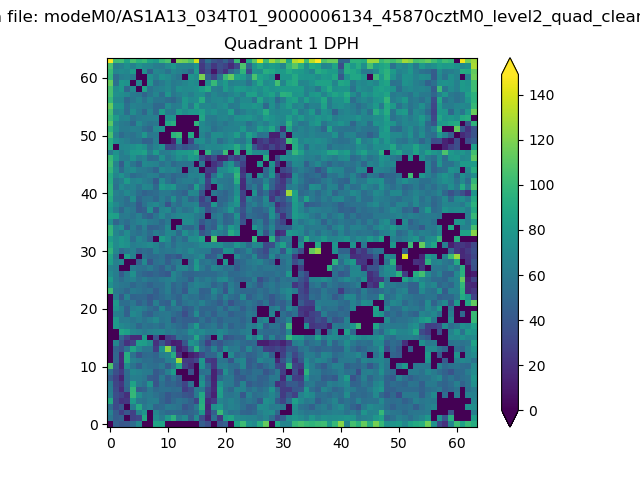
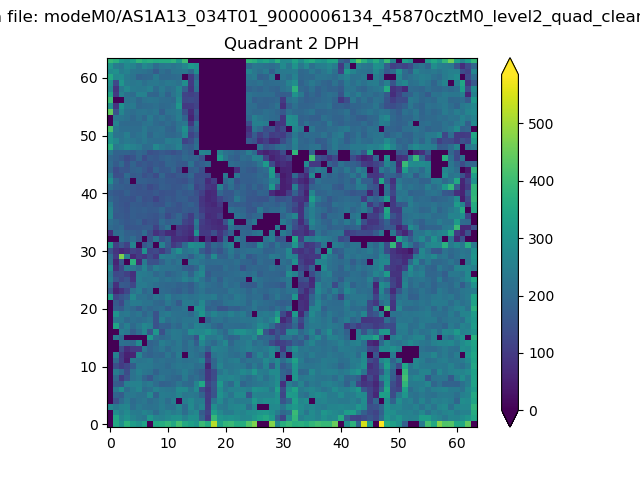
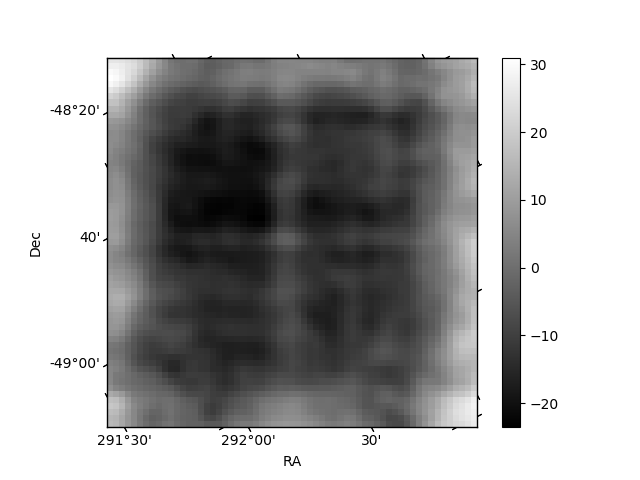
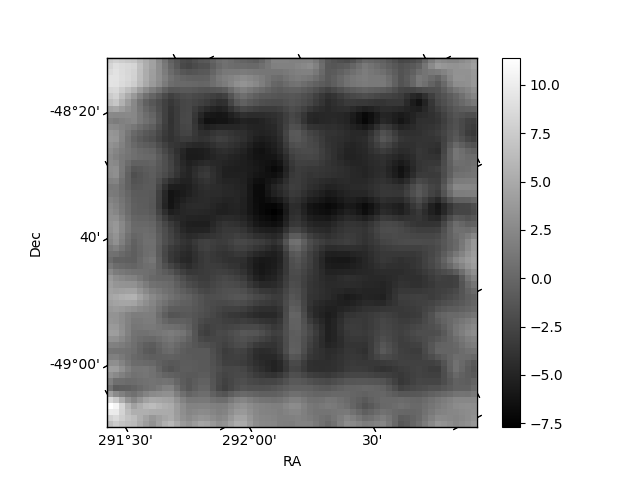
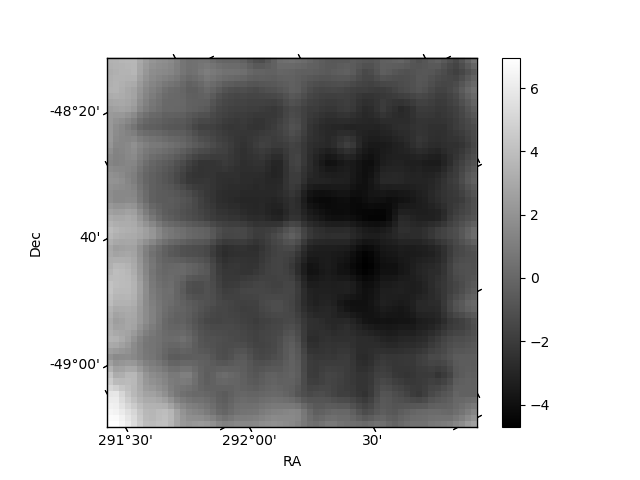
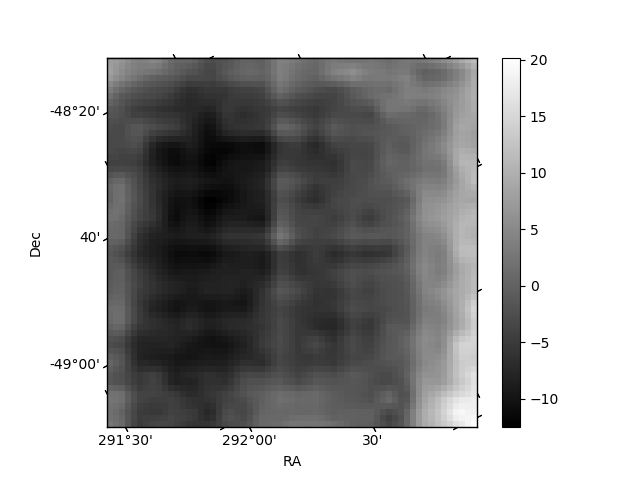
Histogram calculated using DETX and DETY for each event in the final _common_clean file
| Quadrant A | 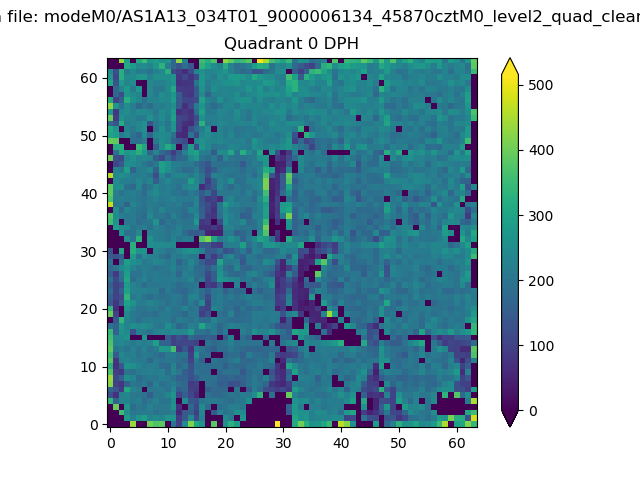 |
 |
Quadrant B |
|---|---|---|---|
| Quadrant D | 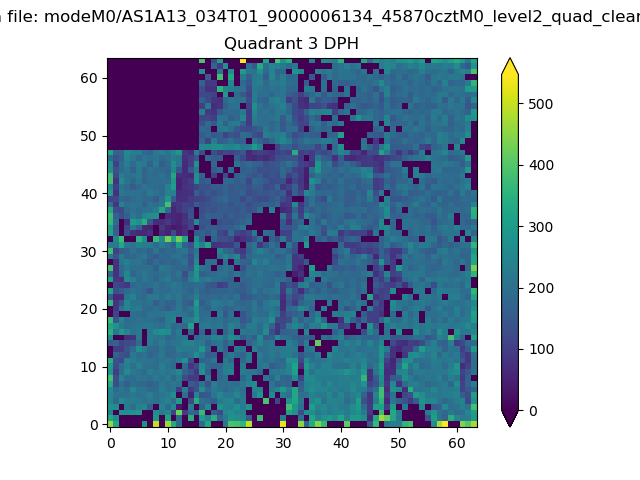 |
 |
Quadrant C |
| Plot type | Count rate plots | Images |
|---|---|---|
| Comparison with Poisson distribution Blue bars denote a histogram of data divided into 1 sec bins. Red curve is a Poisson curve with rate = median count rate of data. |
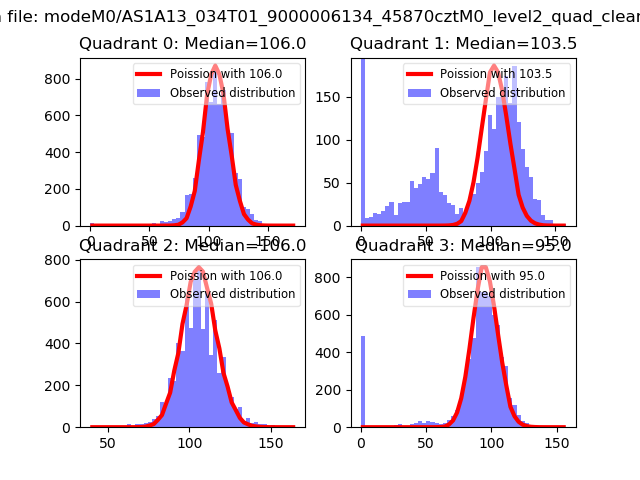 |
 |
| Quadrant-wise count rates Data is divided into 100 sec bins |
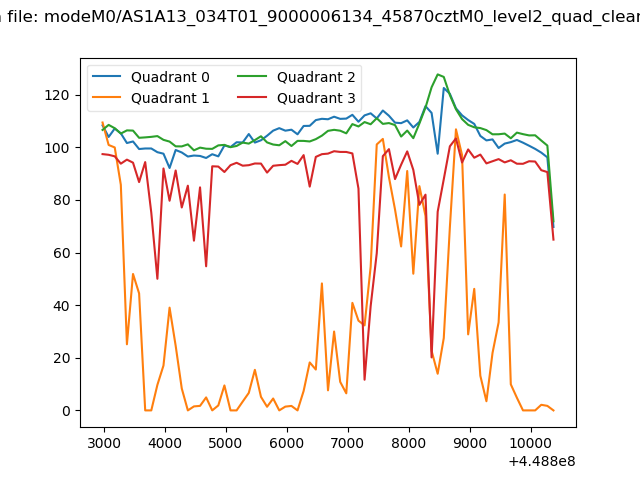 |
|
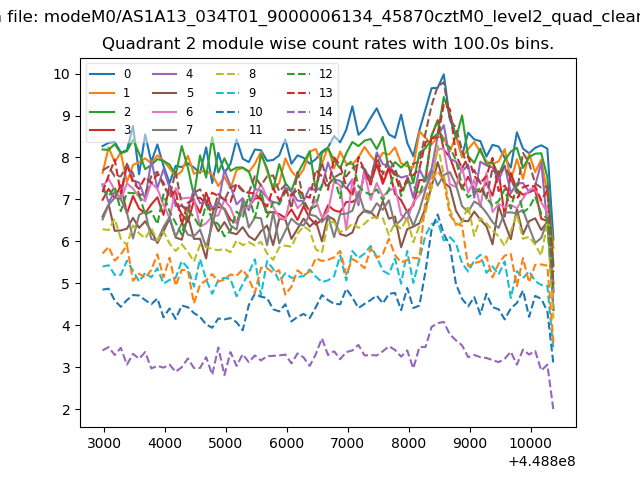
| Module-wise count rates for Quadrant A Data is divided into 100 sec bins |
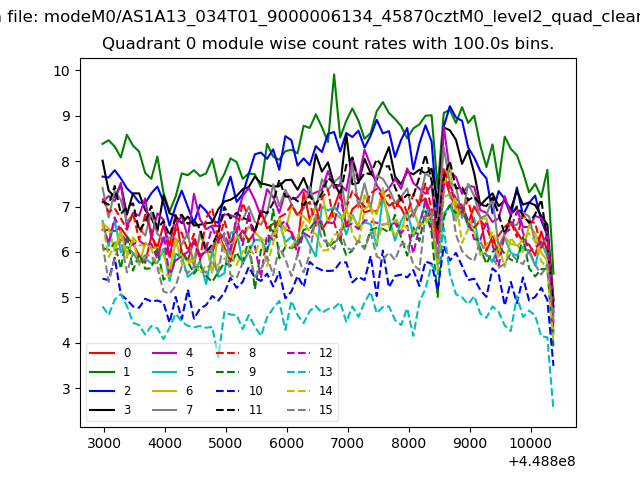 |
 |
| Module-wise count rates for Quadrant B Data is divided into 100 sec bins |
 |
 |
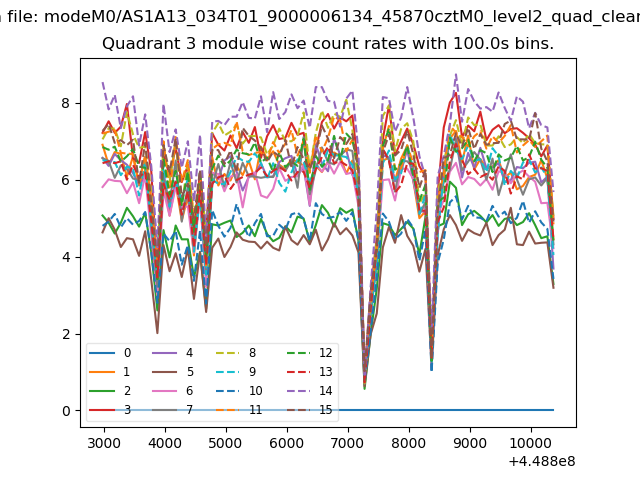
| Module-wise count rates for Quadrant C Data is divided into 100 sec bins |
 |
 |
| Module-wise count rates for Quadrant D Data is divided into 100 sec bins |
 |
 |
| Parameter | Plot |
|---|---|
| CZT HV Monitor | 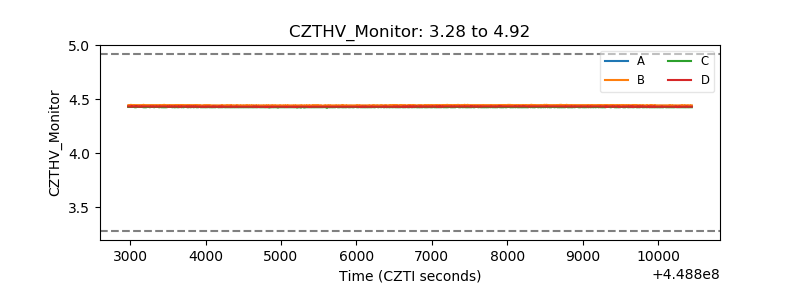 |
| D_VDD | 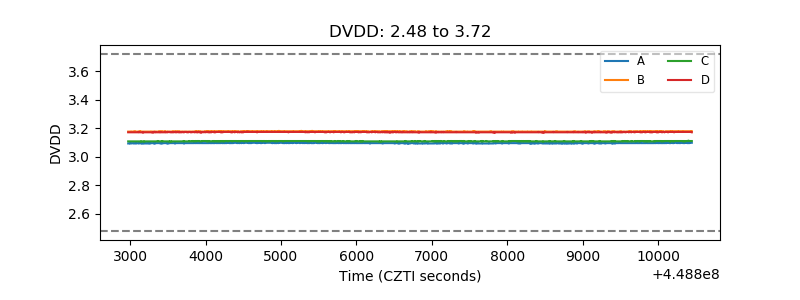 |
| Temperature 1 | 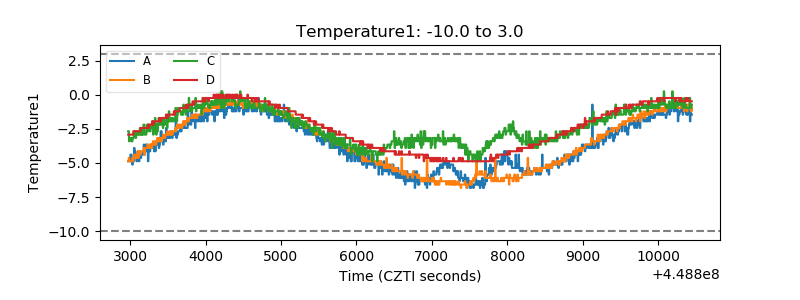 |
| Veto HV Monitor | 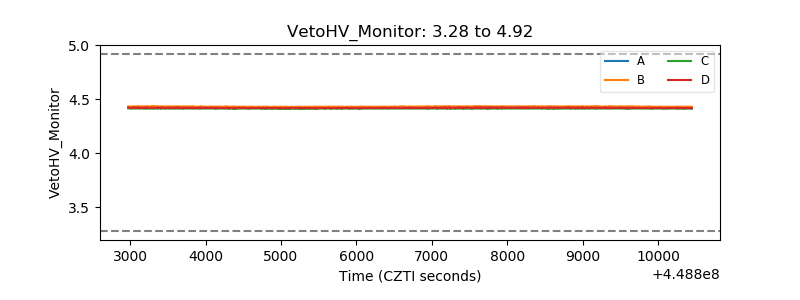 |
| Veto LLD | 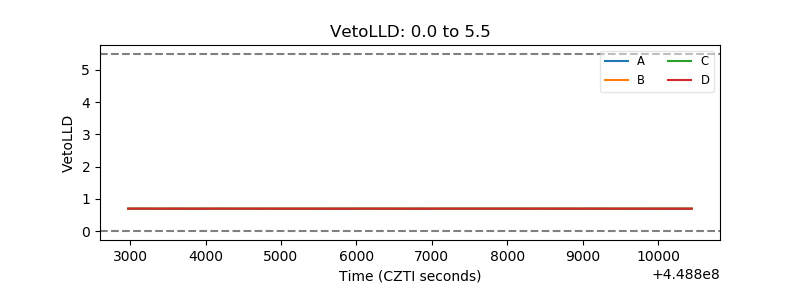 |
| Alpha Counter | 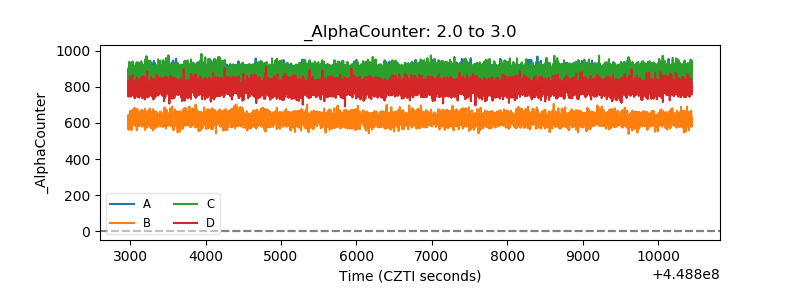 |
| _CPM_Rate | 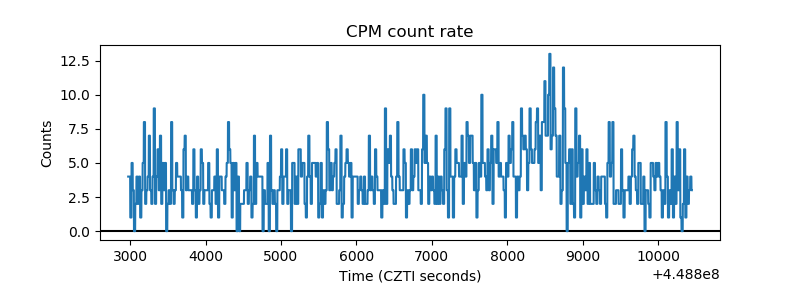 |
| CZT Counter | 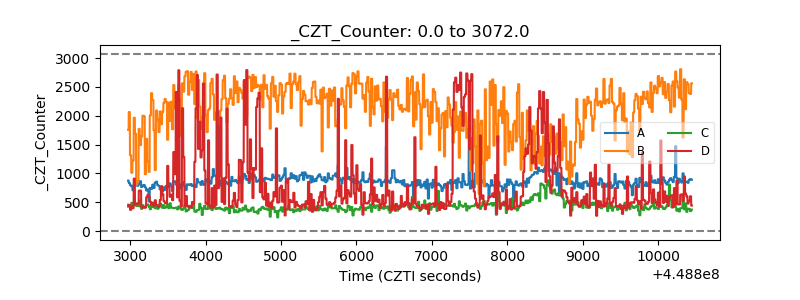 |
| +2.5 Volts monitor | 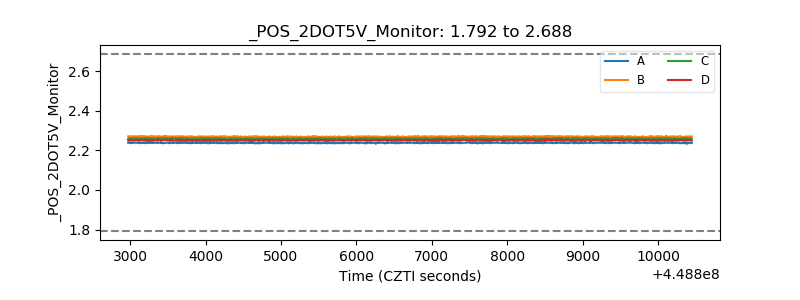 |
| +5 Volts monitor | 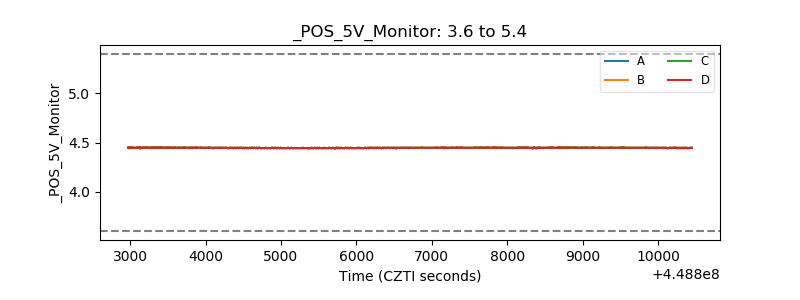 |
| _ROLL_ROT | 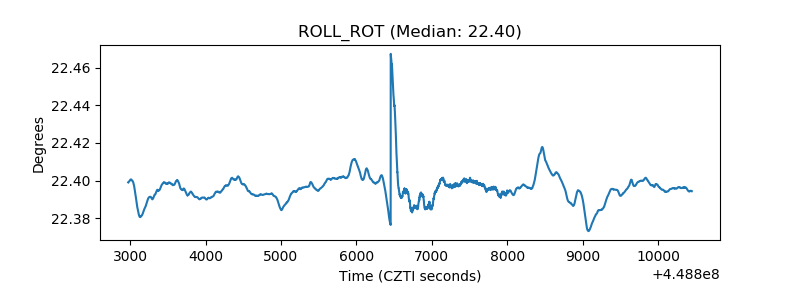 |
| _Roll_DEC | 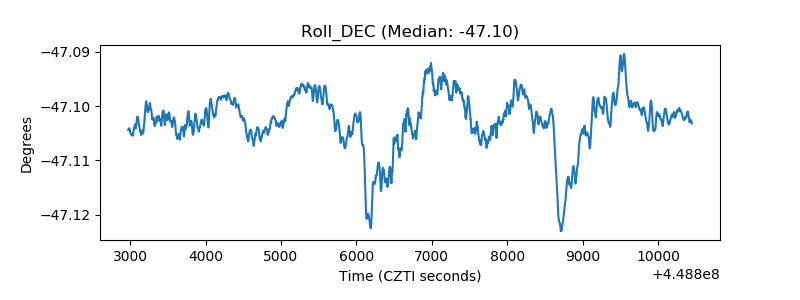 |
| _Roll_RA | 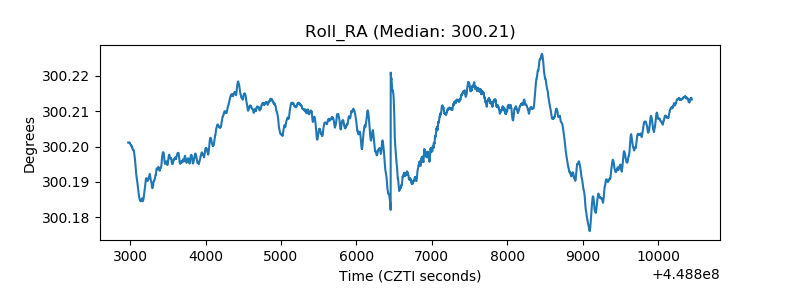 |
| Veto Counter | 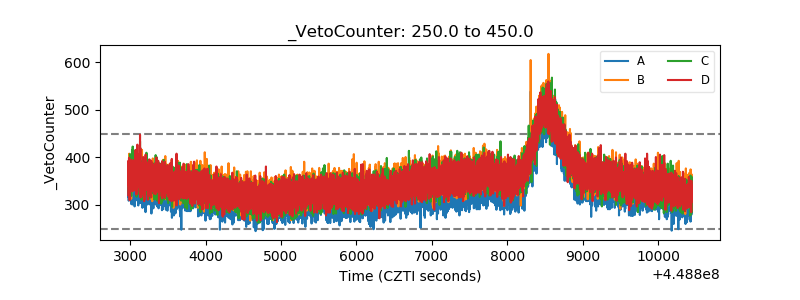 |