| Param | Original file | Final file |
|---|---|---|
| Filename | modeM0/AS1A13_034T01_9000006134_45871cztM0_level2.fits | modeM0/AS1A13_034T01_9000006134_45871cztM0_level2_quad_clean.evt |
| Size (bytes) | 706,291,200 | 107,536,320 |
| Size | 673.6 MB | 102.6 MB |
| Events in quadrant A | 6,456,060 | 763,663 |
| Events in quadrant B | 10,863,437 | 521,594 |
| Events in quadrant C | 3,194,678 | 770,363 |
| Events in quadrant D | 5,063,625 | 690,889 |
| Mode SS | |||
|---|---|---|---|
| Quadrant | BADHDUFLAG | Total packets | Discarded packets |
| A | 0 | 146 | 0 |
| B | 0 | 146 | 0 |
| C | 0 | 146 | 0 |
| D | 0 | 146 | 0 |
| Mode M0 | |||
|---|---|---|---|
| Quadrant | BADHDUFLAG | Total packets | Discarded packets |
| A | 0 | 23706 | 0 |
| B | 0 | 37304 | 0 |
| C | 0 | 15086 | 0 |
| D | 0 | 20054 | 0 |
| Quadrant | Total seconds | Saturated seconds | Saturation percentage |
|---|---|---|---|
| A | 7315 | 182 | 2.488038% |
| B | 7315 | 2968 | 40.574163% |
| C | 7315 | 12 | 0.164046% |
| D | 7316 | 279 | 3.813559% |
Noise dominated data is calculated using 1-second bins in cleaned event files. If a bin has >2000 counts, and if more than 50% of those come from <1% of pixels, then it is considered to be noise-dominated and hence unusable.
| Quadrant | # 1 sec bins | Bins with >0 counts | Bins with >2000 counts | High rate bins dominated by noise | Noise dominated (total time) | Noise dominated (detector-on time) | Marked lightcurve |
|---|---|---|---|---|---|---|---|
| A | 7315 | 7315 | 5 | 5 | 0.07% | 0.07% | 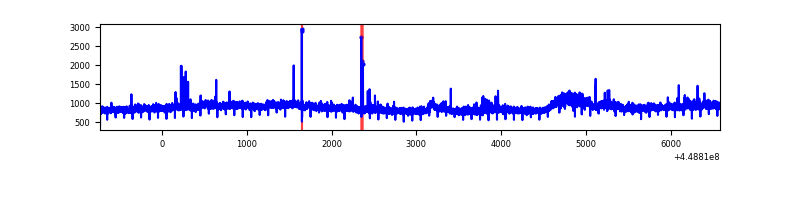 |
| B | 7315 | 7315 | 2059 | 2059 | 28.15% | 28.15% | 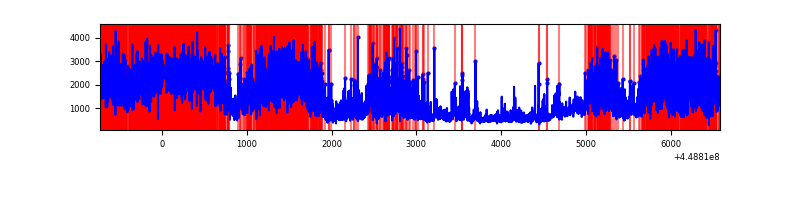 |
| C | 7315 | 7315 | 1 | 1 | 0.01% | 0.01% | 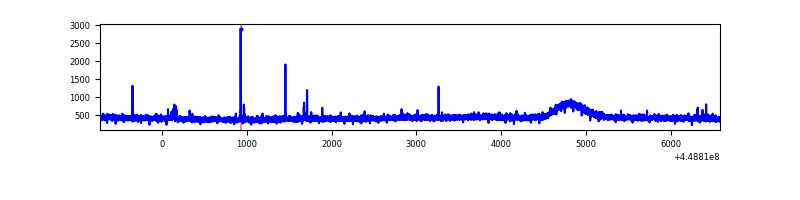 |
| D | 7316 | 7316 | 219 | 219 | 2.99% | 2.99% | 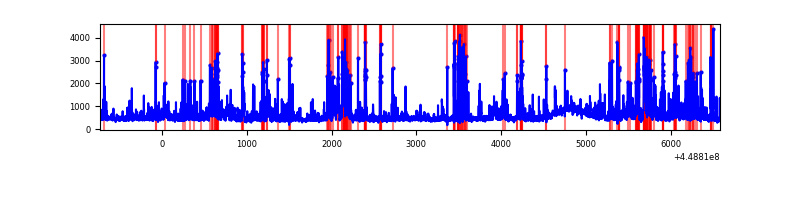 |
Top three noisy pixels from each quadrant. If the there are fewer than three noisy pixels in the level2.evt file, extra rows are filled as -1
| Pixel properties | Quadrant properties | ||||||
|---|---|---|---|---|---|---|---|
| Quadrant | DetID | PixID | Counts | Sigma | Mean | Median | Sigma |
| A | 10 | 83 | 3083283 | 17653.38 | 827 | 807 | 174.6 |
| A | 0 | 247 | 116362 | 661.78 | 827 | 807 | 174.6 |
| A | 14 | 235 | 22995 | 127.07 | 827 | 807 | 174.6 |
| B | 3 | 112 | 7522951 | 53528.04 | 706 | 686 | 140.5 |
| B | 4 | 171 | 326949 | 2321.67 | 706 | 686 | 140.5 |
| B | 0 | 183 | 51770 | 363.51 | 706 | 686 | 140.5 |
| C | 12 | 2 | 29060 | 147.29 | 811 | 814 | 191.8 |
| C | 13 | 61 | 5382 | 23.82 | 811 | 814 | 191.8 |
| C | 3 | 233 | 4107 | 17.17 | 811 | 814 | 191.8 |
| D | 1 | 52 | 635008 | 3115.98 | 807 | 780 | 203.5 |
| D | 13 | 249 | 478624 | 2347.66 | 807 | 780 | 203.5 |
| D | 12 | 2 | 280351 | 1373.54 | 807 | 780 | 203.5 |
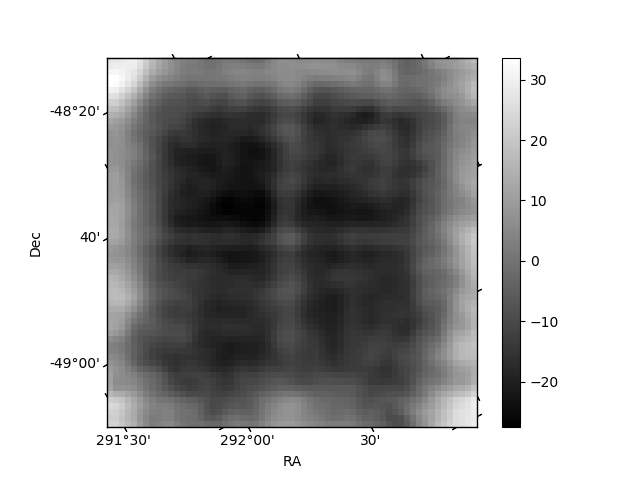
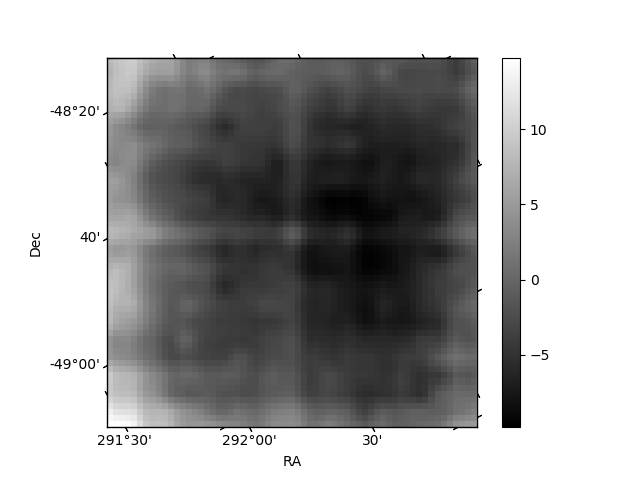
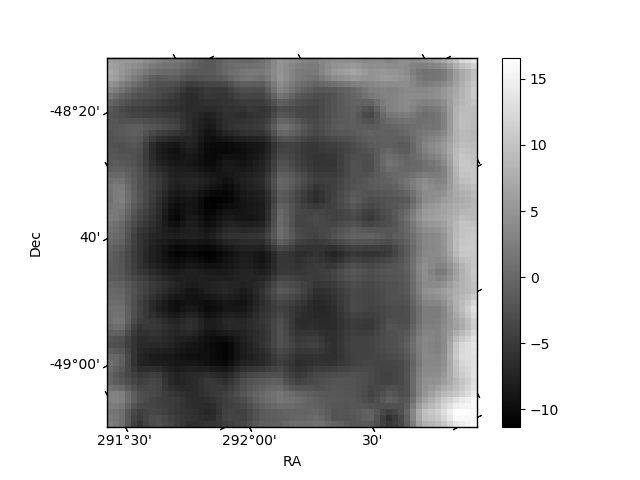
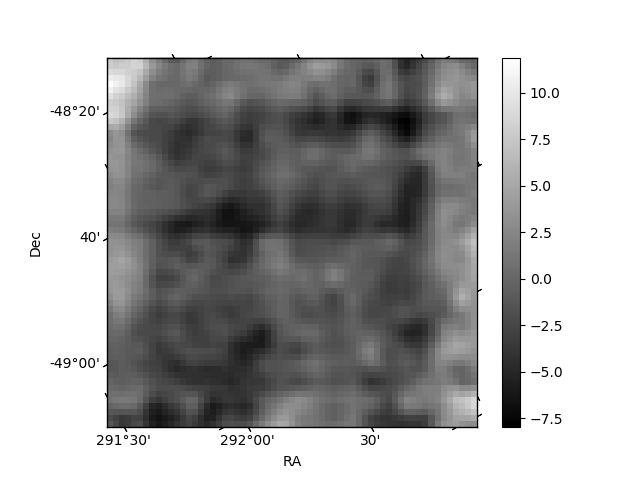
Histogram calculated using DETX and DETY for each event in the final _common_clean file
| Quadrant A | 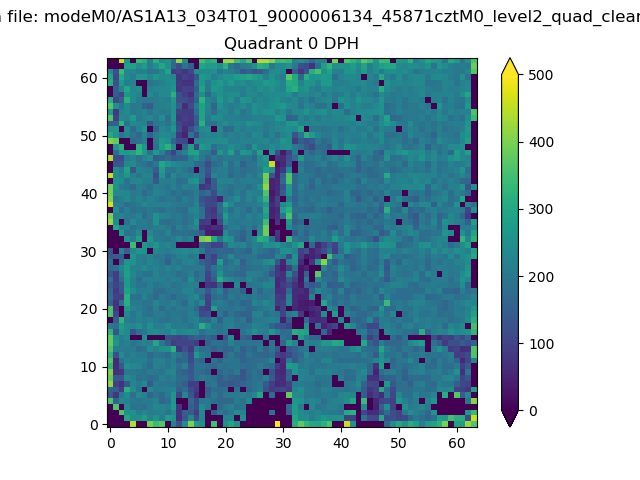 |
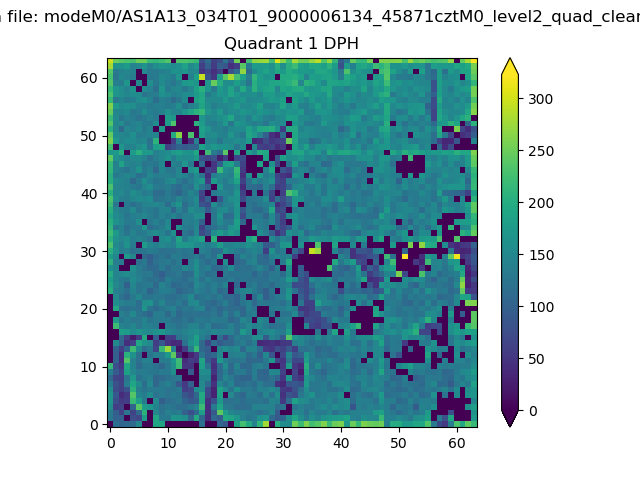 |
Quadrant B |
|---|---|---|---|
| Quadrant D | 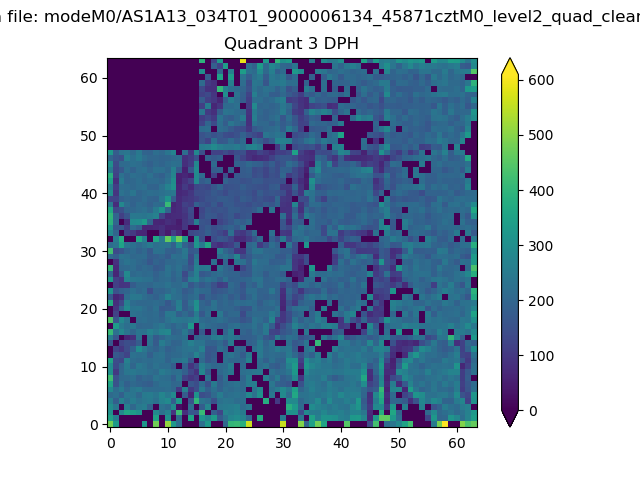 |
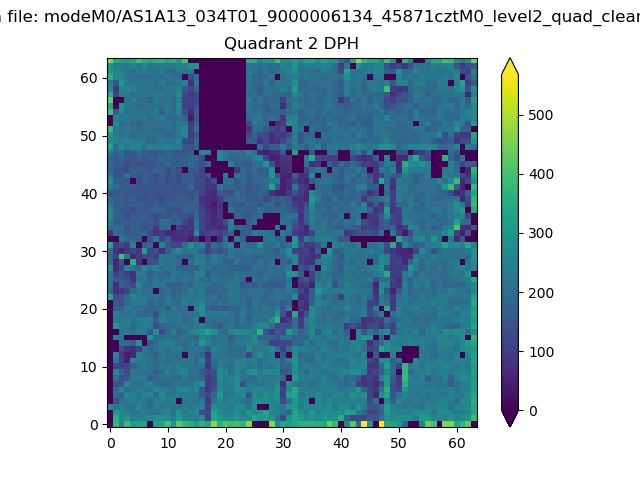 |
Quadrant C |
| Plot type | Count rate plots | Images |
|---|---|---|
| Comparison with Poisson distribution Blue bars denote a histogram of data divided into 1 sec bins. Red curve is a Poisson curve with rate = median count rate of data. |
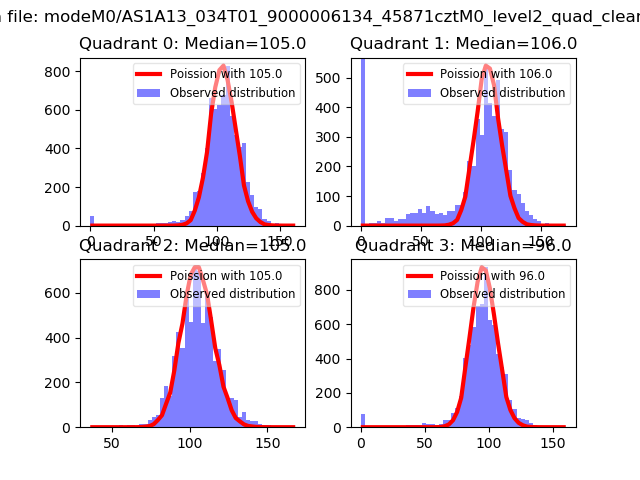 |
 |
| Quadrant-wise count rates Data is divided into 100 sec bins |
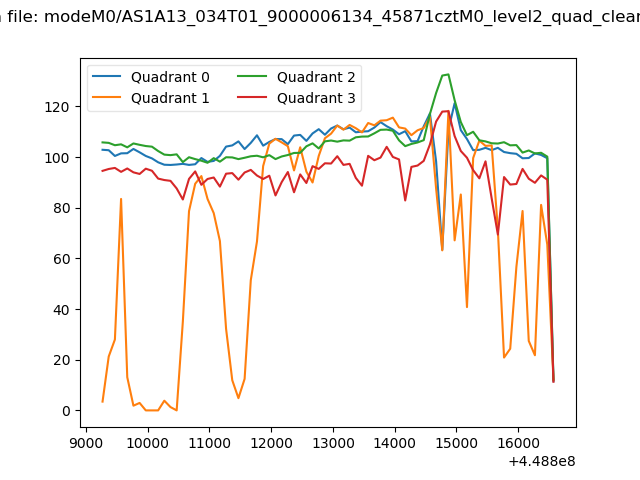 |
|
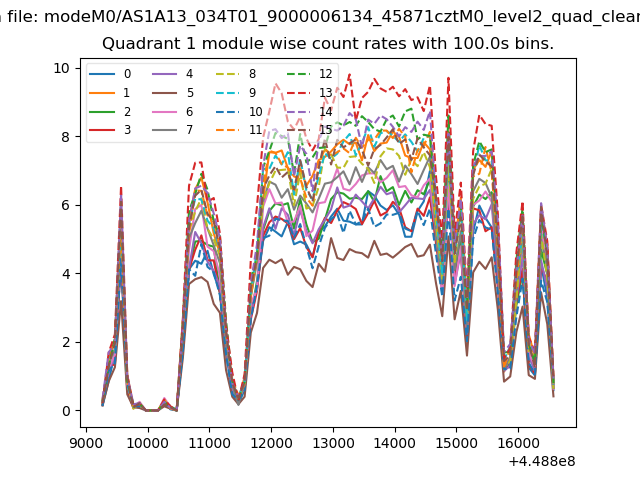
| Module-wise count rates for Quadrant A Data is divided into 100 sec bins |
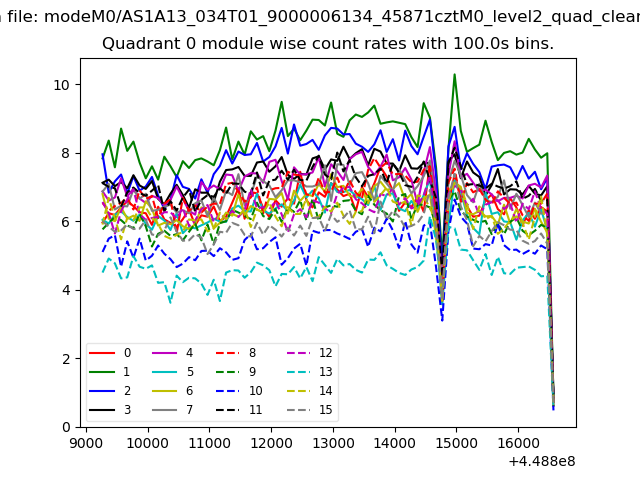 |
 |
| Module-wise count rates for Quadrant B Data is divided into 100 sec bins |
 |
 |
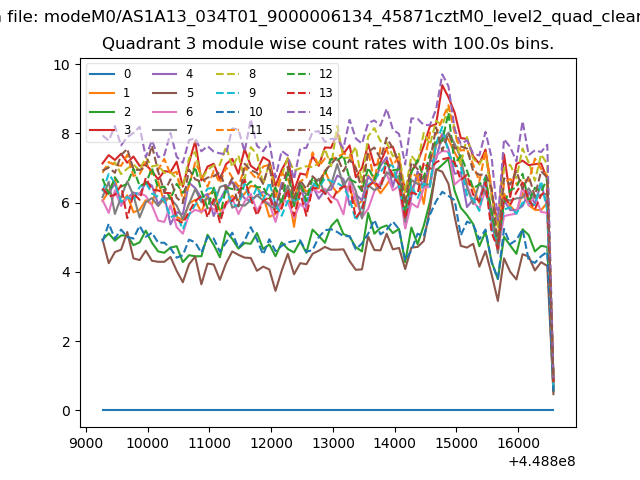
| Module-wise count rates for Quadrant C Data is divided into 100 sec bins |
 |
 |
| Module-wise count rates for Quadrant D Data is divided into 100 sec bins |
 |
 |
| Parameter | Plot |
|---|---|
| CZT HV Monitor |  |
| D_VDD | 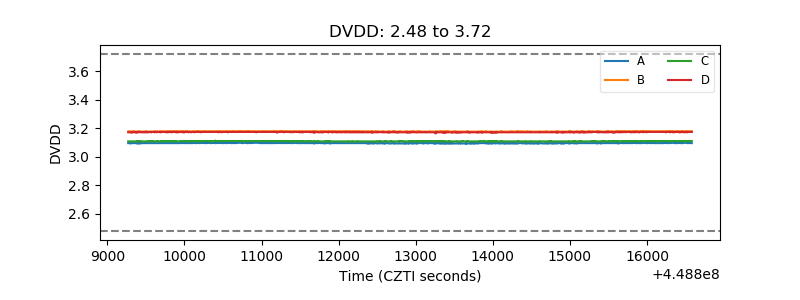 |
| Temperature 1 | 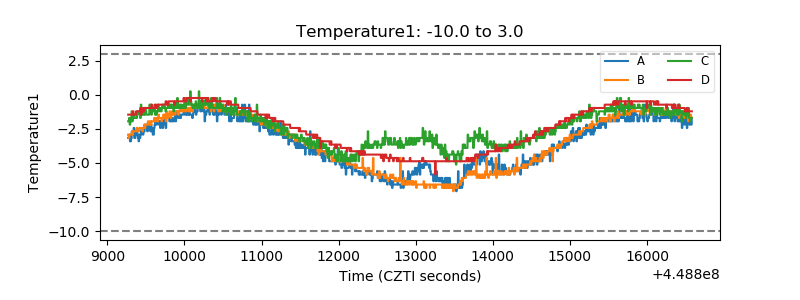 |
| Veto HV Monitor | 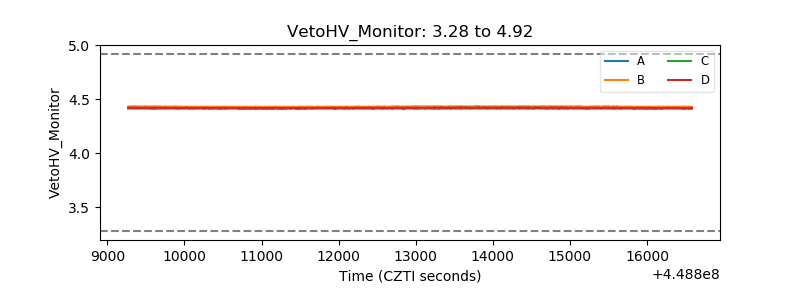 |
| Veto LLD | 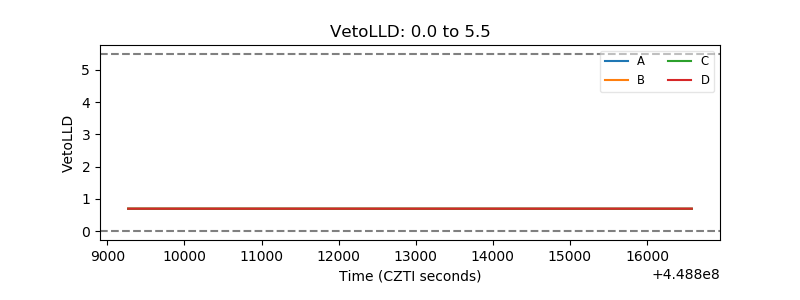 |
| Alpha Counter | 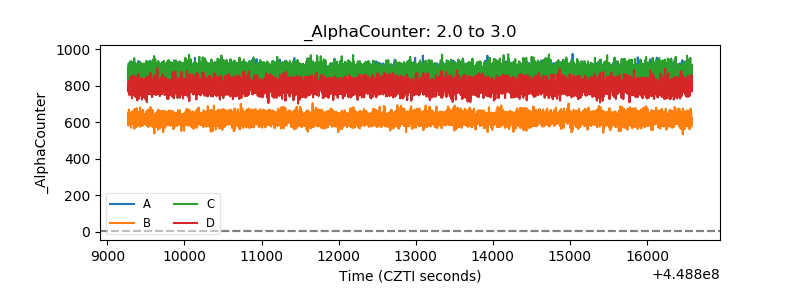 |
| _CPM_Rate | 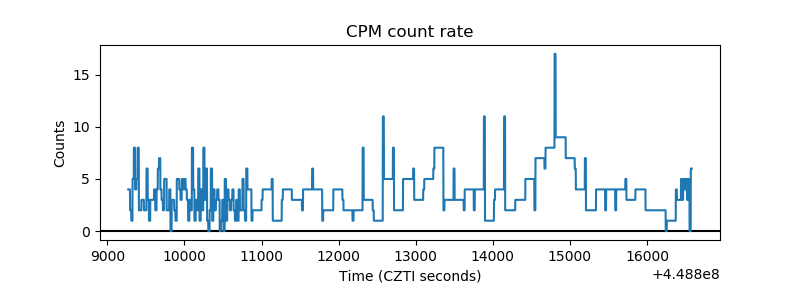 |
| CZT Counter | 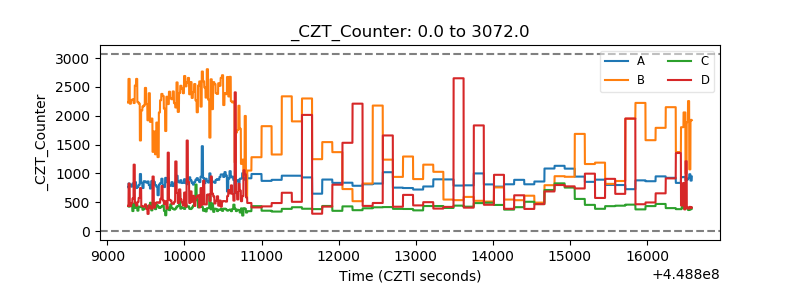 |
| +2.5 Volts monitor | 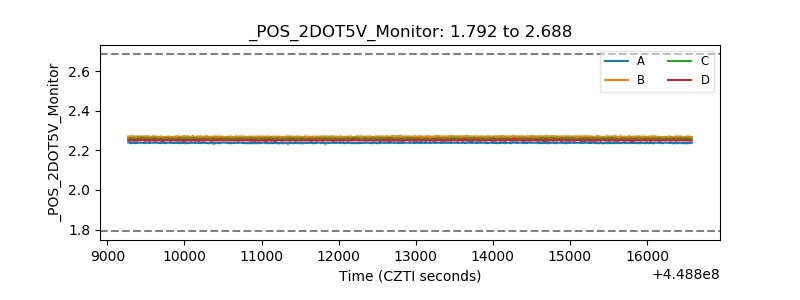 |
| +5 Volts monitor | 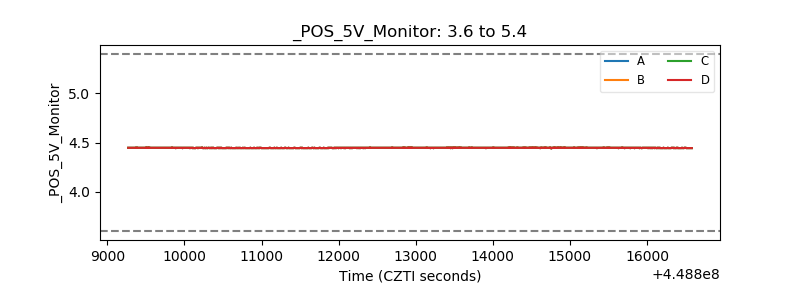 |
| _ROLL_ROT | 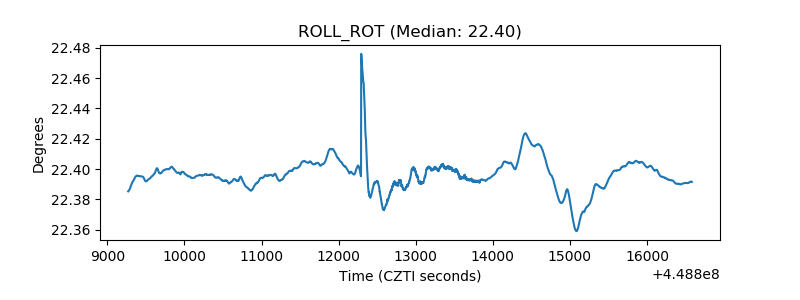 |
| _Roll_DEC | 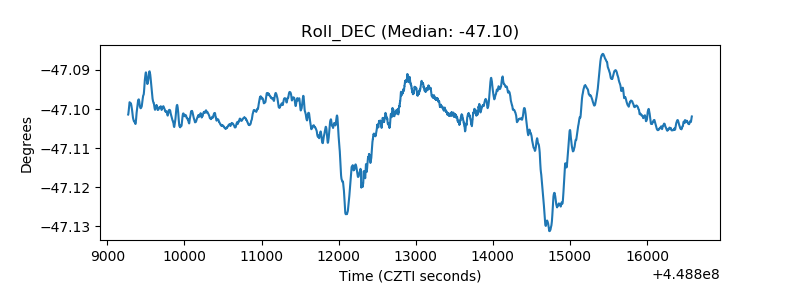 |
| _Roll_RA | 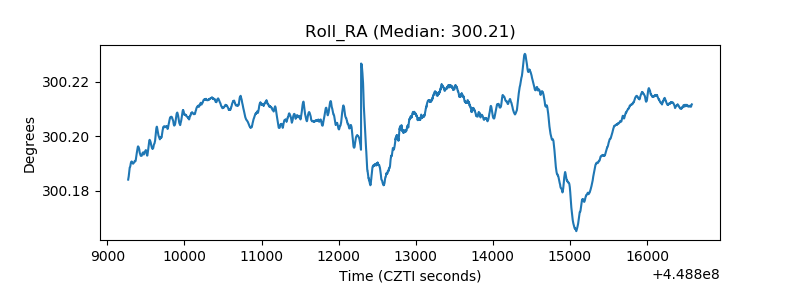 |
| Veto Counter | 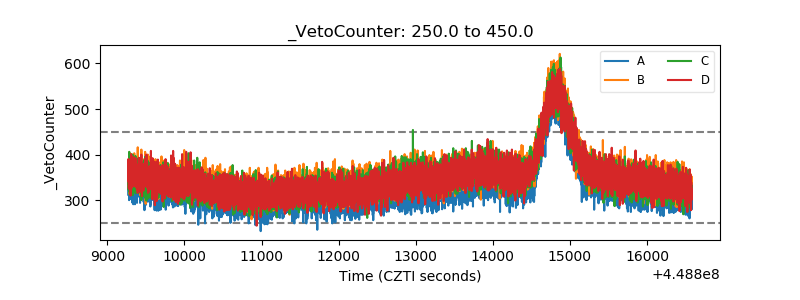 |