| Param | Original file | Final file |
|---|---|---|
| Filename | modeM0/AS1A13_034T01_9000006134_45874cztM0_level2.fits | modeM0/AS1A13_034T01_9000006134_45874cztM0_level2_quad_clean.evt |
| Size (bytes) | 1,219,011,840 | 207,789,120 |
| Size | 1.1 GB | 198.2 MB |
| Events in quadrant A | 12,077,273 | 1,432,089 |
| Events in quadrant B | 16,828,857 | 1,189,381 |
| Events in quadrant C | 5,947,786 | 1,429,296 |
| Events in quadrant D | 9,201,304 | 1,284,099 |
| Mode SS | |||
|---|---|---|---|
| Quadrant | BADHDUFLAG | Total packets | Discarded packets |
| A | 0 | 280 | 0 |
| B | 0 | 280 | 0 |
| C | 0 | 280 | 0 |
| D | 0 | 280 | 0 |
| Mode M0 | |||
|---|---|---|---|
| Quadrant | BADHDUFLAG | Total packets | Discarded packets |
| A | 0 | 44549 | 2 |
| B | 0 | 59553 | 2 |
| C | 0 | 28346 | 2 |
| D | 0 | 36822 | 2 |
| Mode M9 | |||
|---|---|---|---|
| Quadrant | BADHDUFLAG | Total packets | Discarded packets |
| A | 0 | 8 | 0 |
| B | 0 | 8 | 0 |
| C | 0 | 8 | 0 |
| D | 0 | 8 | 0 |
| Quadrant | Total seconds | Saturated seconds | Saturation percentage |
|---|---|---|---|
| A | 13839 | 338 | 2.442373% |
| B | 13839 | 3274 | 23.657779% |
| C | 13839 | 64 | 0.462461% |
| D | 13840 | 428 | 3.092486% |
Noise dominated data is calculated using 1-second bins in cleaned event files. If a bin has >2000 counts, and if more than 50% of those come from <1% of pixels, then it is considered to be noise-dominated and hence unusable.
| Quadrant | # 1 sec bins | Bins with >0 counts | Bins with >2000 counts | High rate bins dominated by noise | Noise dominated (total time) | Noise dominated (detector-on time) | Marked lightcurve |
|---|---|---|---|---|---|---|---|
| A | 14649 | 13841 | 7 | 7 | 0.05% | 0.05% | 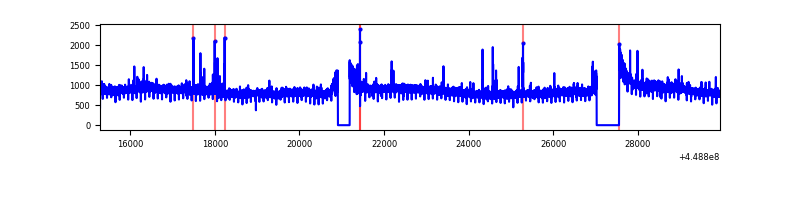 |
| B | 14649 | 13840 | 2145 | 2145 | 14.64% | 15.50% |  |
| C | 14649 | 13841 | 10 | 10 | 0.07% | 0.07% | 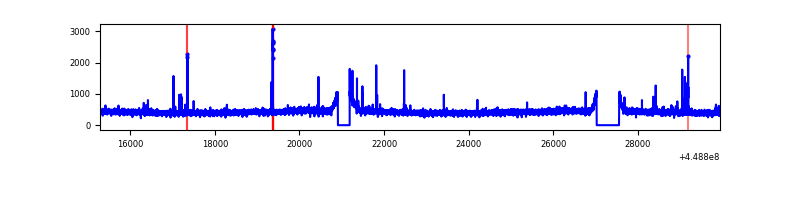 |
| D | 14650 | 13842 | 319 | 319 | 2.18% | 2.30% | 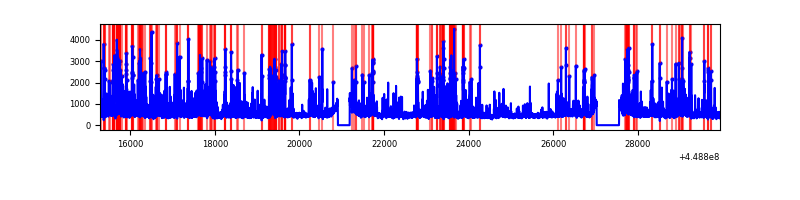 |
Top three noisy pixels from each quadrant. If the there are fewer than three noisy pixels in the level2.evt file, extra rows are filled as -1
| Pixel properties | Quadrant properties | ||||||
|---|---|---|---|---|---|---|---|
| Quadrant | DetID | PixID | Counts | Sigma | Mean | Median | Sigma |
| A | 10 | 83 | 5968639 | 18944.99 | 1526 | 1489 | 315.0 |
| A | 0 | 247 | 47421 | 145.83 | 1526 | 1489 | 315.0 |
| A | 7 | 3 | 32286 | 97.78 | 1526 | 1489 | 315.0 |
| B | 3 | 112 | 10444319 | 37672.91 | 1406 | 1361 | 277.2 |
| B | 4 | 171 | 388259 | 1395.73 | 1406 | 1361 | 277.2 |
| B | 5 | 172 | 112347 | 400.38 | 1406 | 1361 | 277.2 |
| C | 12 | 2 | 83115 | 231.84 | 1499 | 1505 | 352.0 |
| C | 3 | 233 | 13279 | 33.45 | 1499 | 1505 | 352.0 |
| C | 13 | 61 | 9891 | 23.82 | 1499 | 1505 | 352.0 |
| D | 1 | 52 | 1496502 | 3943.85 | 1495 | 1444 | 379.1 |
| D | 13 | 249 | 458403 | 1205.42 | 1495 | 1444 | 379.1 |
| D | 5 | 171 | 377801 | 992.8 | 1495 | 1444 | 379.1 |
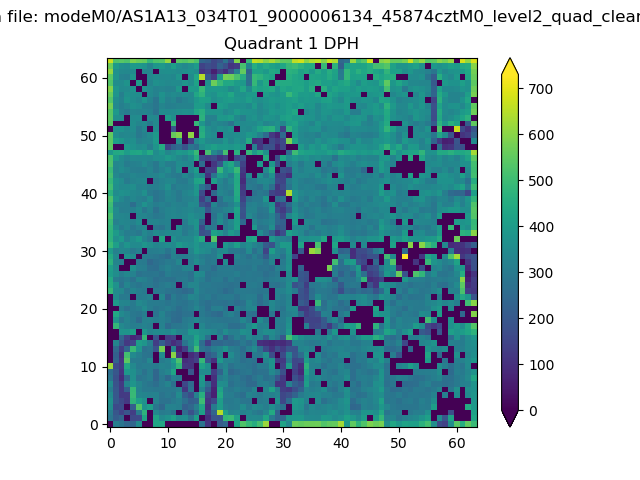
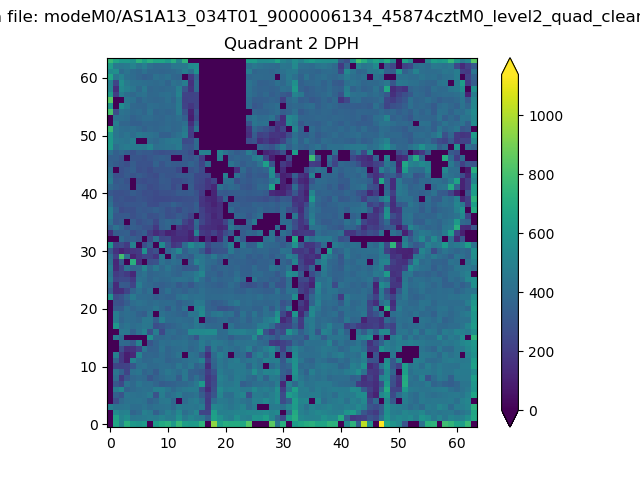
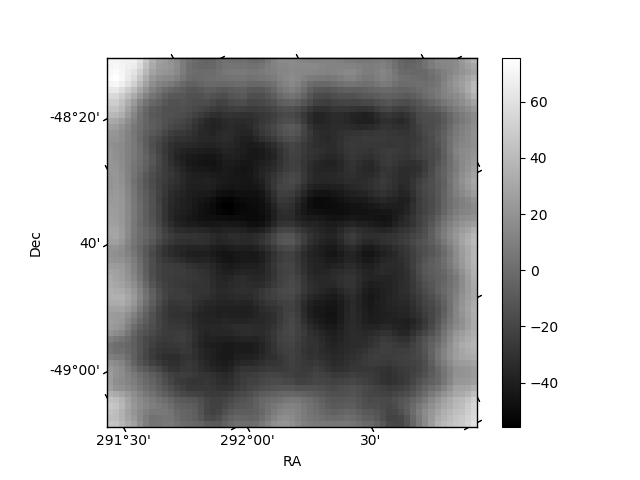
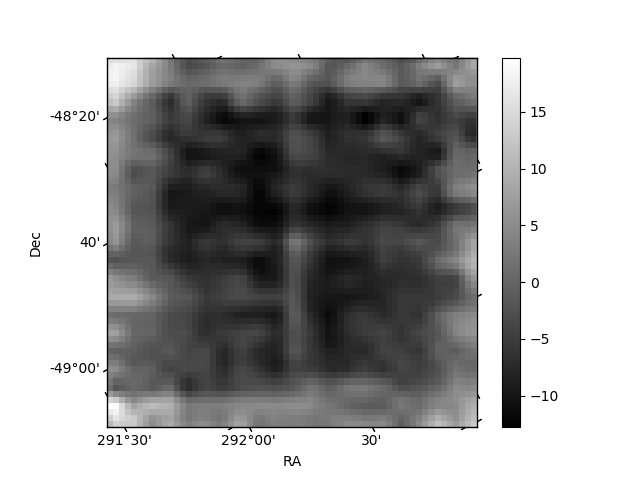
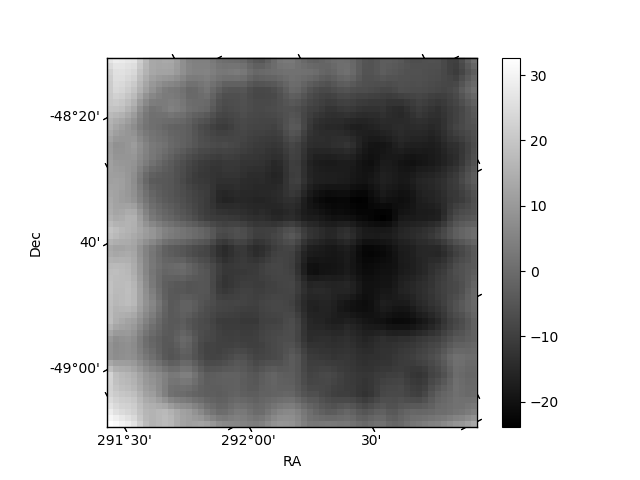
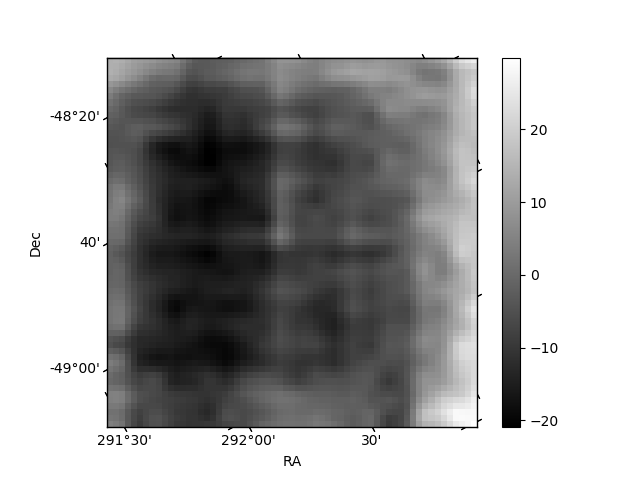
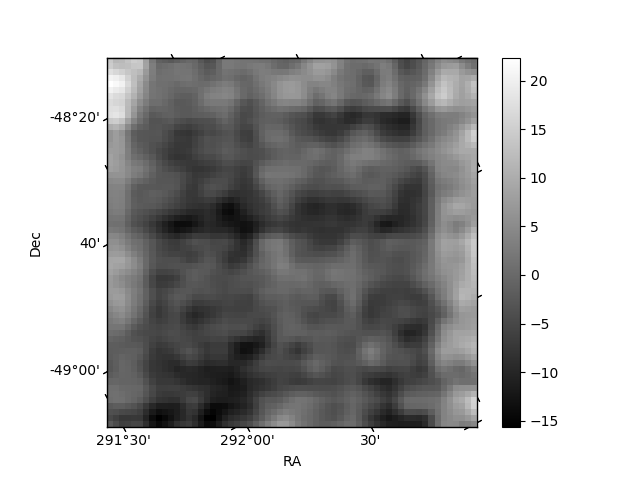
Histogram calculated using DETX and DETY for each event in the final _common_clean file
| Quadrant A | 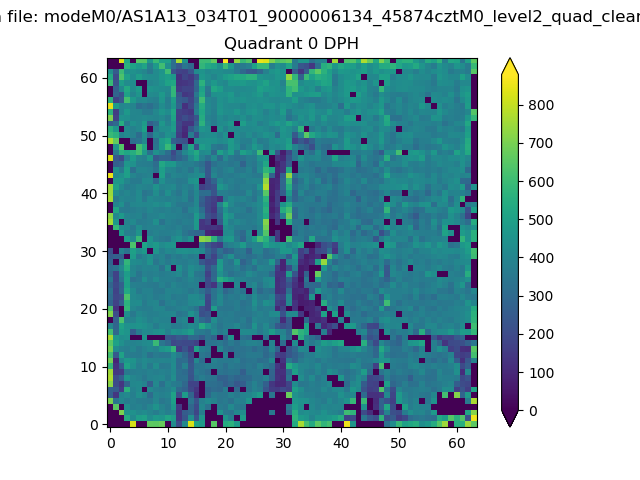 |
 |
Quadrant B |
|---|---|---|---|
| Quadrant D | 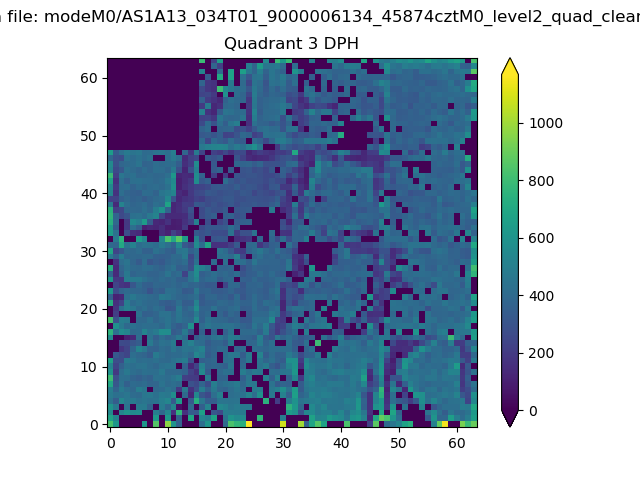 |
 |
Quadrant C |
| Plot type | Count rate plots | Images |
|---|---|---|
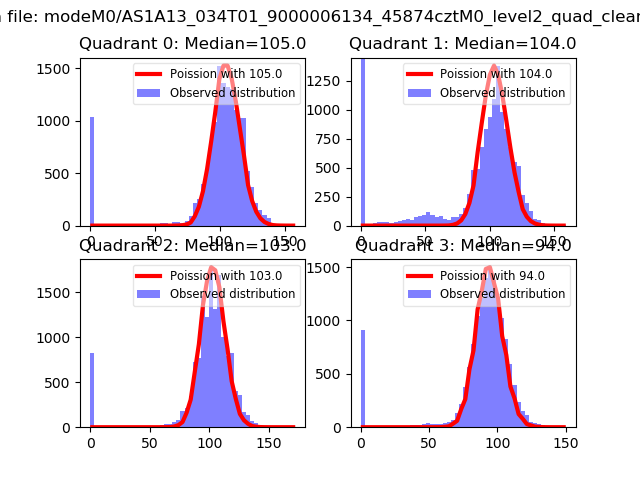
| Comparison with Poisson distribution Blue bars denote a histogram of data divided into 1 sec bins. Red curve is a Poisson curve with rate = median count rate of data. |
 |
 |
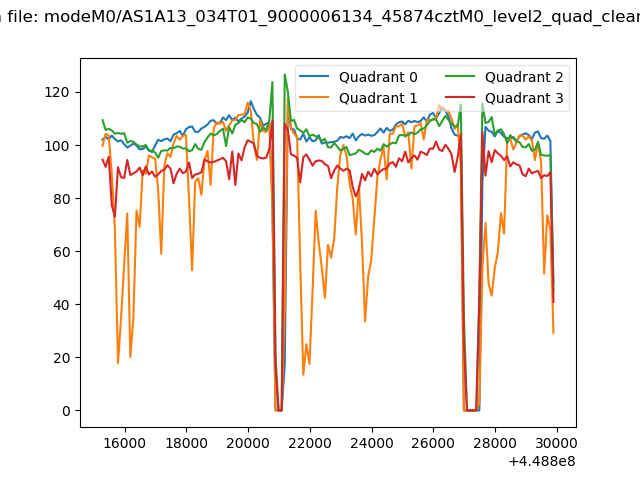
| Quadrant-wise count rates Data is divided into 100 sec bins |
 |
|
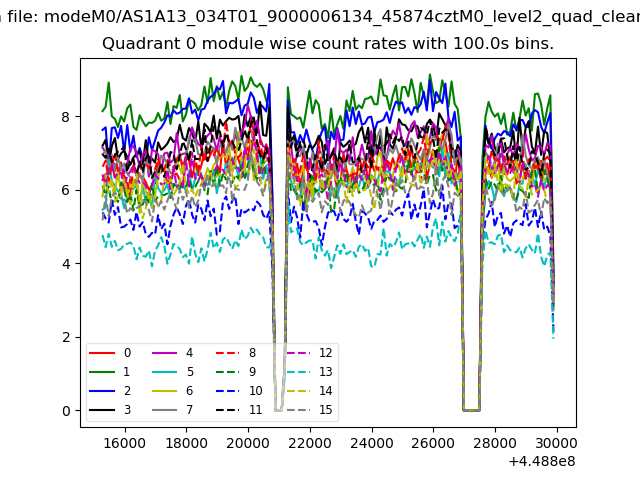
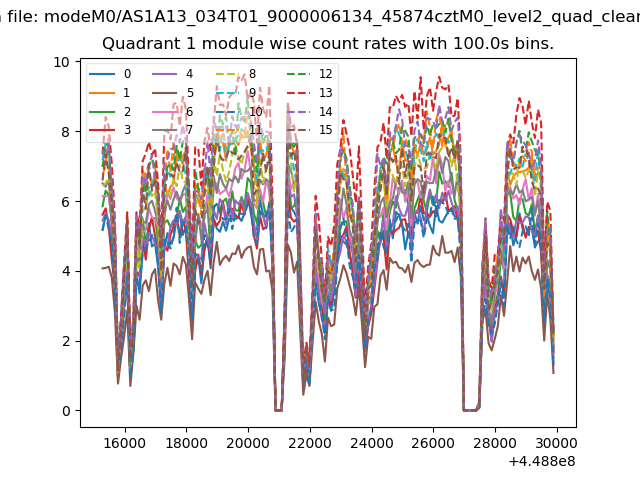
| Module-wise count rates for Quadrant A Data is divided into 100 sec bins |
 |
 |
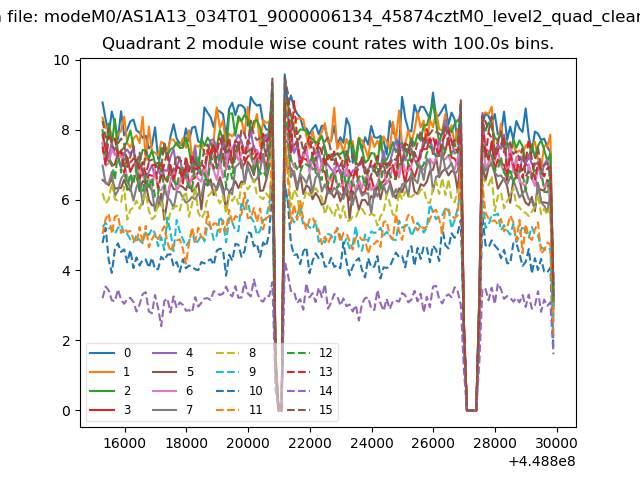
| Module-wise count rates for Quadrant B Data is divided into 100 sec bins |
 |
 |
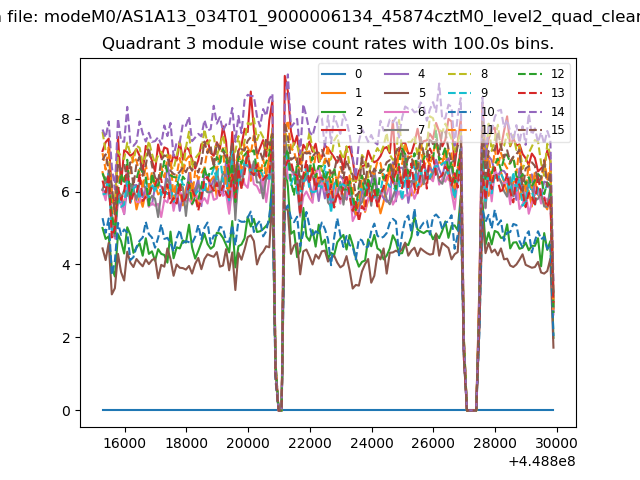
| Module-wise count rates for Quadrant C Data is divided into 100 sec bins |
 |
 |
| Module-wise count rates for Quadrant D Data is divided into 100 sec bins |
 |
 |
| Parameter | Plot |
|---|---|
| CZT HV Monitor | 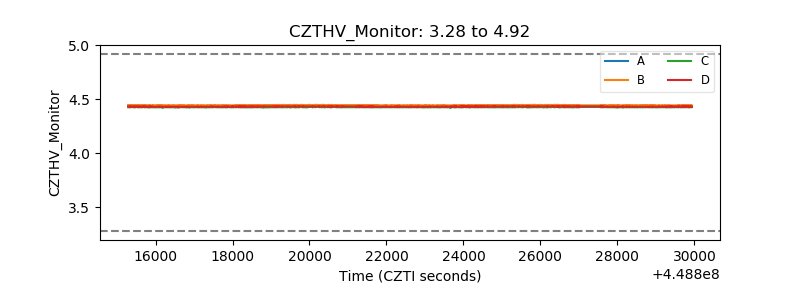 |
| D_VDD | 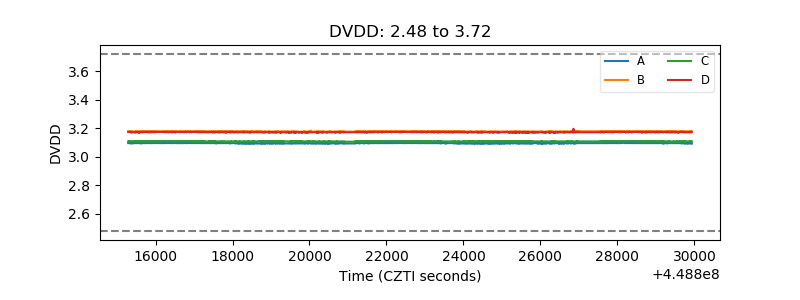 |
| Temperature 1 | 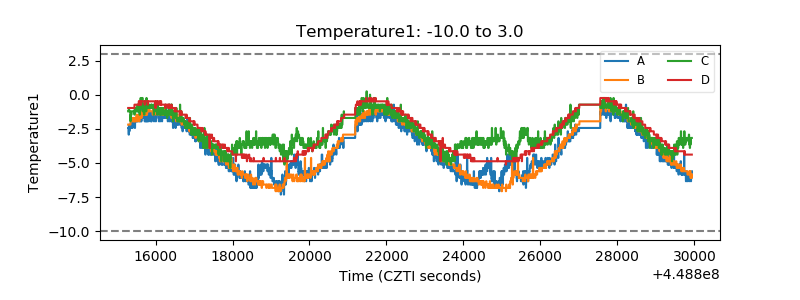 |
| Veto HV Monitor | 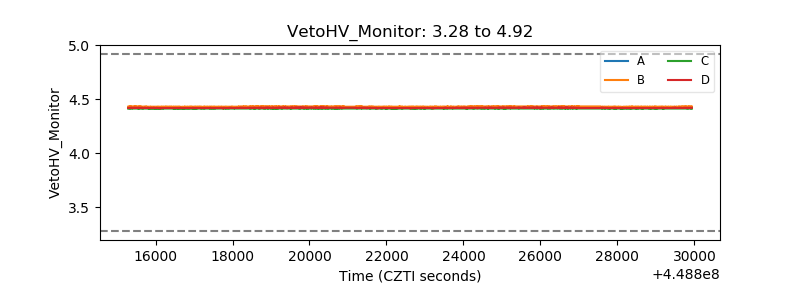 |
| Veto LLD | 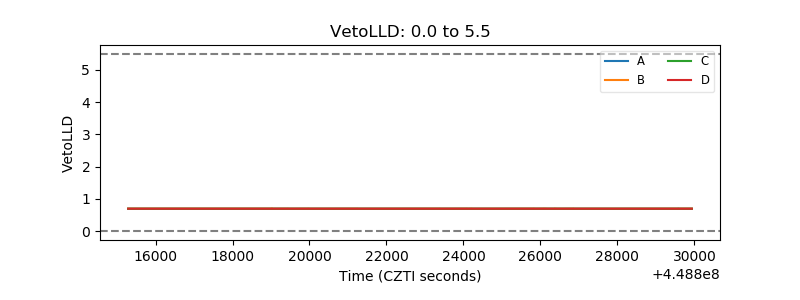 |
| Alpha Counter | 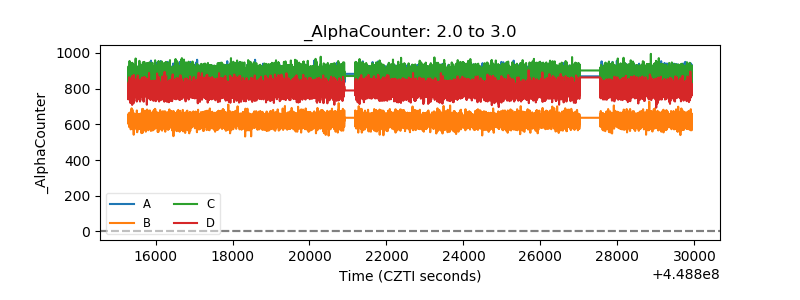 |
| _CPM_Rate | 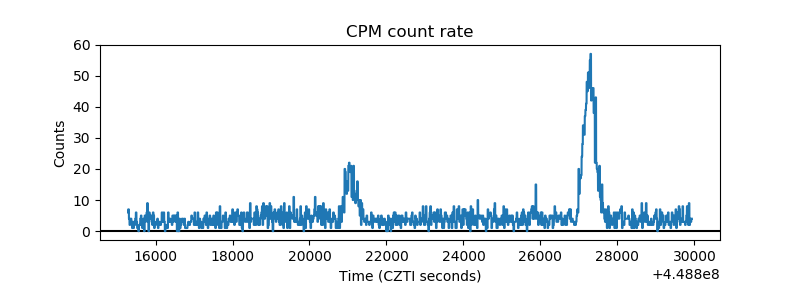 |
| CZT Counter | 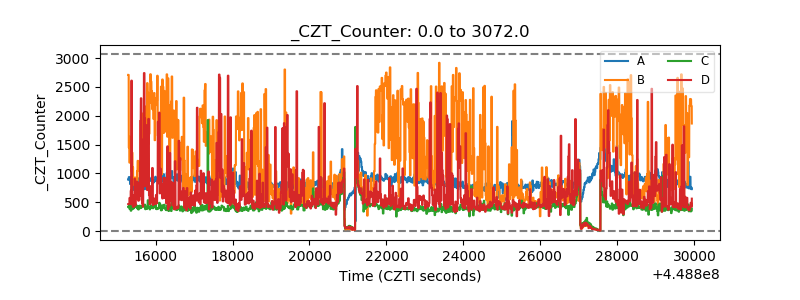 |
| +2.5 Volts monitor | 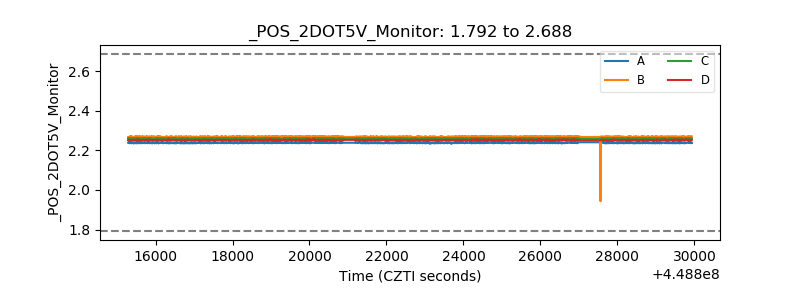 |
| +5 Volts monitor | 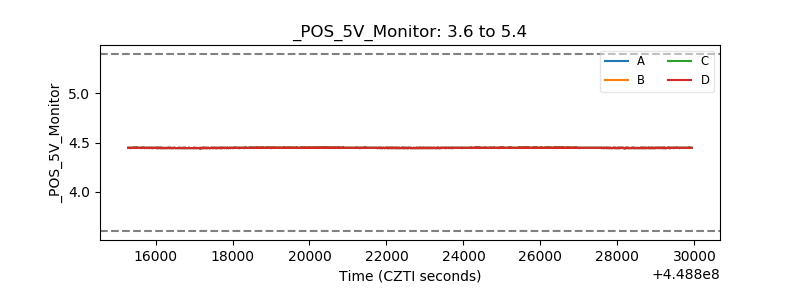 |
| _ROLL_ROT | 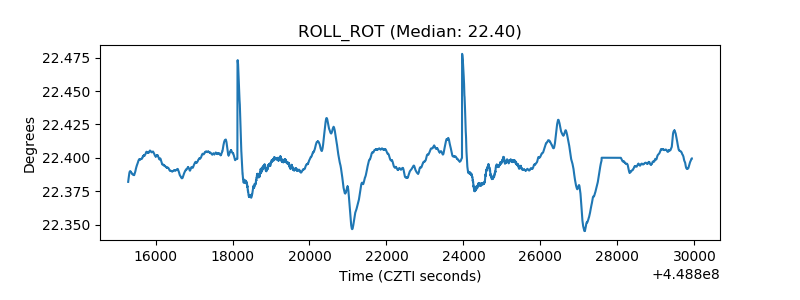 |
| _Roll_DEC | 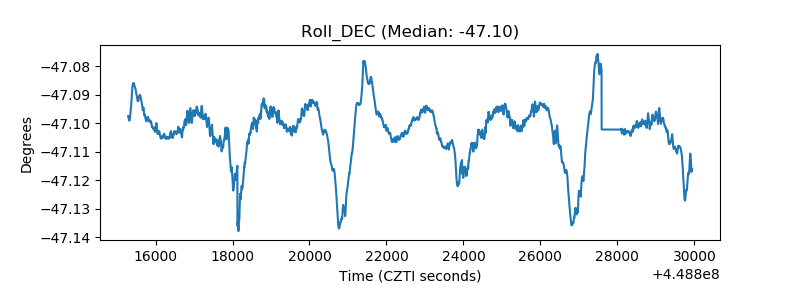 |
| _Roll_RA | 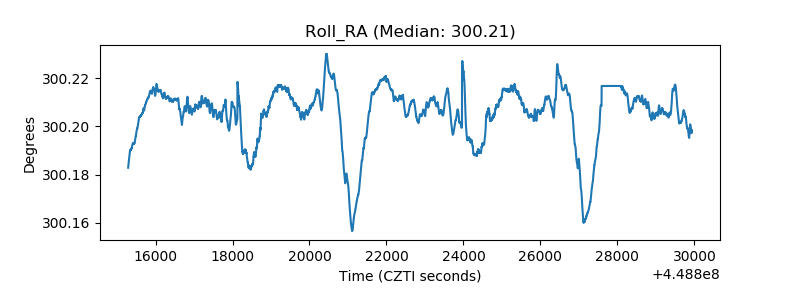 |
| Veto Counter | 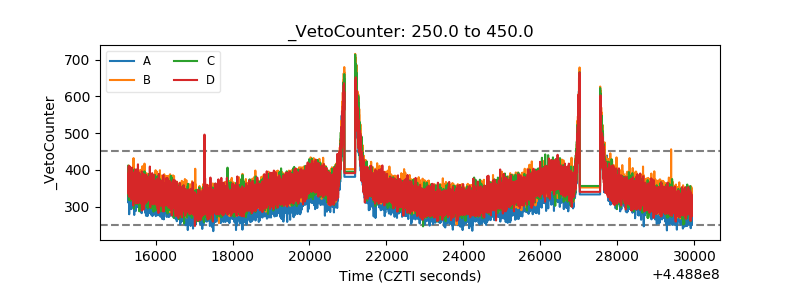 |