| Param | Original file | Final file |
|---|---|---|
| Filename | modeM0/AS1C07_001T01_9000006136_45874cztM0_level2.fits | modeM0/AS1C07_001T01_9000006136_45874cztM0_level2_quad_clean.evt |
| Size (bytes) | 306,463,680 | 55,016,640 |
| Size | 292.3 MB | 52.5 MB |
| Events in quadrant A | 3,240,038 | 374,949 |
| Events in quadrant B | 3,988,892 | 315,032 |
| Events in quadrant C | 1,579,215 | 386,670 |
| Events in quadrant D | 2,260,824 | 339,806 |
| Mode M9 | |||
|---|---|---|---|
| Quadrant | BADHDUFLAG | Total packets | Discarded packets |
| A | 0 | 8 | 0 |
| B | 0 | 8 | 0 |
| C | 0 | 8 | 0 |
| D | 0 | 8 | 0 |
| Mode SS | |||
|---|---|---|---|
| Quadrant | BADHDUFLAG | Total packets | Discarded packets |
| A | 0 | 70 | 0 |
| B | 0 | 70 | 0 |
| C | 0 | 70 | 0 |
| D | 0 | 70 | 0 |
| Mode M0 | |||
|---|---|---|---|
| Quadrant | BADHDUFLAG | Total packets | Discarded packets |
| A | 0 | 11948 | 1 |
| B | 0 | 14274 | 1 |
| C | 0 | 7162 | 1 |
| D | 0 | 9112 | 1 |
| Quadrant | Total seconds | Saturated seconds | Saturation percentage |
|---|---|---|---|
| A | 3527 | 109 | 3.090445% |
| B | 3527 | 879 | 24.922030% |
| C | 3527 | 9 | 0.255174% |
| D | 3526 | 120 | 3.403290% |
Noise dominated data is calculated using 1-second bins in cleaned event files. If a bin has >2000 counts, and if more than 50% of those come from <1% of pixels, then it is considered to be noise-dominated and hence unusable.
| Quadrant | # 1 sec bins | Bins with >0 counts | Bins with >2000 counts | High rate bins dominated by noise | Noise dominated (total time) | Noise dominated (detector-on time) | Marked lightcurve |
|---|---|---|---|---|---|---|---|
| A | 4252 | 3528 | 15 | 15 | 0.35% | 0.43% | 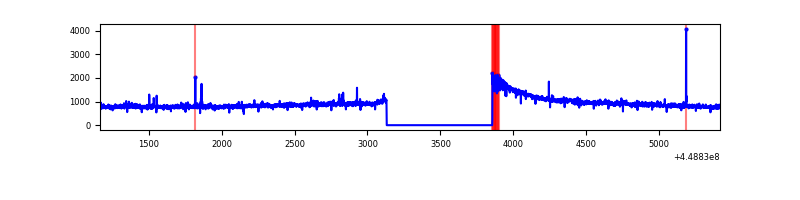 |
| B | 4252 | 3528 | 540 | 540 | 12.70% | 15.31% | 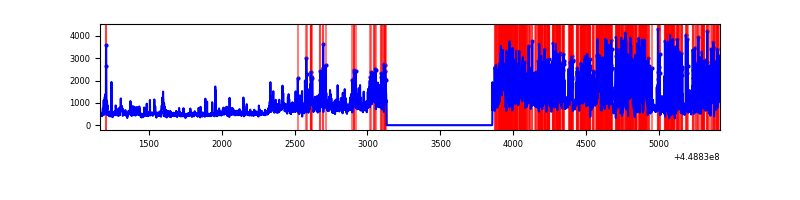 |
| C | 4252 | 3528 | 0 | 0 | 0.00% | 0.00% | 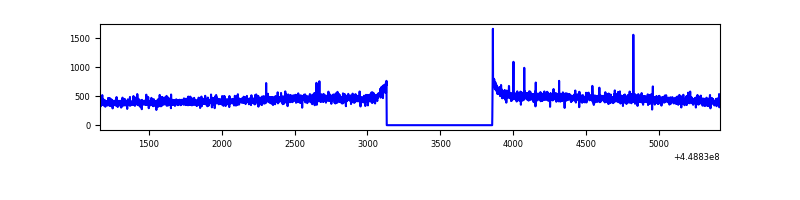 |
| D | 4251 | 3527 | 95 | 95 | 2.23% | 2.69% | 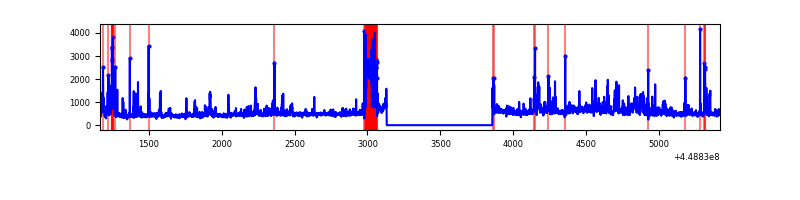 |
Top three noisy pixels from each quadrant. If the there are fewer than three noisy pixels in the level2.evt file, extra rows are filled as -1
| Pixel properties | Quadrant properties | ||||||
|---|---|---|---|---|---|---|---|
| Quadrant | DetID | PixID | Counts | Sigma | Mean | Median | Sigma |
| A | 10 | 83 | 1606765 | 18730.17 | 403 | 392 | 85.8 |
| A | 7 | 3 | 23457 | 268.94 | 403 | 392 | 85.8 |
| A | 13 | 6 | 19977 | 228.36 | 403 | 392 | 85.8 |
| B | 3 | 112 | 2395384 | 32229.61 | 366 | 355 | 74.3 |
| B | 4 | 171 | 78962 | 1057.8 | 366 | 355 | 74.3 |
| B | 0 | 183 | 43033 | 574.31 | 366 | 355 | 74.3 |
| C | 14 | 254 | 4485 | 42.87 | 402 | 404 | 95.2 |
| C | 3 | 233 | 3559 | 33.14 | 402 | 404 | 95.2 |
| C | 13 | 61 | 2715 | 24.27 | 402 | 404 | 95.2 |
| D | 1 | 52 | 236535 | 2360.41 | 394 | 383 | 100.0 |
| D | 13 | 249 | 221209 | 2207.22 | 394 | 383 | 100.0 |
| D | 2 | 249 | 81683 | 812.62 | 394 | 383 | 100.0 |
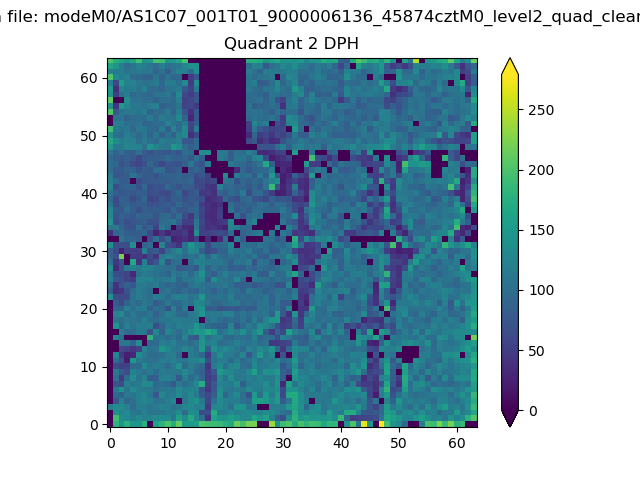
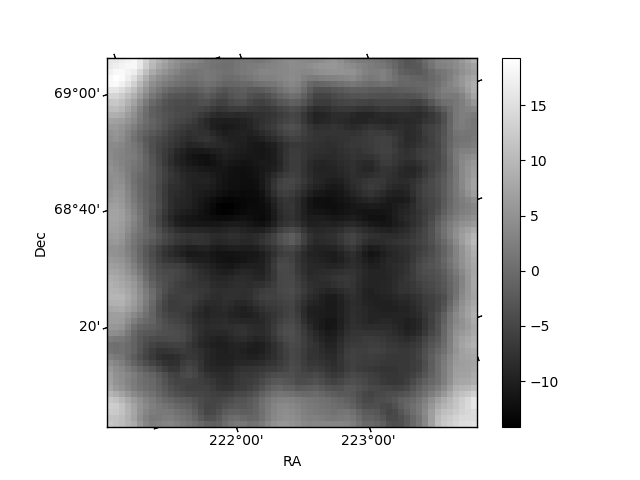
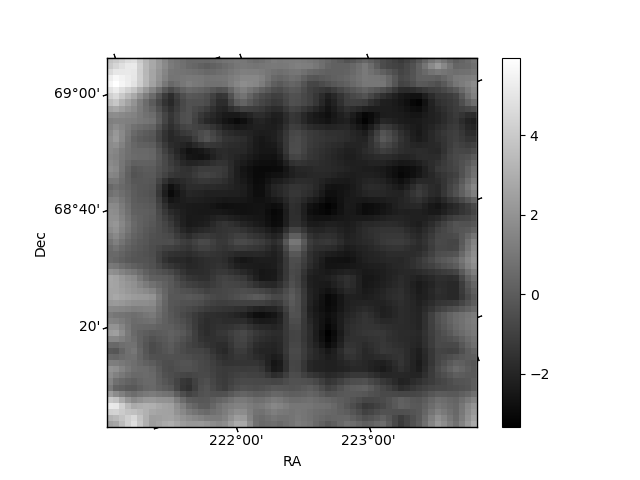
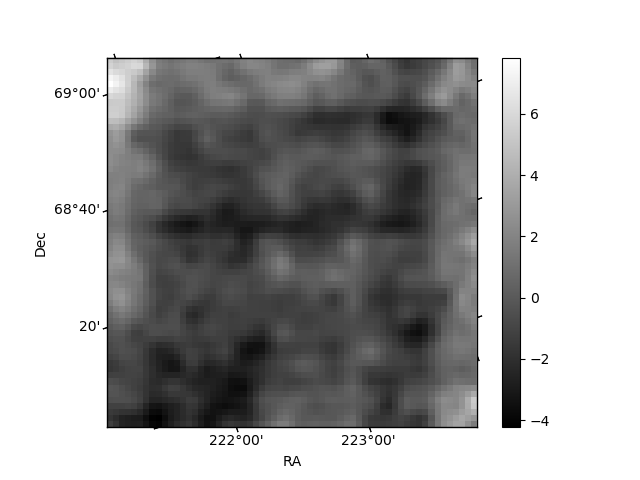
Histogram calculated using DETX and DETY for each event in the final _common_clean file
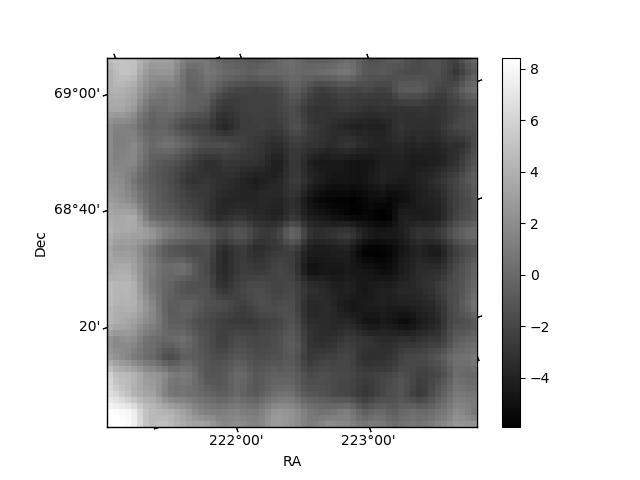
| Quadrant A | 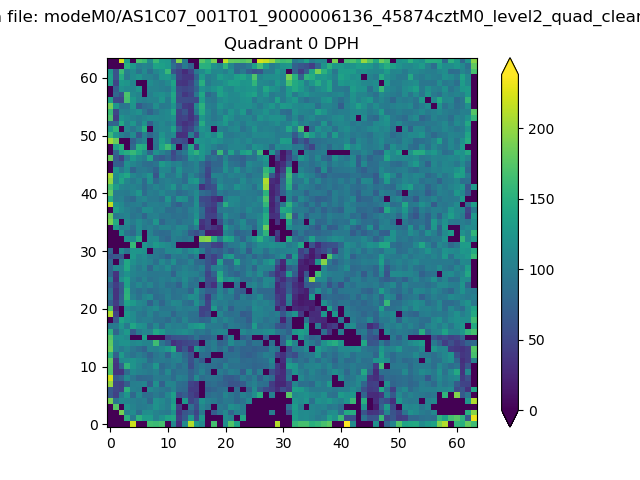 |
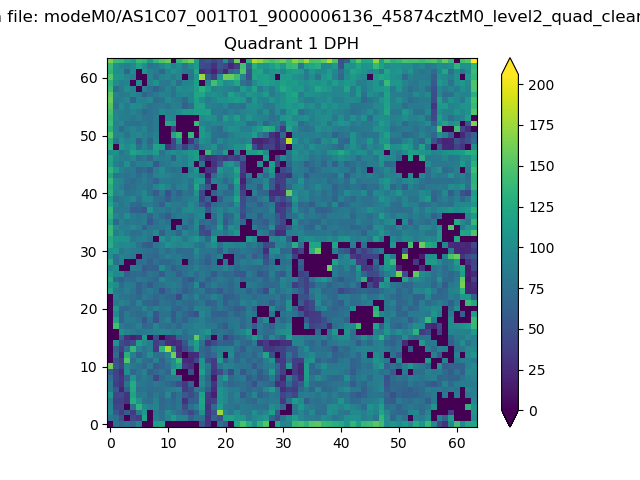 |
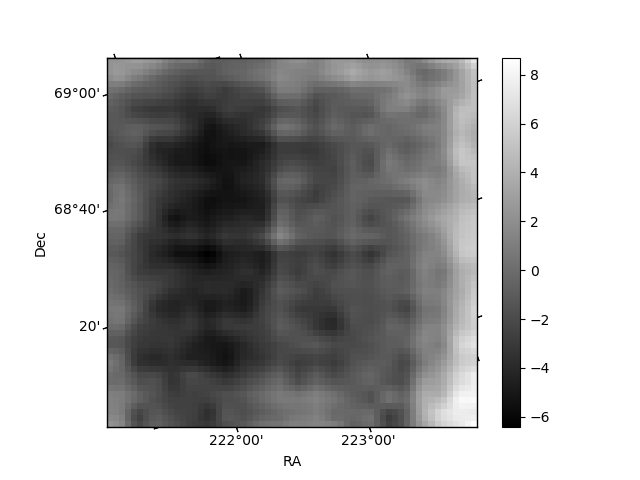
Quadrant B |
|---|---|---|---|
| Quadrant D | 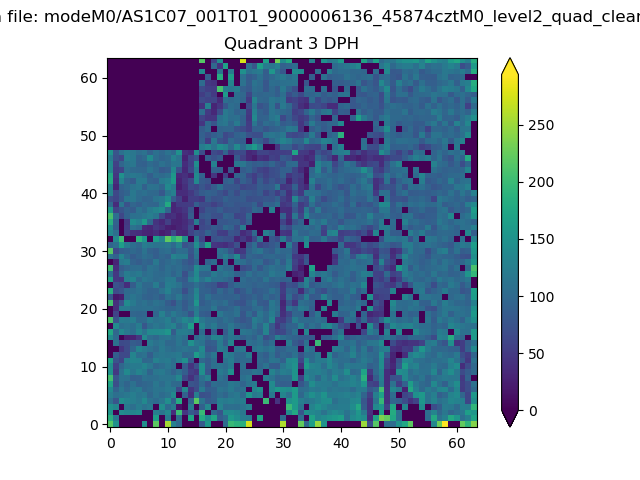 |
 |
Quadrant C |
| Plot type | Count rate plots | Images |
|---|---|---|
| Comparison with Poisson distribution Blue bars denote a histogram of data divided into 1 sec bins. Red curve is a Poisson curve with rate = median count rate of data. |
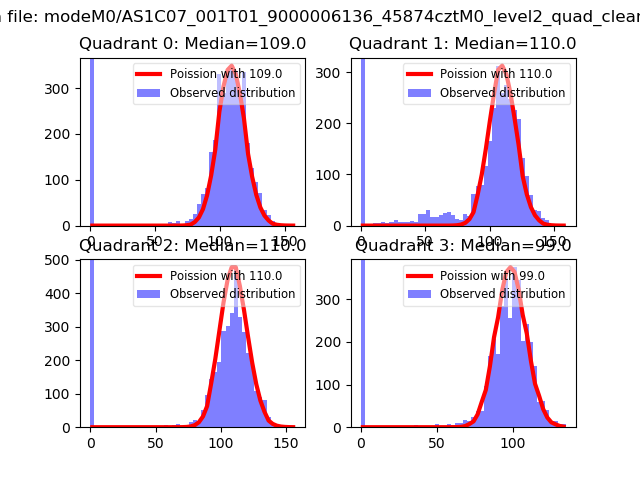 |
 |
| Quadrant-wise count rates Data is divided into 100 sec bins |
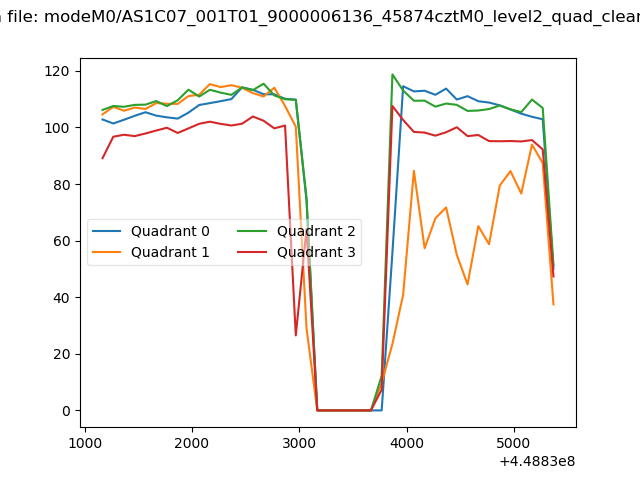 |
|
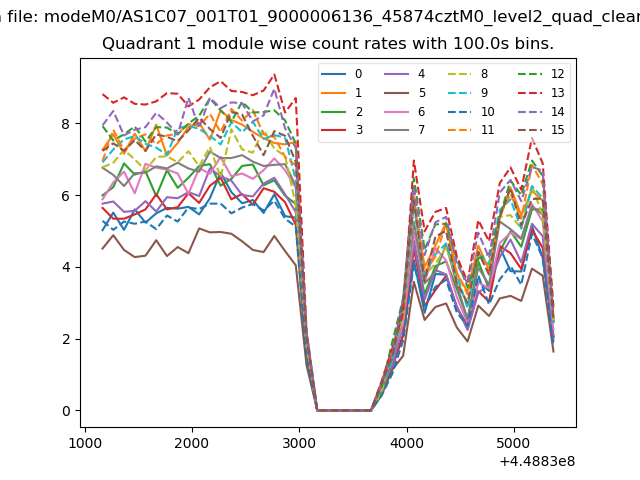
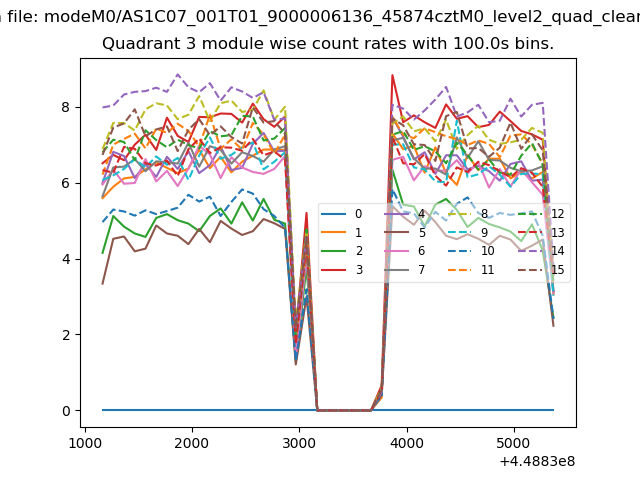
| Module-wise count rates for Quadrant A Data is divided into 100 sec bins |
 |
 |
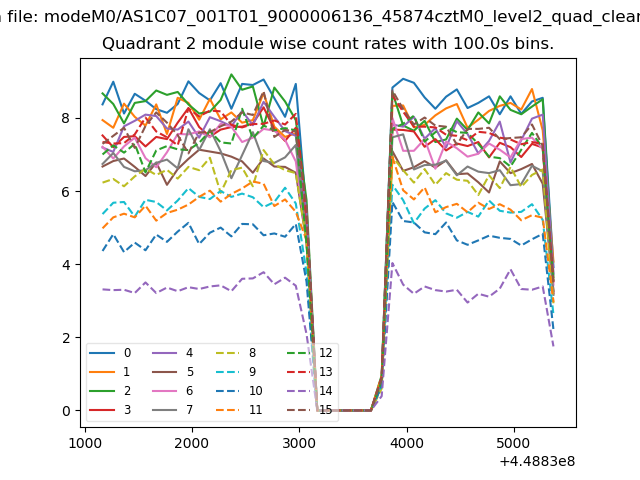
| Module-wise count rates for Quadrant B Data is divided into 100 sec bins |
 |
 |
| Module-wise count rates for Quadrant C Data is divided into 100 sec bins |
 |
 |
| Module-wise count rates for Quadrant D Data is divided into 100 sec bins |
 |
 |
| Parameter | Plot |
|---|---|
| CZT HV Monitor | 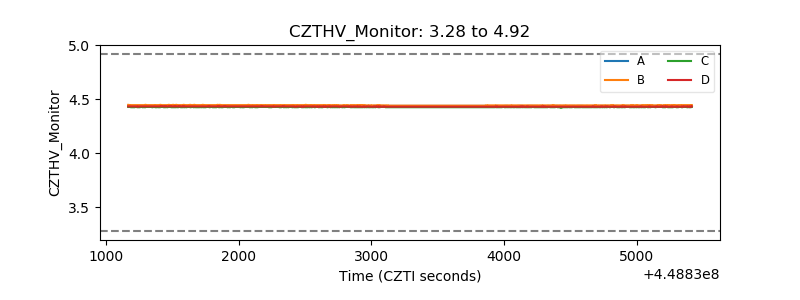 |
| D_VDD | 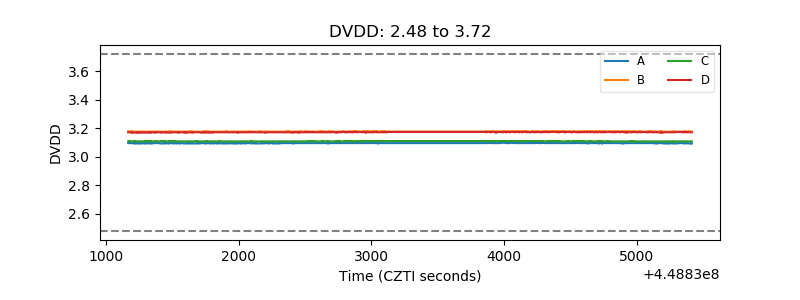 |
| Temperature 1 | 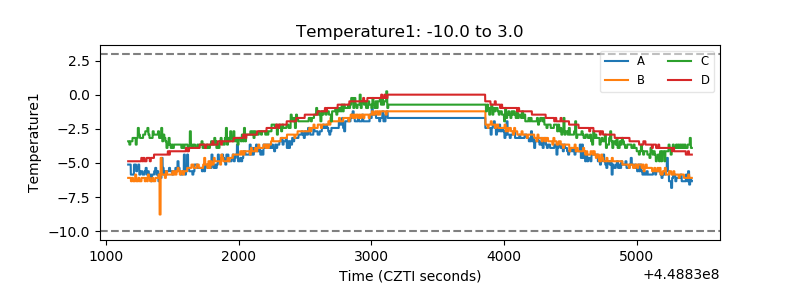 |
| Veto HV Monitor | 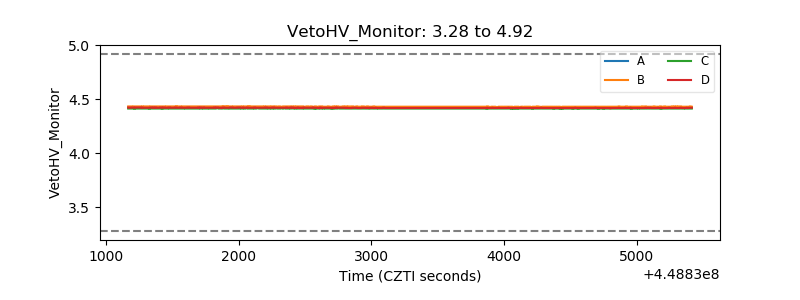 |
| Veto LLD | 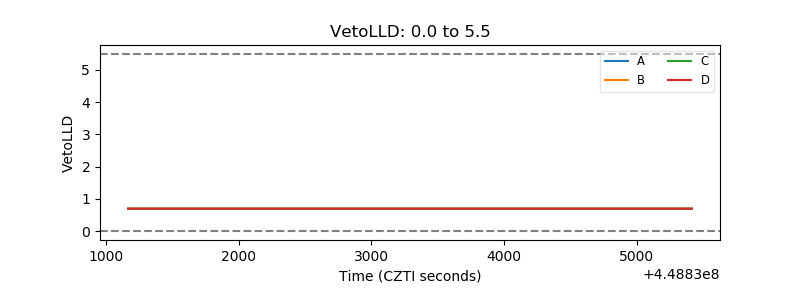 |
| Alpha Counter | 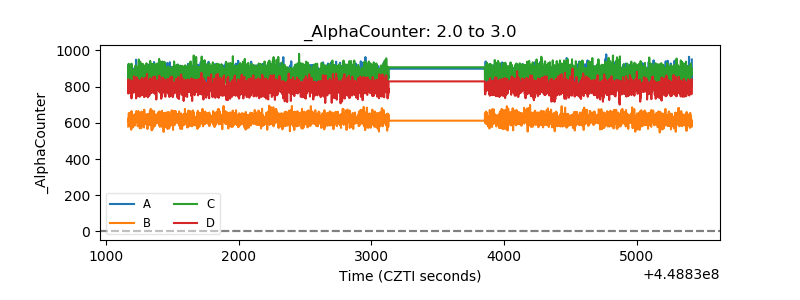 |
| _CPM_Rate | 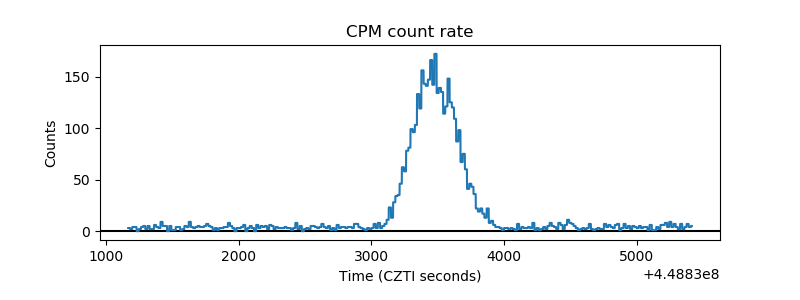 |
| CZT Counter | 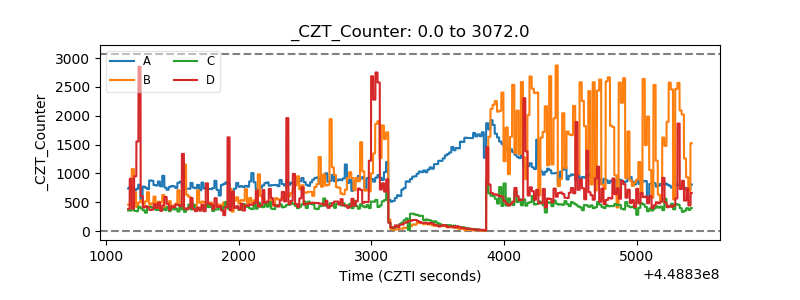 |
| +2.5 Volts monitor | 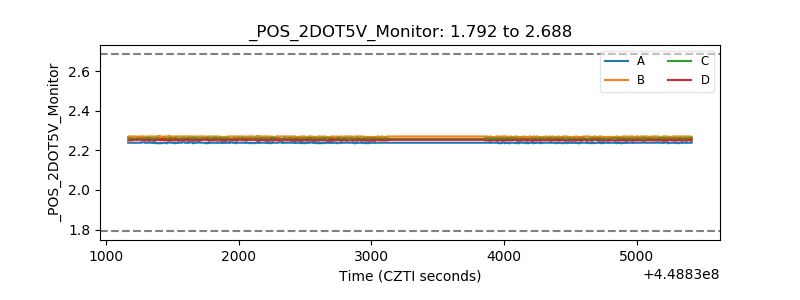 |
| +5 Volts monitor | 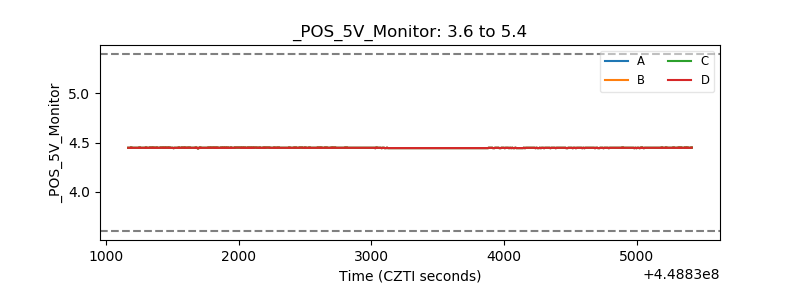 |
| _ROLL_ROT | 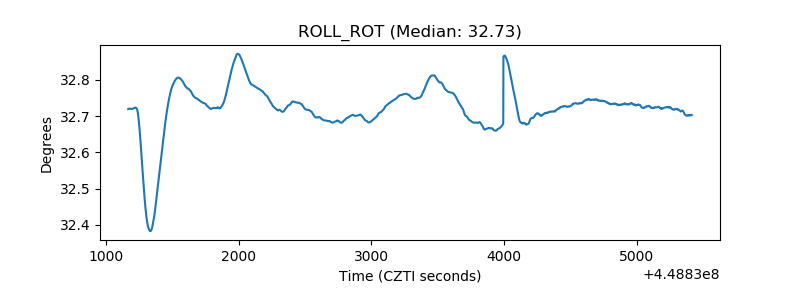 |
| _Roll_DEC | 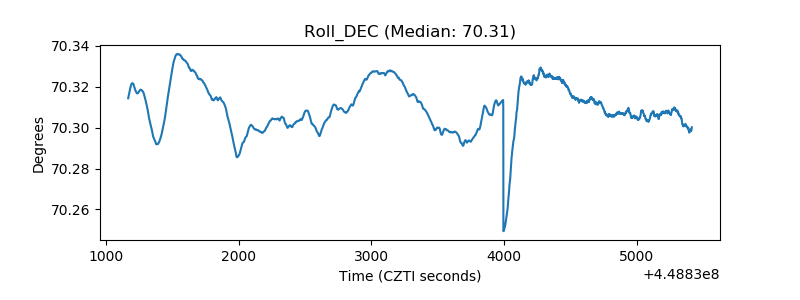 |
| _Roll_RA | 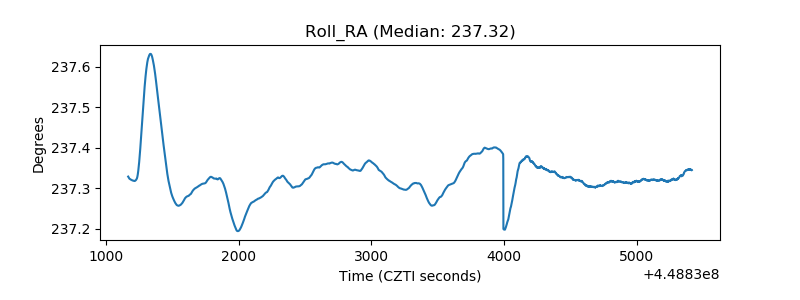 |
| Veto Counter | 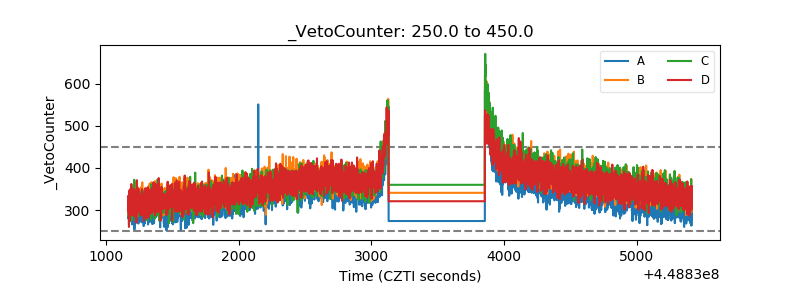 |