| Param | Original file | Final file |
|---|---|---|
| Filename | modeM0/AS1C07_001T01_9000006136_45877cztM0_level2.fits | modeM0/AS1C07_001T01_9000006136_45877cztM0_level2_quad_clean.evt |
| Size (bytes) | 553,726,080 | 103,760,640 |
| Size | 528.1 MB | 99.0 MB |
| Events in quadrant A | 5,890,292 | 693,598 |
| Events in quadrant B | 7,215,374 | 609,332 |
| Events in quadrant C | 2,844,659 | 728,874 |
| Events in quadrant D | 4,037,137 | 651,283 |
| Mode M9 | |||
|---|---|---|---|
| Quadrant | BADHDUFLAG | Total packets | Discarded packets |
| A | 0 | 14 | 0 |
| B | 0 | 15 | 0 |
| C | 0 | 15 | 0 |
| D | 0 | 15 | 0 |
| Mode SS | |||
|---|---|---|---|
| Quadrant | BADHDUFLAG | Total packets | Discarded packets |
| A | 0 | 134 | 0 |
| B | 0 | 134 | 0 |
| C | 0 | 134 | 0 |
| D | 0 | 134 | 0 |
| Mode M0 | |||
|---|---|---|---|
| Quadrant | BADHDUFLAG | Total packets | Discarded packets |
| A | 0 | 22306 | 2 |
| B | 0 | 25966 | 2 |
| C | 0 | 13395 | 2 |
| D | 0 | 16855 | 2 |
| Quadrant | Total seconds | Saturated seconds | Saturation percentage |
|---|---|---|---|
| A | 6573 | 253 | 3.849080% |
| B | 6572 | 1374 | 20.906878% |
| C | 6572 | 26 | 0.395618% |
| D | 6572 | 172 | 2.617164% |
Noise dominated data is calculated using 1-second bins in cleaned event files. If a bin has >2000 counts, and if more than 50% of those come from <1% of pixels, then it is considered to be noise-dominated and hence unusable.
| Quadrant | # 1 sec bins | Bins with >0 counts | Bins with >2000 counts | High rate bins dominated by noise | Noise dominated (total time) | Noise dominated (detector-on time) | Marked lightcurve |
|---|---|---|---|---|---|---|---|
| A | 7593 | 6574 | 98 | 98 | 1.29% | 1.49% | 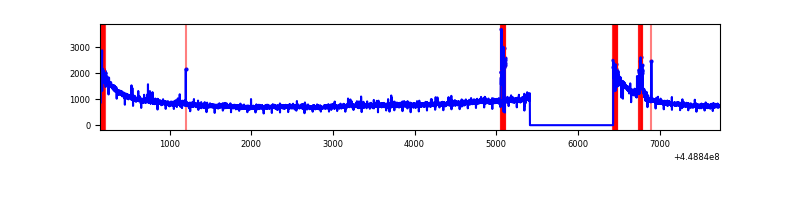 |
| B | 7592 | 6573 | 855 | 855 | 11.26% | 13.01% | 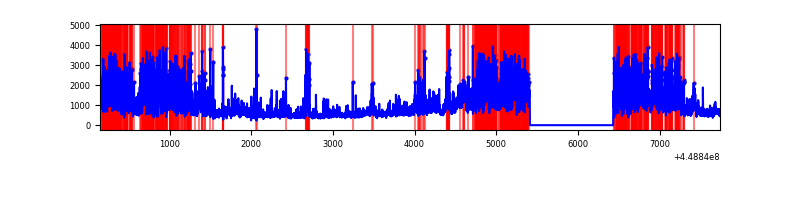 |
| C | 7592 | 6573 | 1 | 1 | 0.01% | 0.02% | 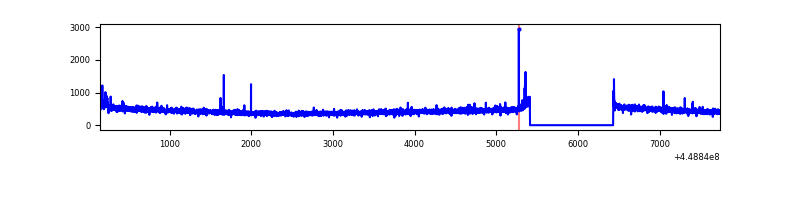 |
| D | 7592 | 6573 | 113 | 113 | 1.49% | 1.72% | 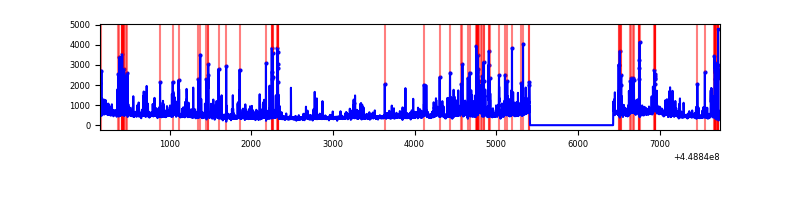 |
Top three noisy pixels from each quadrant. If the there are fewer than three noisy pixels in the level2.evt file, extra rows are filled as -1
| Pixel properties | Quadrant properties | ||||||
|---|---|---|---|---|---|---|---|
| Quadrant | DetID | PixID | Counts | Sigma | Mean | Median | Sigma |
| A | 10 | 83 | 2951824 | 20062.23 | 706 | 690 | 147.1 |
| A | 0 | 247 | 157288 | 1064.58 | 706 | 690 | 147.1 |
| A | 2 | 79 | 14748 | 95.57 | 706 | 690 | 147.1 |
| B | 3 | 112 | 4430401 | 34570.42 | 659 | 639 | 128.1 |
| B | 4 | 171 | 105144 | 815.57 | 659 | 639 | 128.1 |
| B | 4 | 158 | 18189 | 136.96 | 659 | 639 | 128.1 |
| C | 12 | 2 | 9439 | 52.16 | 720 | 723 | 167.1 |
| C | 15 | 208 | 8323 | 45.48 | 720 | 723 | 167.1 |
| C | 12 | 249 | 5878 | 30.85 | 720 | 723 | 167.1 |
| D | 1 | 52 | 727478 | 4106.09 | 705 | 685 | 177.0 |
| D | 13 | 249 | 129483 | 727.66 | 705 | 685 | 177.0 |
| D | 2 | 249 | 124816 | 701.29 | 705 | 685 | 177.0 |
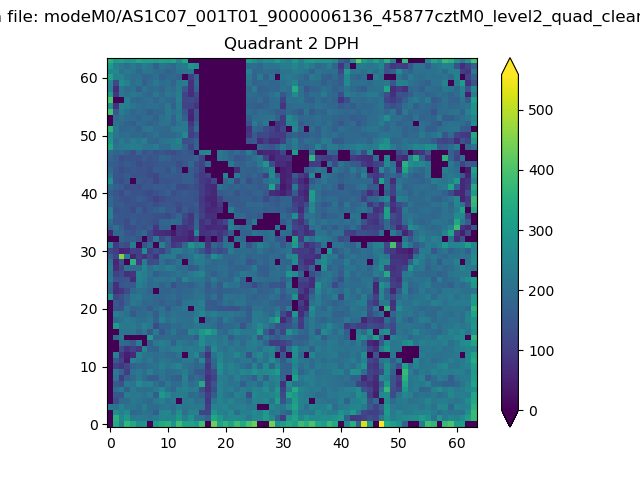
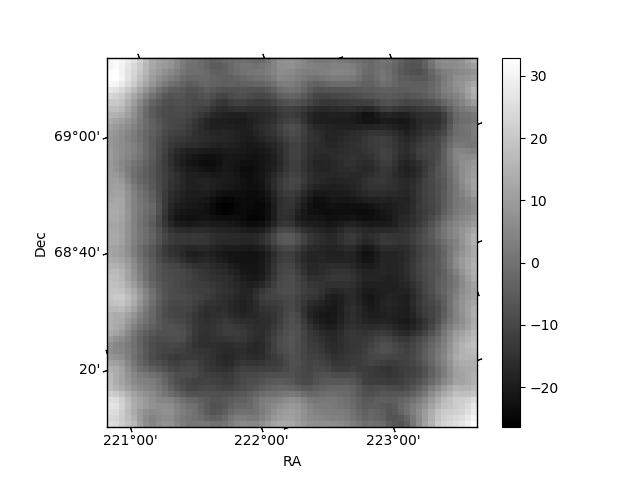
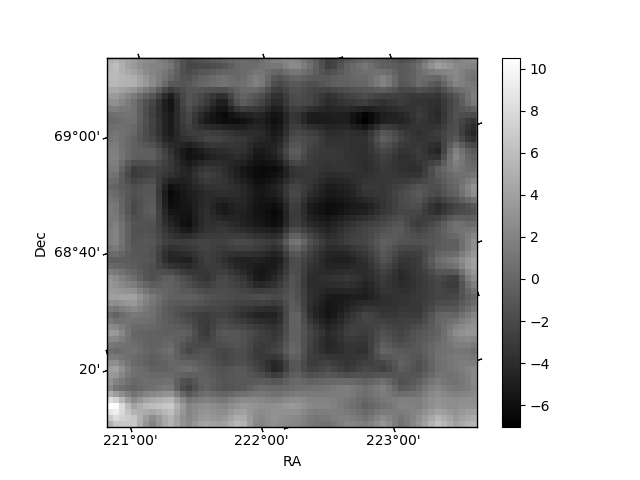
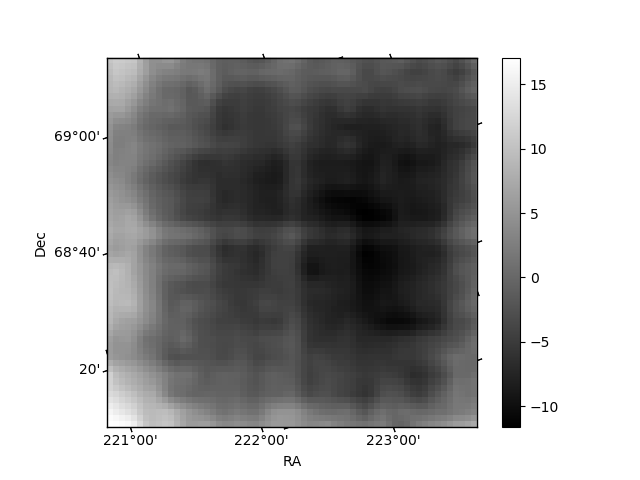
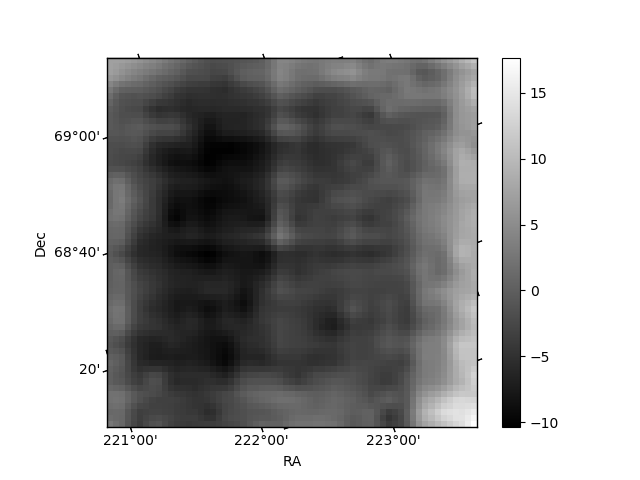
Histogram calculated using DETX and DETY for each event in the final _common_clean file
| Quadrant A | 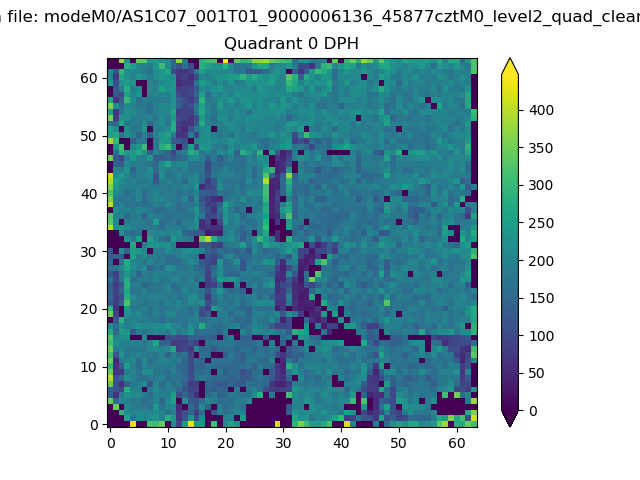 |
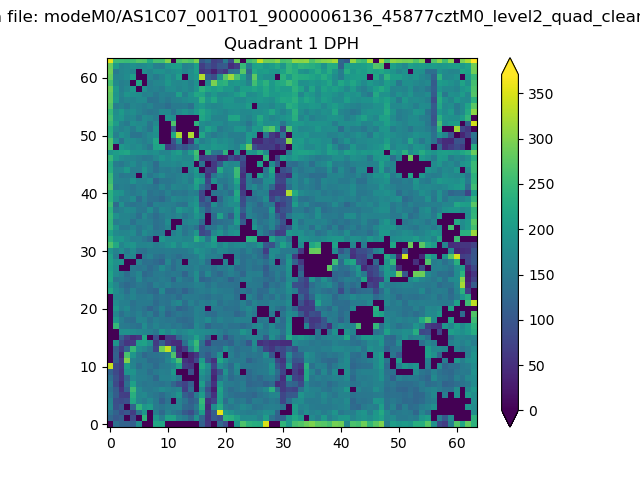 |
Quadrant B |
|---|---|---|---|
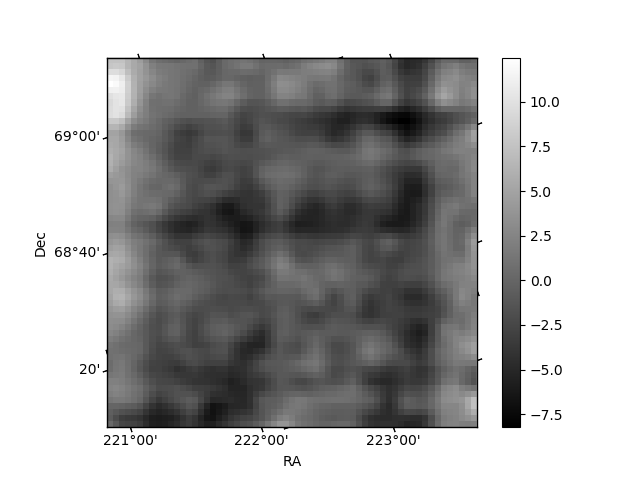
| Quadrant D | 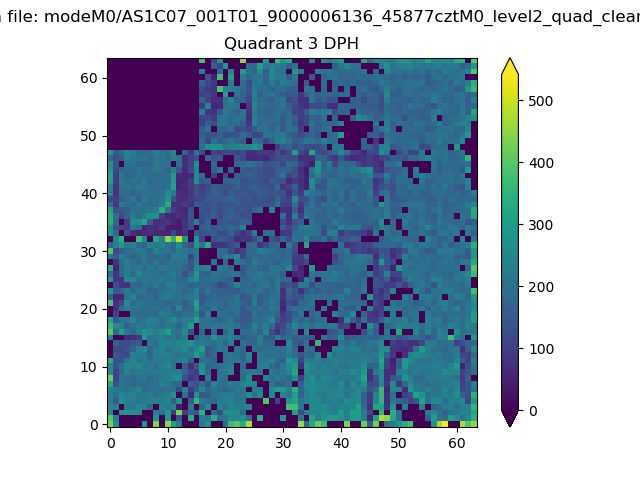 |
 |
Quadrant C |
| Plot type | Count rate plots | Images |
|---|---|---|
| Comparison with Poisson distribution Blue bars denote a histogram of data divided into 1 sec bins. Red curve is a Poisson curve with rate = median count rate of data. |
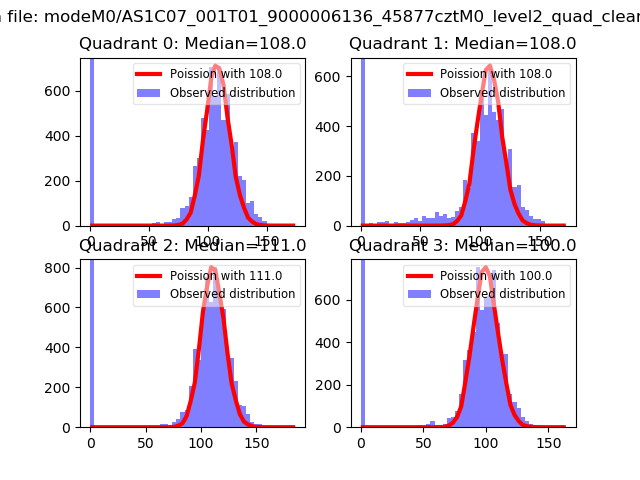 |
 |
| Quadrant-wise count rates Data is divided into 100 sec bins |
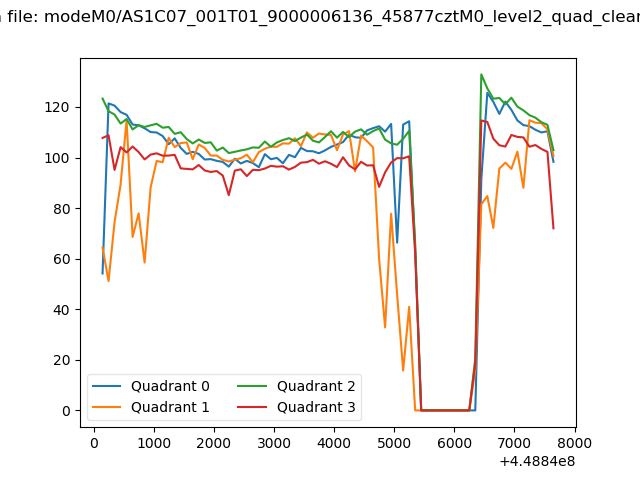 |
|
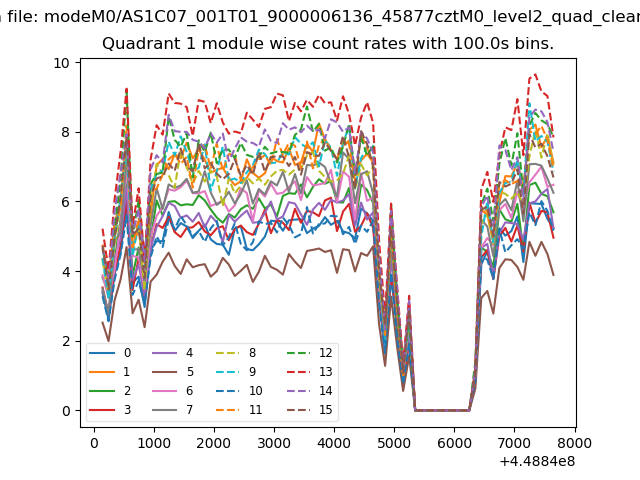
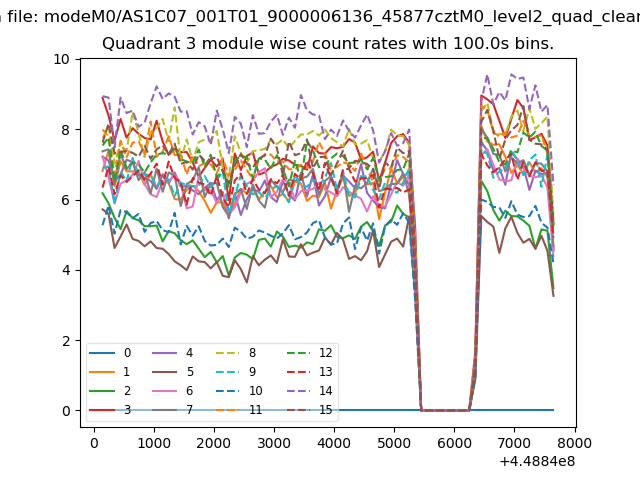
| Module-wise count rates for Quadrant A Data is divided into 100 sec bins |
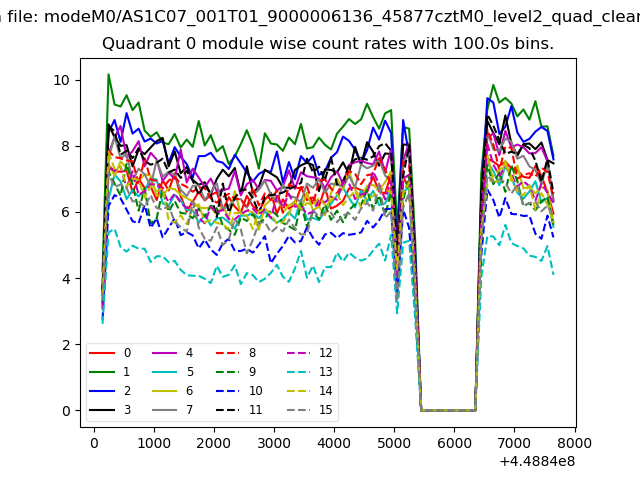 |
 |
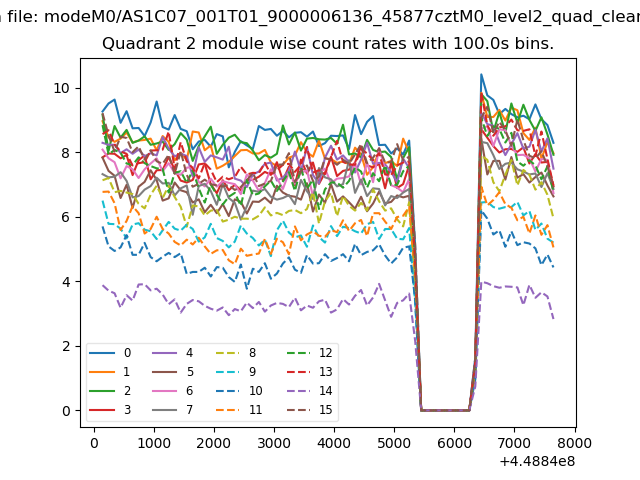
| Module-wise count rates for Quadrant B Data is divided into 100 sec bins |
 |
 |
| Module-wise count rates for Quadrant C Data is divided into 100 sec bins |
 |
 |
| Module-wise count rates for Quadrant D Data is divided into 100 sec bins |
 |
 |
| Parameter | Plot |
|---|---|
| CZT HV Monitor | 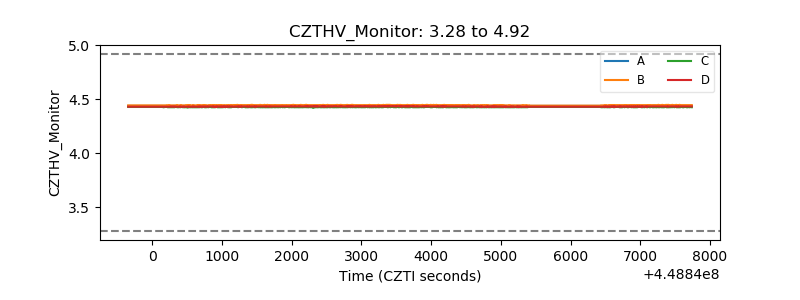 |
| D_VDD | 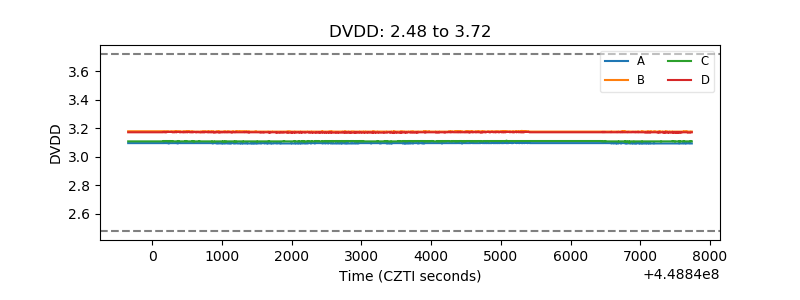 |
| Temperature 1 | 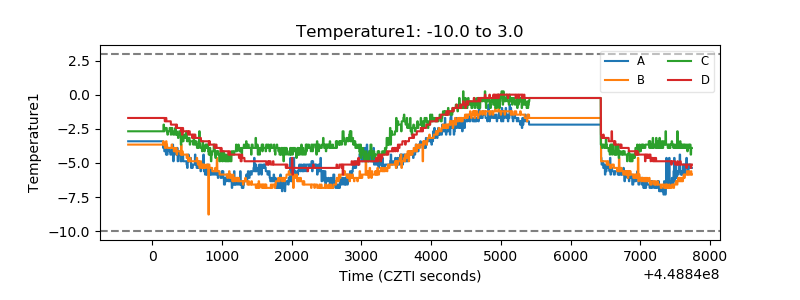 |
| Veto HV Monitor | 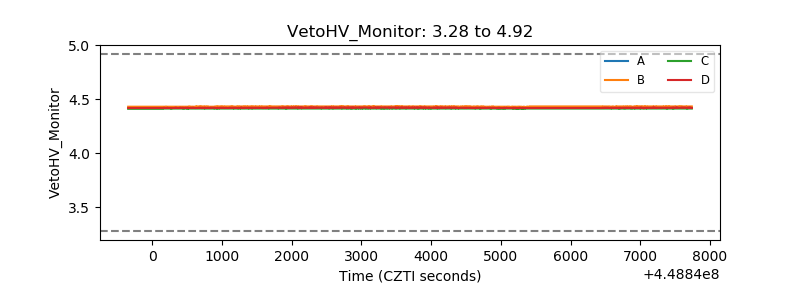 |
| Veto LLD | 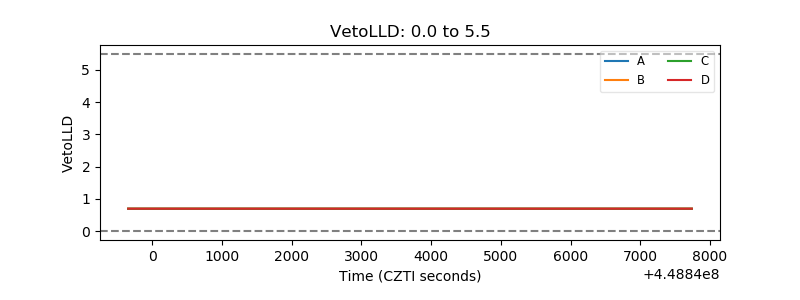 |
| Alpha Counter | 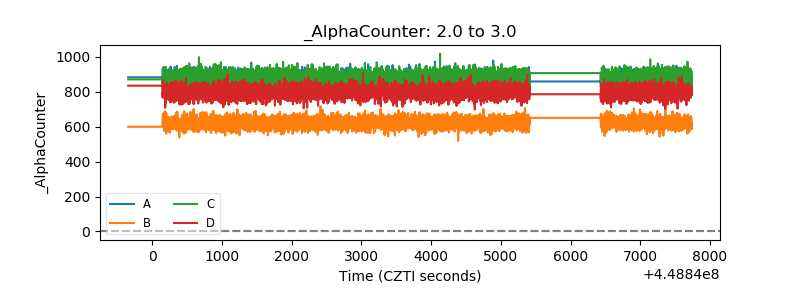 |
| _CPM_Rate | 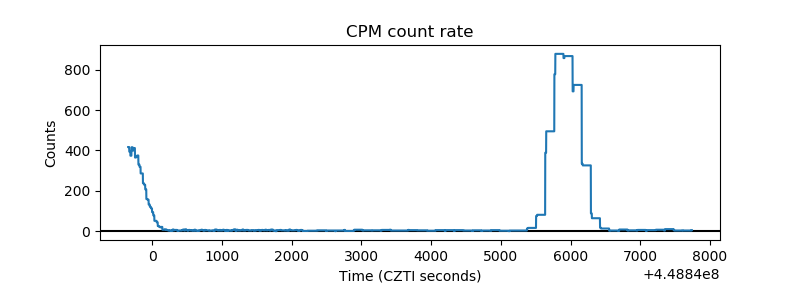 |
| CZT Counter | 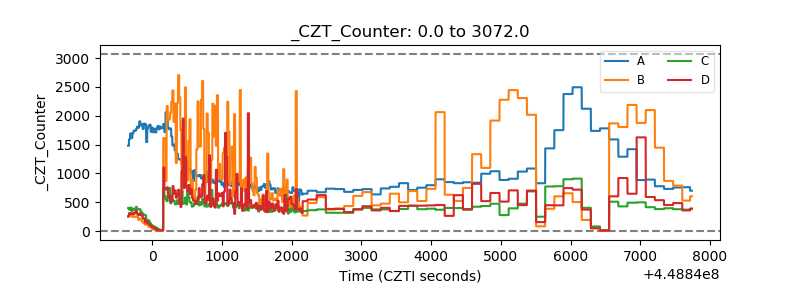 |
| +2.5 Volts monitor | 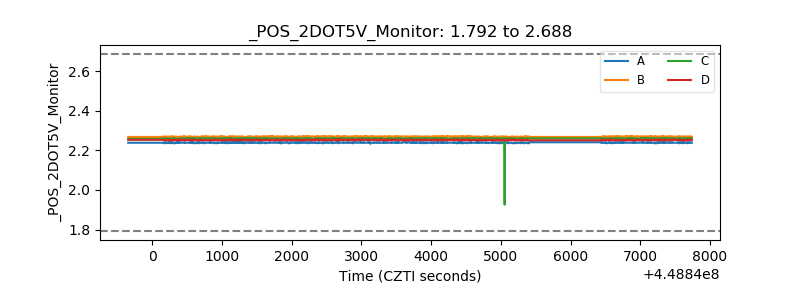 |
| +5 Volts monitor | 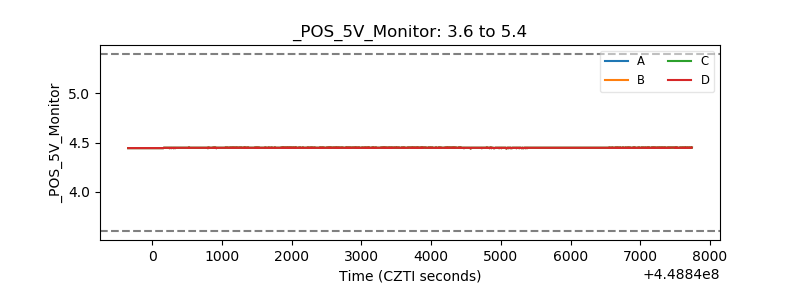 |
| _ROLL_ROT | 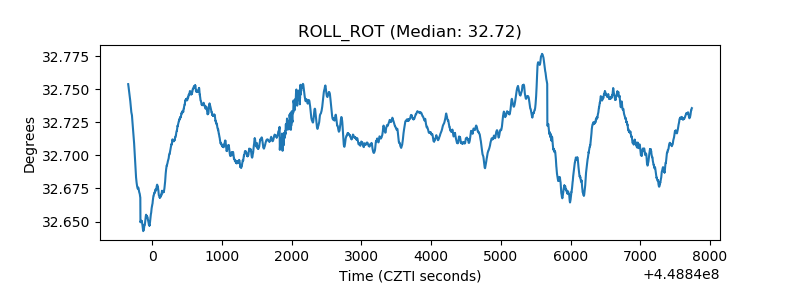 |
| _Roll_DEC | 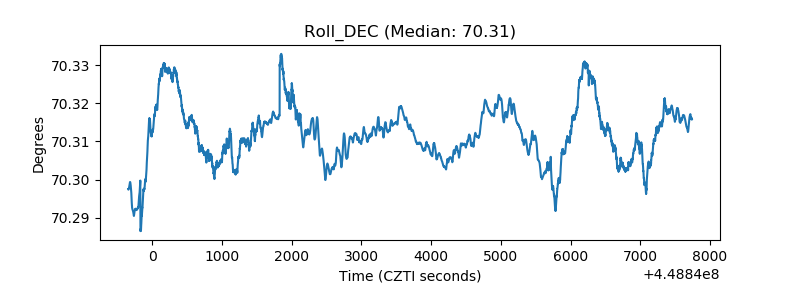 |
| _Roll_RA | 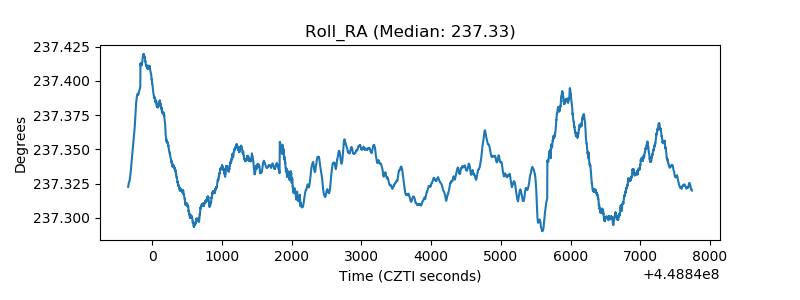 |
| Veto Counter | 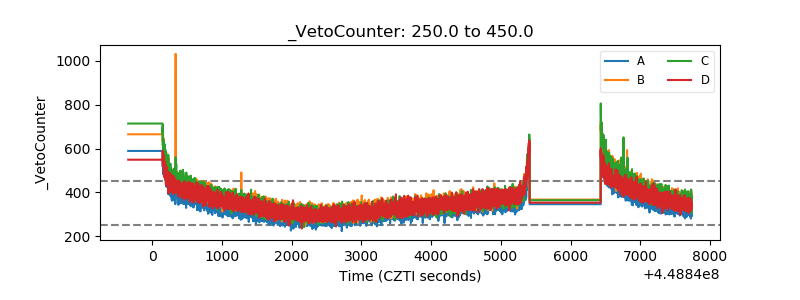 |