| Param | Original file | Final file |
|---|---|---|
| Filename | modeM0/AS1C07_001T01_9000006136_45878cztM0_level2.fits | modeM0/AS1C07_001T01_9000006136_45878cztM0_level2_quad_clean.evt |
| Size (bytes) | 563,469,120 | 111,424,320 |
| Size | 537.4 MB | 106.3 MB |
| Events in quadrant A | 6,233,353 | 744,706 |
| Events in quadrant B | 6,982,608 | 669,531 |
| Events in quadrant C | 3,276,526 | 783,029 |
| Events in quadrant D | 3,832,627 | 698,130 |
| Mode M9 | |||
|---|---|---|---|
| Quadrant | BADHDUFLAG | Total packets | Discarded packets |
| A | 0 | 22 | 0 |
| B | 0 | 22 | 0 |
| C | 0 | 22 | 0 |
| D | 0 | 22 | 0 |
| Mode SS | |||
|---|---|---|---|
| Quadrant | BADHDUFLAG | Total packets | Discarded packets |
| A | 0 | 140 | 0 |
| B | 0 | 140 | 0 |
| C | 0 | 140 | 0 |
| D | 0 | 140 | 0 |
| Mode M0 | |||
|---|---|---|---|
| Quadrant | BADHDUFLAG | Total packets | Discarded packets |
| A | 0 | 23538 | 2 |
| B | 0 | 25462 | 2 |
| C | 0 | 14864 | 2 |
| D | 0 | 16496 | 2 |
| Quadrant | Total seconds | Saturated seconds | Saturation percentage |
|---|---|---|---|
| A | 6869 | 235 | 3.421168% |
| B | 6870 | 1285 | 18.704512% |
| C | 6870 | 92 | 1.339156% |
| D | 6870 | 130 | 1.892285% |
Noise dominated data is calculated using 1-second bins in cleaned event files. If a bin has >2000 counts, and if more than 50% of those come from <1% of pixels, then it is considered to be noise-dominated and hence unusable.
| Quadrant | # 1 sec bins | Bins with >0 counts | Bins with >2000 counts | High rate bins dominated by noise | Noise dominated (total time) | Noise dominated (detector-on time) | Marked lightcurve |
|---|---|---|---|---|---|---|---|
| A | 9019 | 6871 | 70 | 70 | 0.78% | 1.02% | 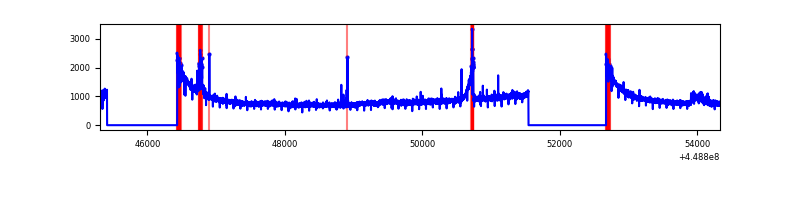 |
| B | 9020 | 6872 | 809 | 809 | 8.97% | 11.77% | 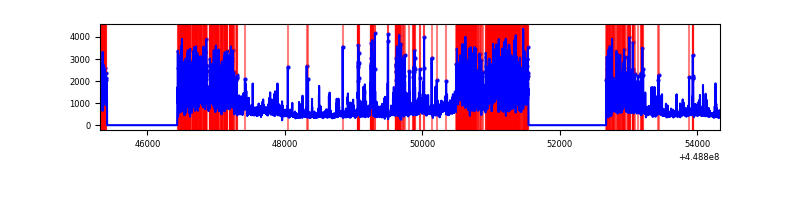 |
| C | 9020 | 6872 | 49 | 49 | 0.54% | 0.71% | 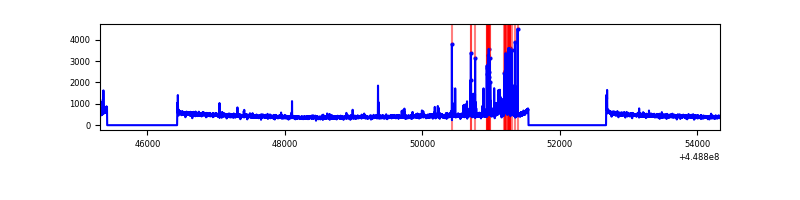 |
| D | 9020 | 6872 | 93 | 93 | 1.03% | 1.35% | 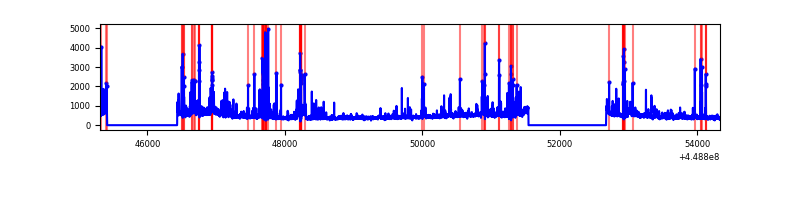 |
Top three noisy pixels from each quadrant. If the there are fewer than three noisy pixels in the level2.evt file, extra rows are filled as -1
| Pixel properties | Quadrant properties | ||||||
|---|---|---|---|---|---|---|---|
| Quadrant | DetID | PixID | Counts | Sigma | Mean | Median | Sigma |
| A | 10 | 83 | 3098156 | 20144.78 | 744 | 728 | 153.8 |
| A | 0 | 247 | 198602 | 1286.92 | 744 | 728 | 153.8 |
| A | 0 | 226 | 18669 | 116.68 | 744 | 728 | 153.8 |
| B | 3 | 112 | 3983820 | 29445.31 | 701 | 680 | 135.3 |
| B | 4 | 171 | 153553 | 1130.11 | 701 | 680 | 135.3 |
| B | 12 | 111 | 16536 | 117.22 | 701 | 680 | 135.3 |
| C | 14 | 254 | 294923 | 1679.87 | 752 | 758 | 175.1 |
| C | 12 | 2 | 37306 | 208.71 | 752 | 758 | 175.1 |
| C | 3 | 233 | 6835 | 34.7 | 752 | 758 | 175.1 |
| D | 1 | 52 | 251903 | 1353.59 | 736 | 712 | 185.6 |
| D | 7 | 38 | 227823 | 1223.83 | 736 | 712 | 185.6 |
| D | 6 | 143 | 109897 | 588.37 | 736 | 712 | 185.6 |
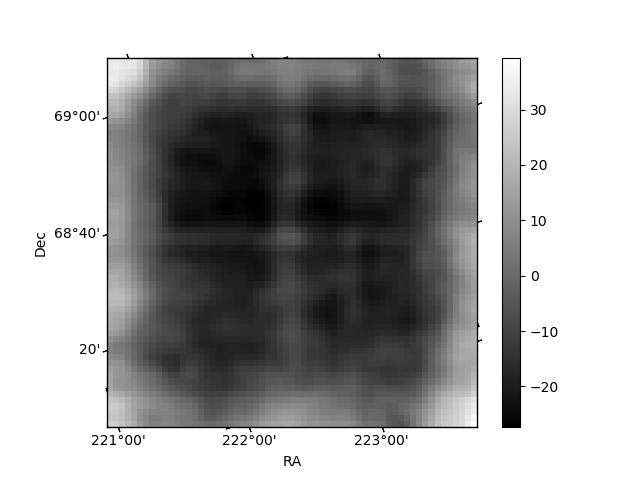
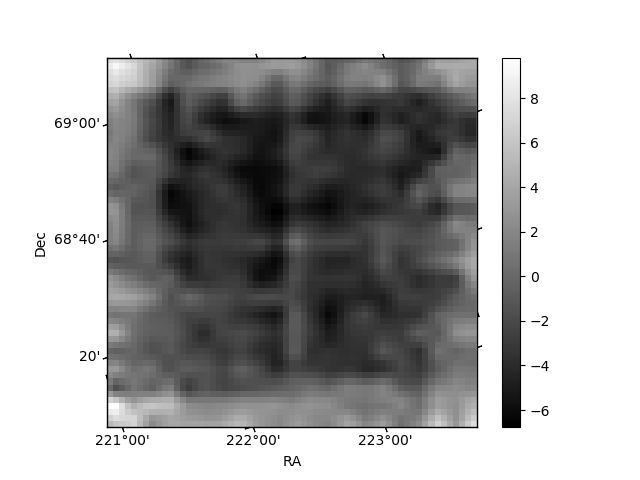
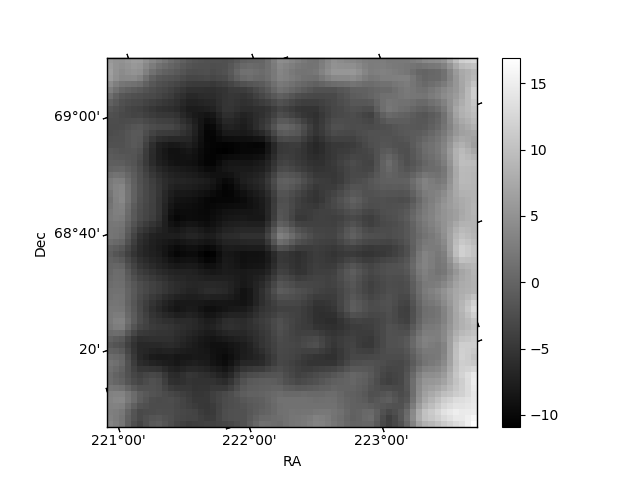
Histogram calculated using DETX and DETY for each event in the final _common_clean file
| Quadrant A | 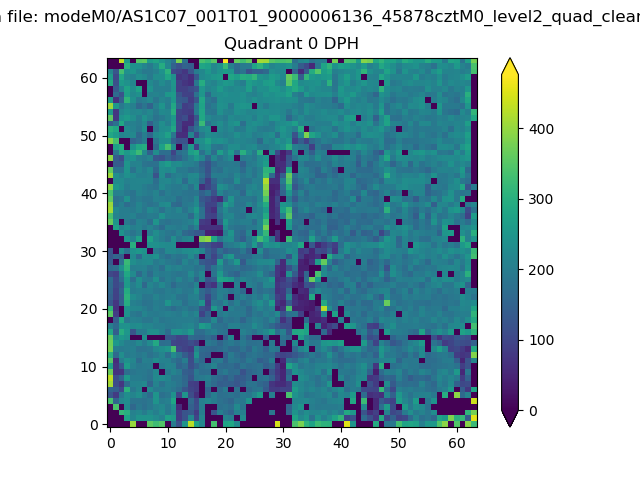 |
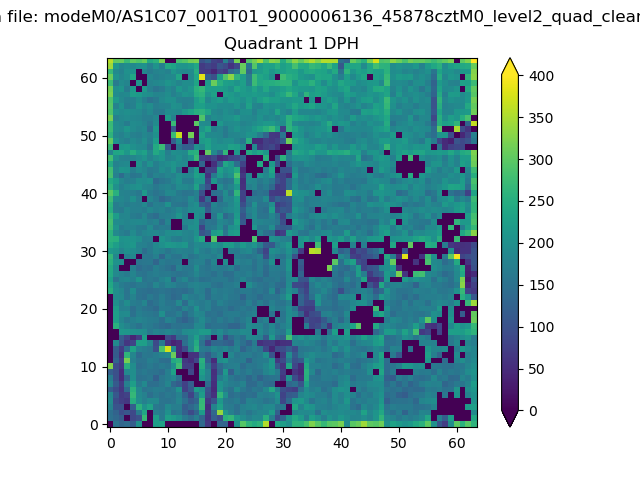 |
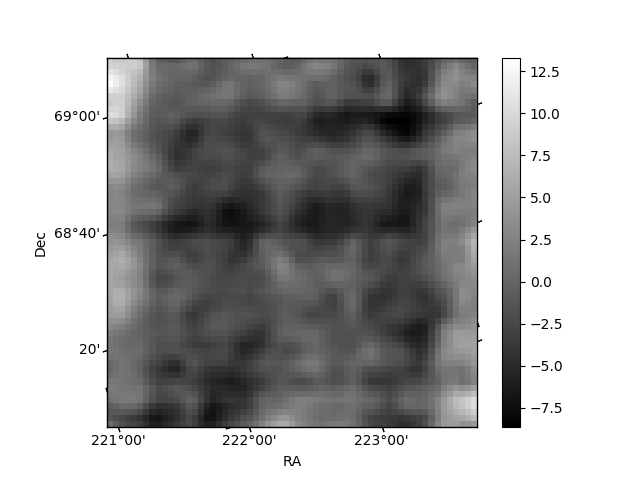
Quadrant B |
|---|---|---|---|
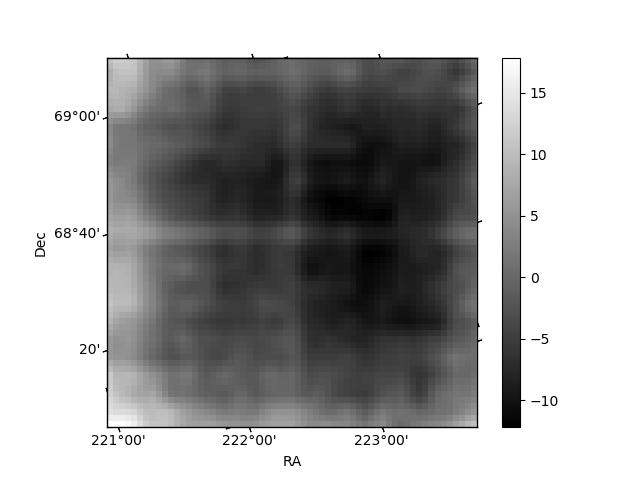
| Quadrant D | 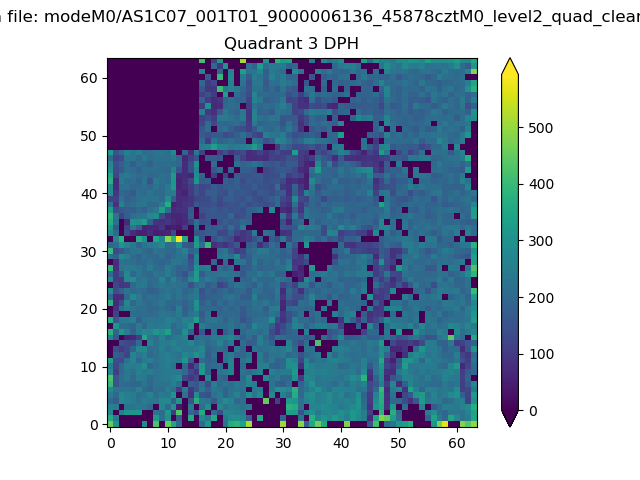 |
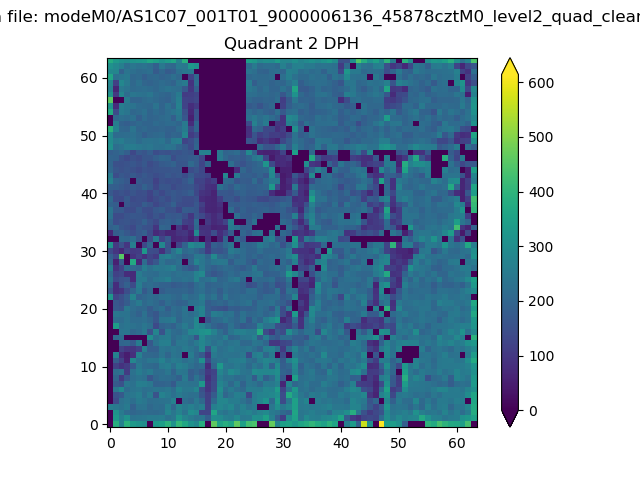 |
Quadrant C |
| Plot type | Count rate plots | Images |
|---|---|---|
| Comparison with Poisson distribution Blue bars denote a histogram of data divided into 1 sec bins. Red curve is a Poisson curve with rate = median count rate of data. |
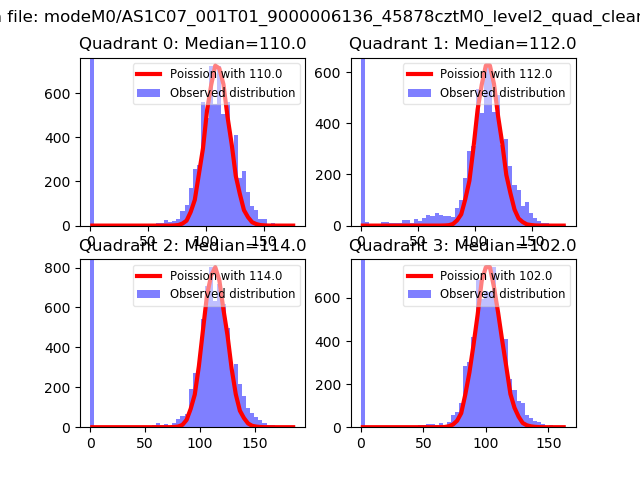 |
 |
| Quadrant-wise count rates Data is divided into 100 sec bins |
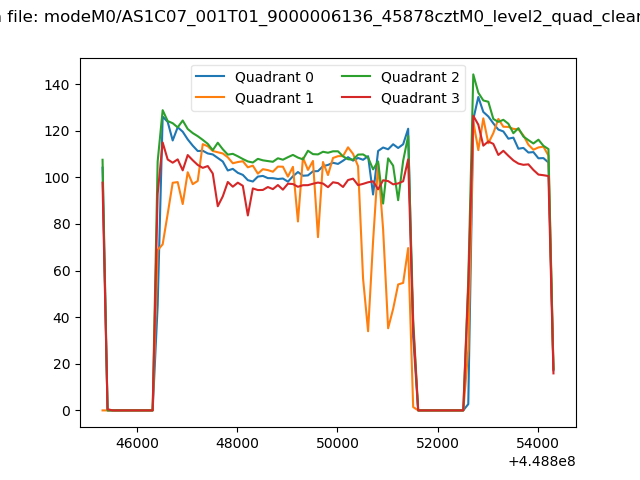 |
|
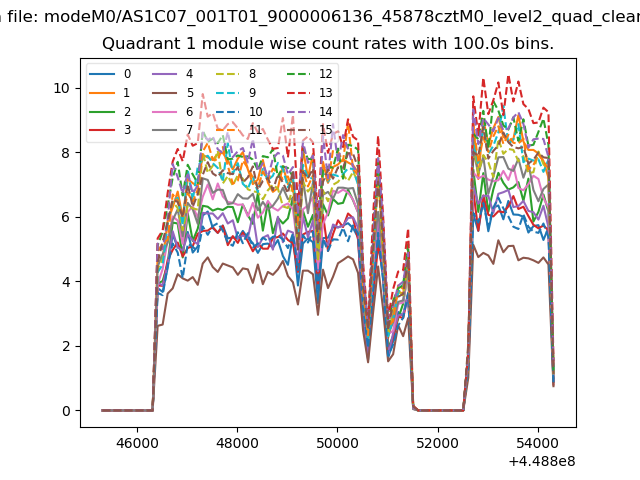
| Module-wise count rates for Quadrant A Data is divided into 100 sec bins |
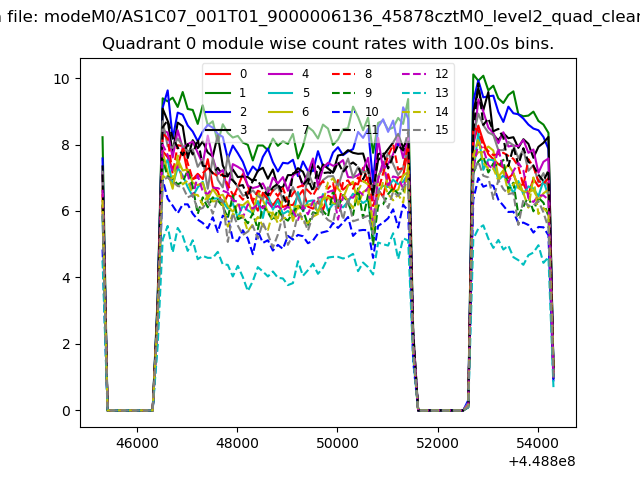 |
 |
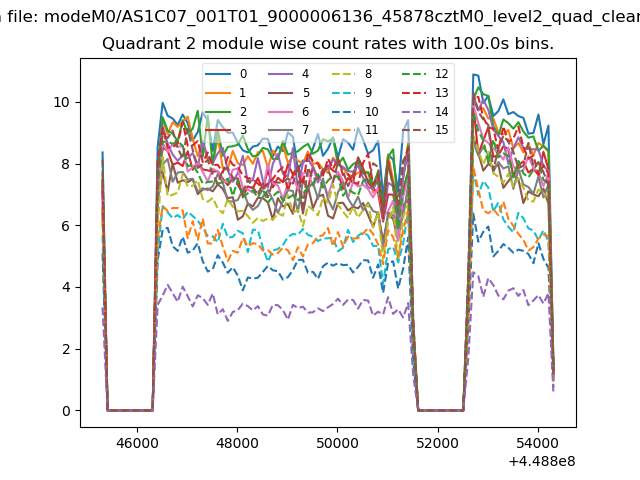
| Module-wise count rates for Quadrant B Data is divided into 100 sec bins |
 |
 |
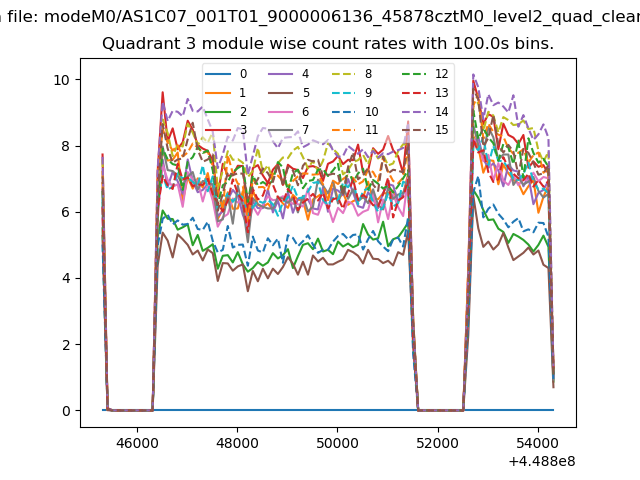
| Module-wise count rates for Quadrant C Data is divided into 100 sec bins |
 |
 |
| Module-wise count rates for Quadrant D Data is divided into 100 sec bins |
 |
 |
| Parameter | Plot |
|---|---|
| CZT HV Monitor | 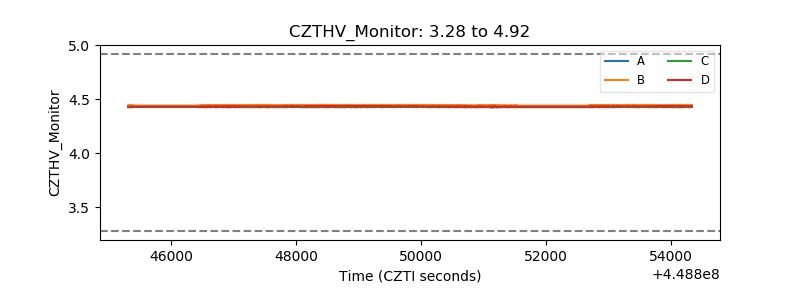 |
| D_VDD | 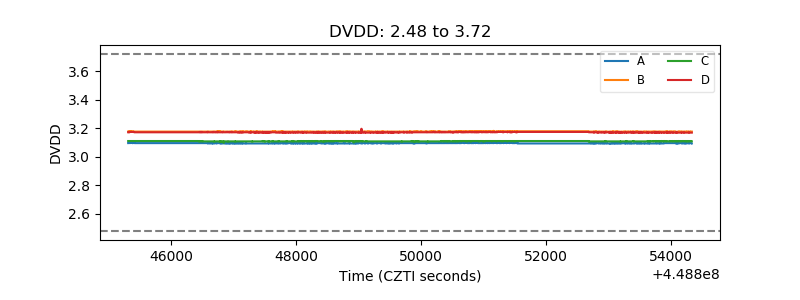 |
| Temperature 1 | 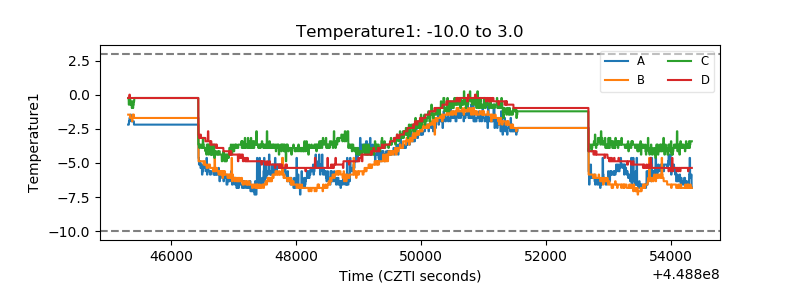 |
| Veto HV Monitor | 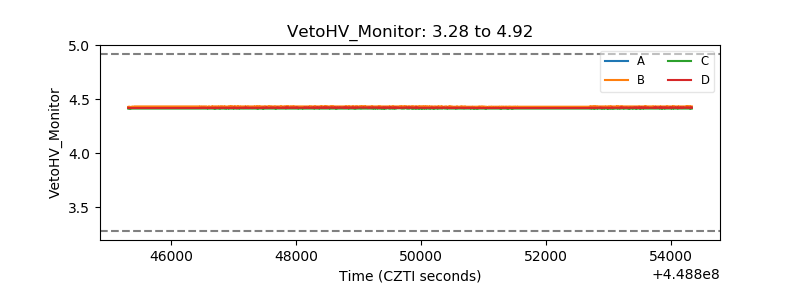 |
| Veto LLD | 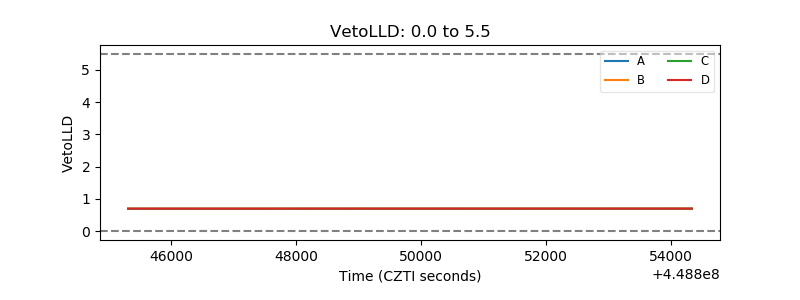 |
| Alpha Counter | 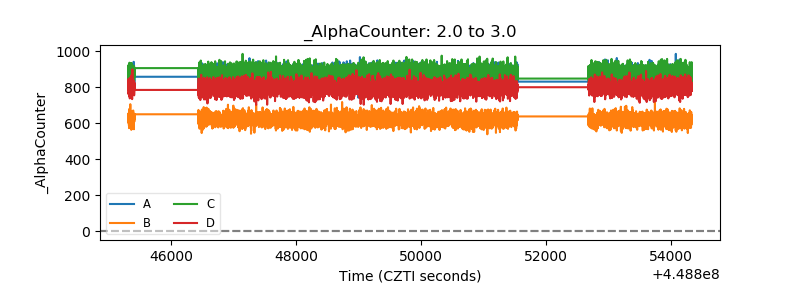 |
| _CPM_Rate | 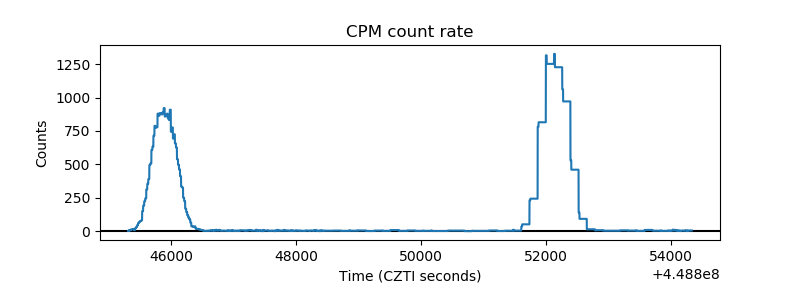 |
| CZT Counter | 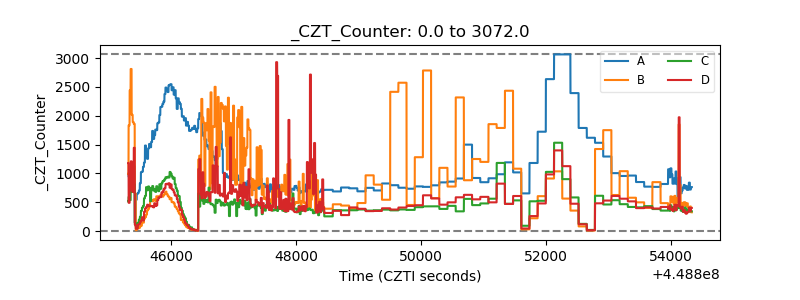 |
| +2.5 Volts monitor | 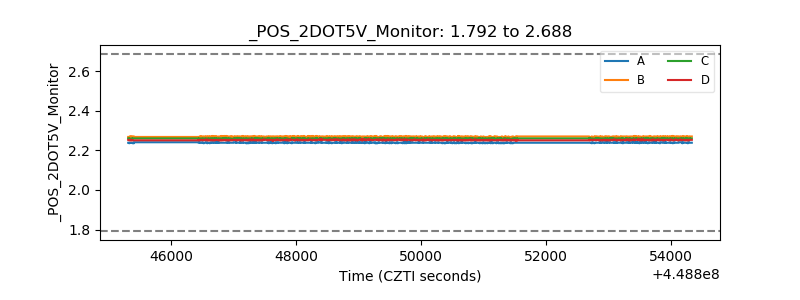 |
| +5 Volts monitor | 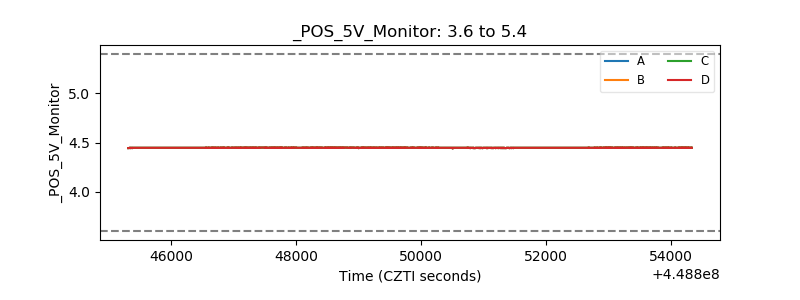 |
| _ROLL_ROT | 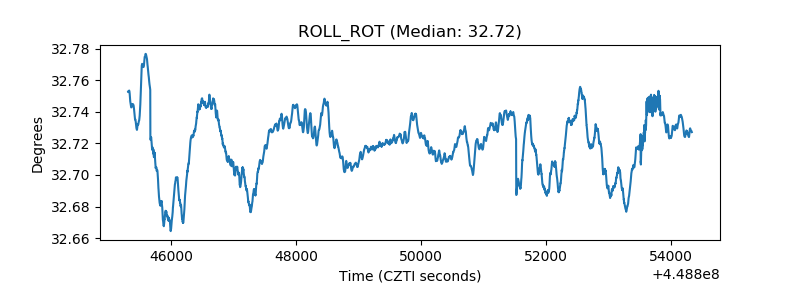 |
| _Roll_DEC | 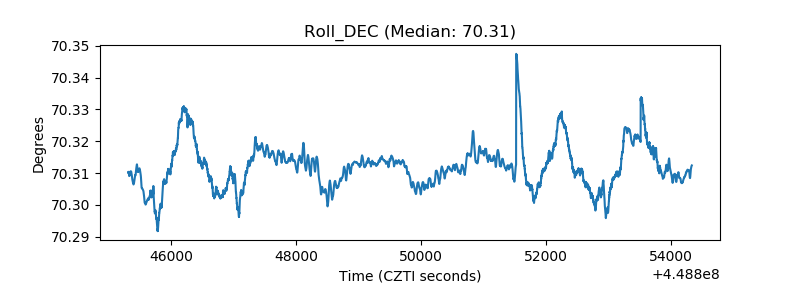 |
| _Roll_RA | 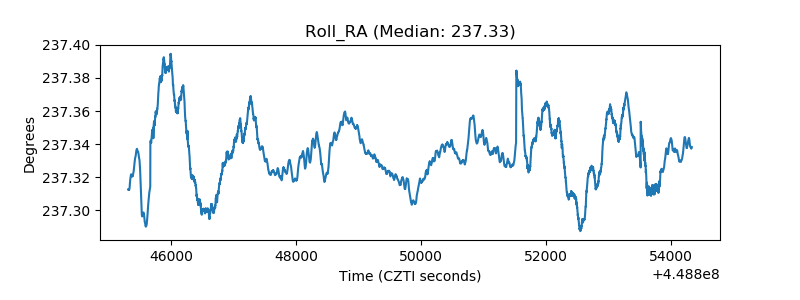 |
| Veto Counter | 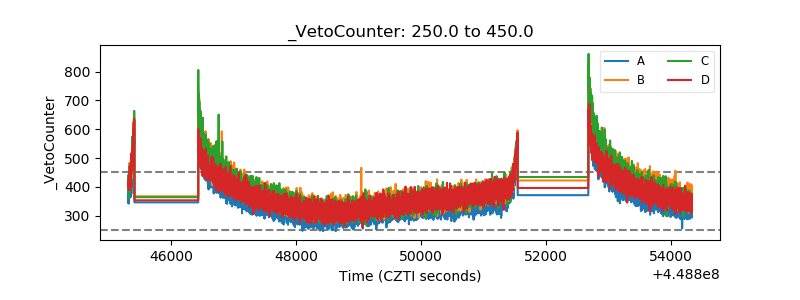 |