| Param | Original file | Final file |
|---|---|---|
| Filename | modeM0/AS1C07_001T01_9000006136_45879cztM0_level2.fits | modeM0/AS1C07_001T01_9000006136_45879cztM0_level2_quad_clean.evt |
| Size (bytes) | 453,640,320 | 100,990,080 |
| Size | 432.6 MB | 96.3 MB |
| Events in quadrant A | 5,274,148 | 671,885 |
| Events in quadrant B | 5,353,469 | 652,254 |
| Events in quadrant C | 2,556,601 | 696,075 |
| Events in quadrant D | 3,138,742 | 615,972 |
| Mode M9 | |||
|---|---|---|---|
| Quadrant | BADHDUFLAG | Total packets | Discarded packets |
| A | 0 | 12 | 0 |
| B | 0 | 12 | 0 |
| C | 0 | 12 | 0 |
| D | 0 | 12 | 0 |
| Mode SS | |||
|---|---|---|---|
| Quadrant | BADHDUFLAG | Total packets | Discarded packets |
| A | 0 | 122 | 0 |
| B | 0 | 122 | 0 |
| C | 0 | 122 | 0 |
| D | 0 | 122 | 0 |
| Mode M0 | |||
|---|---|---|---|
| Quadrant | BADHDUFLAG | Total packets | Discarded packets |
| A | 0 | 19960 | 1 |
| B | 0 | 20064 | 1 |
| C | 0 | 12212 | 1 |
| D | 0 | 13939 | 1 |
| Quadrant | Total seconds | Saturated seconds | Saturation percentage |
|---|---|---|---|
| A | 6042 | 105 | 1.737835% |
| B | 6042 | 672 | 11.122145% |
| C | 6043 | 4 | 0.066192% |
| D | 6043 | 121 | 2.002317% |
Noise dominated data is calculated using 1-second bins in cleaned event files. If a bin has >2000 counts, and if more than 50% of those come from <1% of pixels, then it is considered to be noise-dominated and hence unusable.
| Quadrant | # 1 sec bins | Bins with >0 counts | Bins with >2000 counts | High rate bins dominated by noise | Noise dominated (total time) | Noise dominated (detector-on time) | Marked lightcurve |
|---|---|---|---|---|---|---|---|
| A | 7247 | 6043 | 32 | 32 | 0.44% | 0.53% | 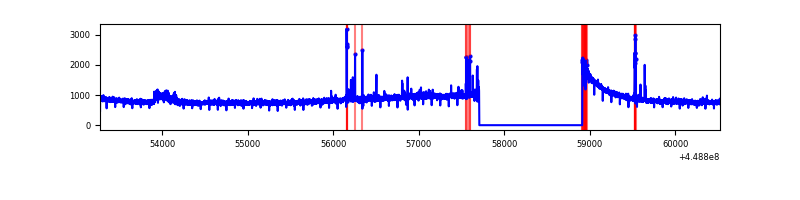 |
| B | 7247 | 6043 | 442 | 442 | 6.10% | 7.31% | 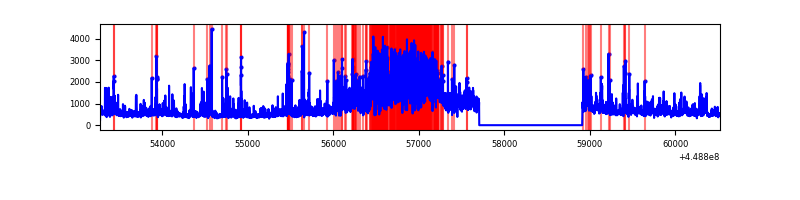 |
| C | 7248 | 6044 | 0 | 0 | 0.00% | 0.00% | 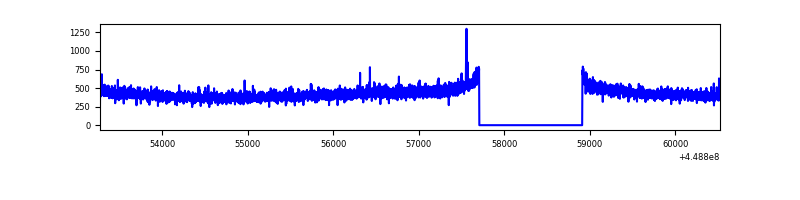 |
| D | 7248 | 6044 | 93 | 93 | 1.28% | 1.54% | 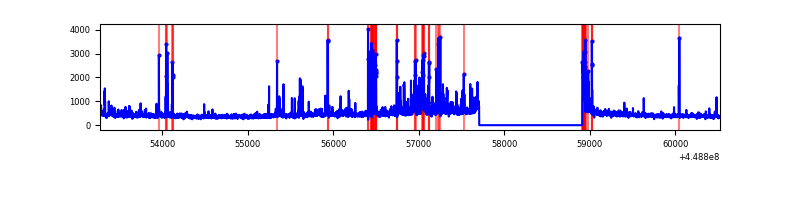 |
Top three noisy pixels from each quadrant. If the there are fewer than three noisy pixels in the level2.evt file, extra rows are filled as -1
| Pixel properties | Quadrant properties | ||||||
|---|---|---|---|---|---|---|---|
| Quadrant | DetID | PixID | Counts | Sigma | Mean | Median | Sigma |
| A | 10 | 83 | 2590081 | 19239.42 | 654 | 641 | 134.6 |
| A | 0 | 247 | 105465 | 778.84 | 654 | 641 | 134.6 |
| A | 4 | 0 | 28864 | 209.7 | 654 | 641 | 134.6 |
| B | 3 | 112 | 2619456 | 21296.8 | 637 | 618 | 123.0 |
| B | 4 | 171 | 132260 | 1070.53 | 637 | 618 | 123.0 |
| B | 0 | 186 | 20762 | 163.81 | 637 | 618 | 123.0 |
| C | 3 | 233 | 8174 | 49.81 | 651 | 656 | 150.9 |
| C | 9 | 237 | 6257 | 37.11 | 651 | 656 | 150.9 |
| C | 14 | 67 | 4809 | 27.52 | 651 | 656 | 150.9 |
| D | 13 | 249 | 307059 | 1915.09 | 636 | 614 | 160.0 |
| D | 1 | 52 | 129968 | 808.38 | 636 | 614 | 160.0 |
| D | 2 | 249 | 67838 | 420.11 | 636 | 614 | 160.0 |
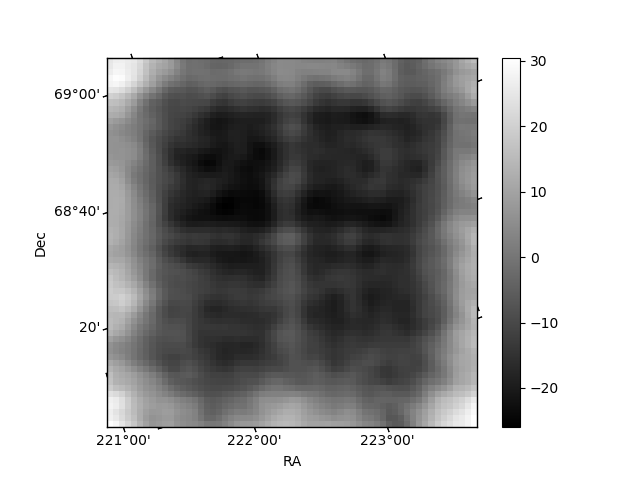
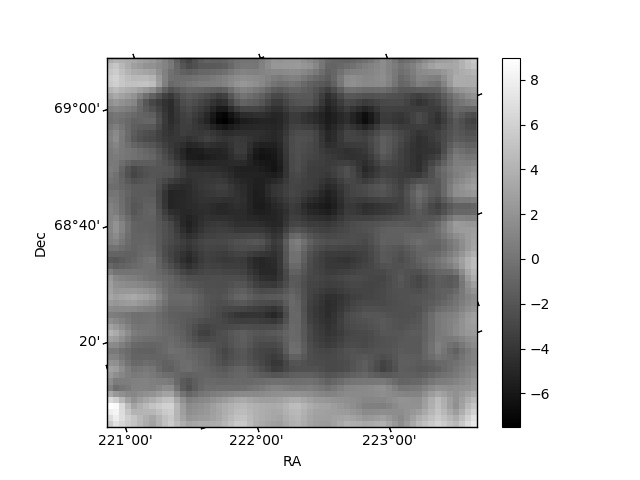
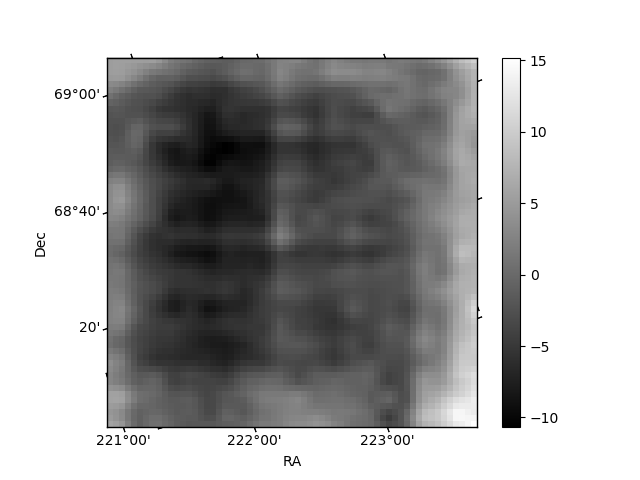
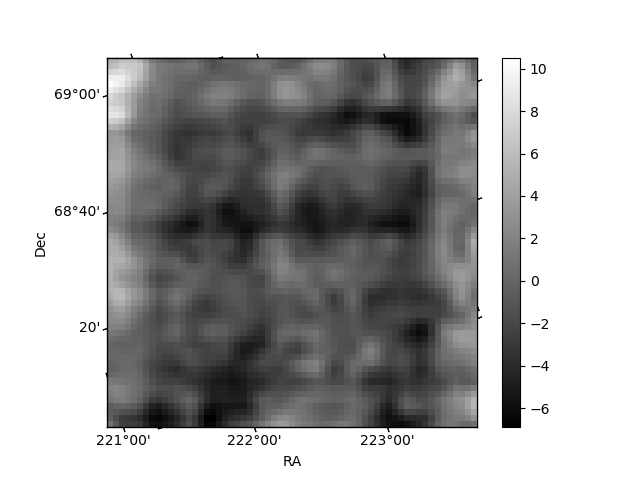
Histogram calculated using DETX and DETY for each event in the final _common_clean file
| Quadrant A | 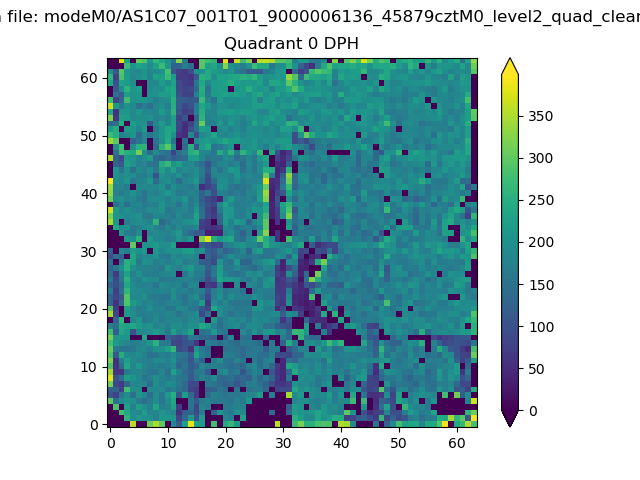 |
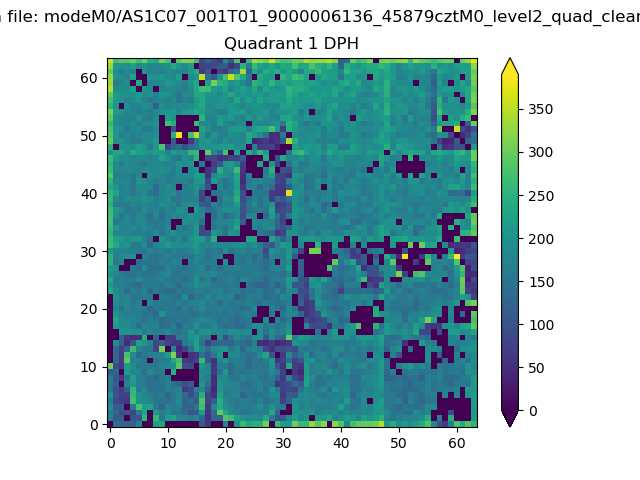 |
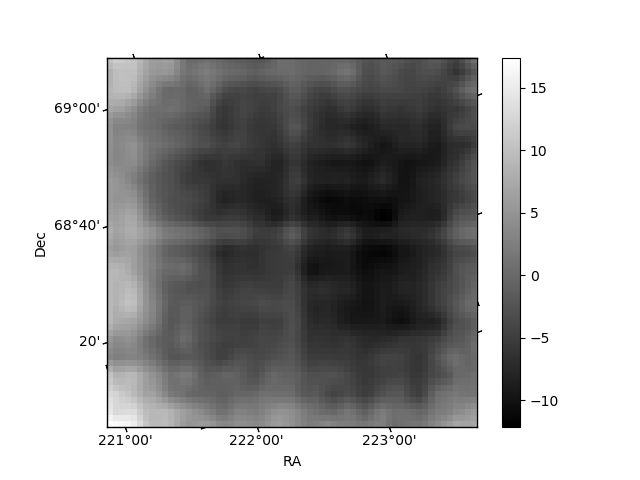
Quadrant B |
|---|---|---|---|
| Quadrant D | 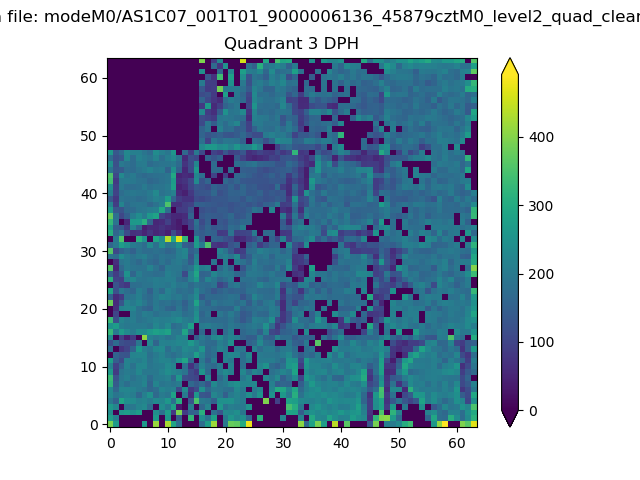 |
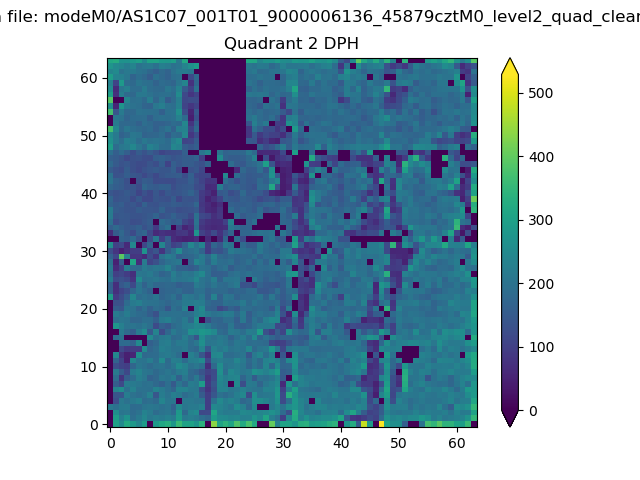 |
Quadrant C |
| Plot type | Count rate plots | Images |
|---|---|---|
| Comparison with Poisson distribution Blue bars denote a histogram of data divided into 1 sec bins. Red curve is a Poisson curve with rate = median count rate of data. |
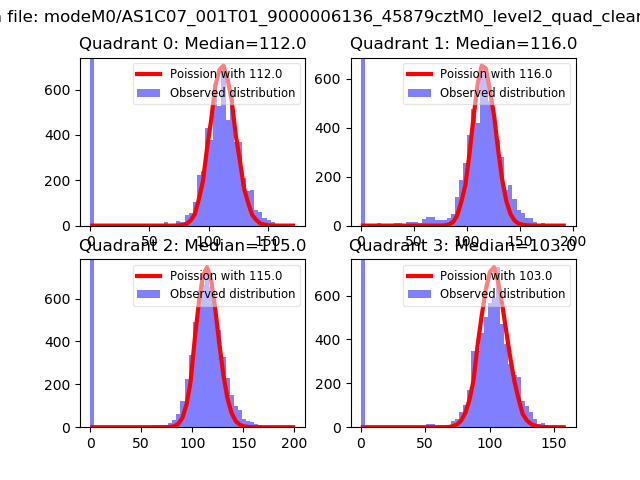 |
 |
| Quadrant-wise count rates Data is divided into 100 sec bins |
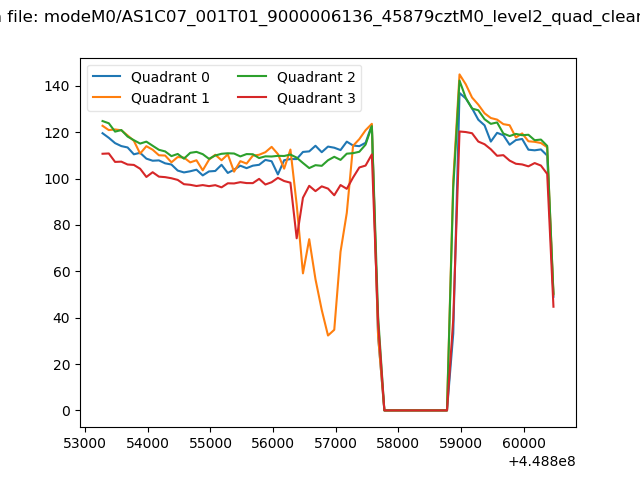 |
|
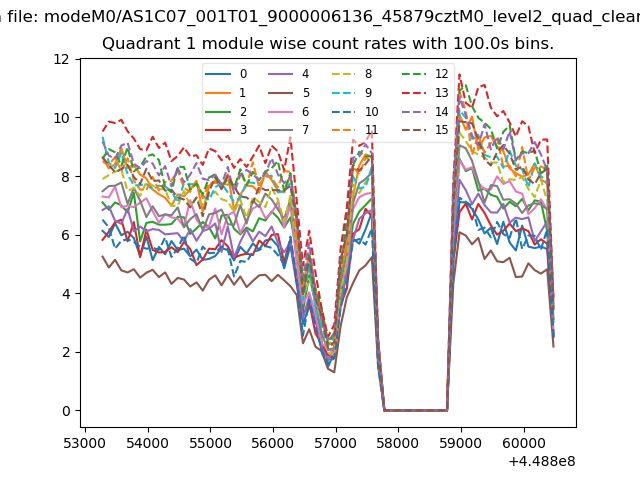
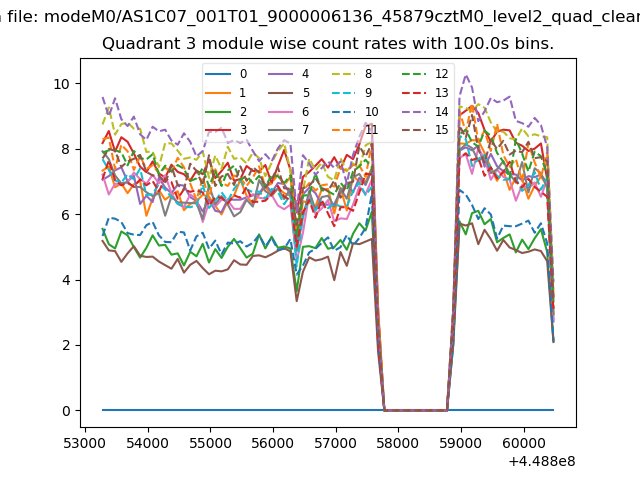
| Module-wise count rates for Quadrant A Data is divided into 100 sec bins |
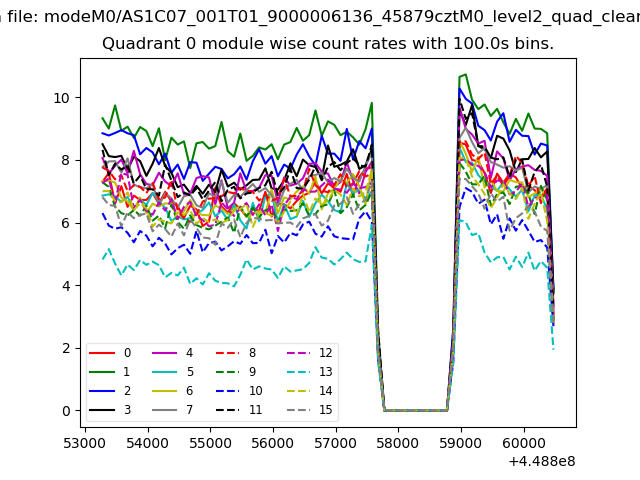 |
 |
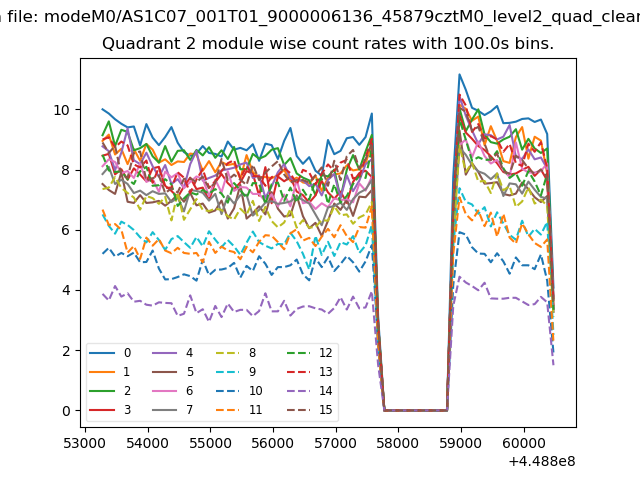
| Module-wise count rates for Quadrant B Data is divided into 100 sec bins |
 |
 |
| Module-wise count rates for Quadrant C Data is divided into 100 sec bins |
 |
 |
| Module-wise count rates for Quadrant D Data is divided into 100 sec bins |
 |
 |
| Parameter | Plot |
|---|---|
| CZT HV Monitor | 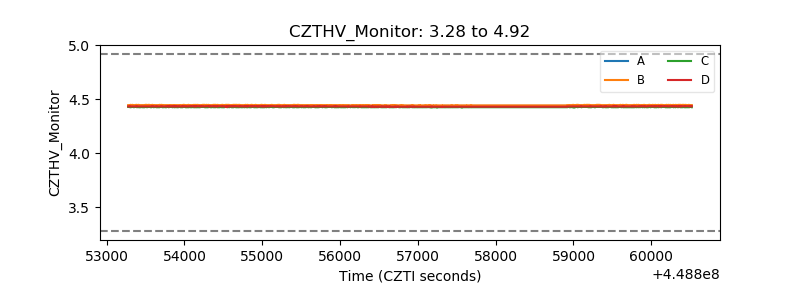 |
| D_VDD | 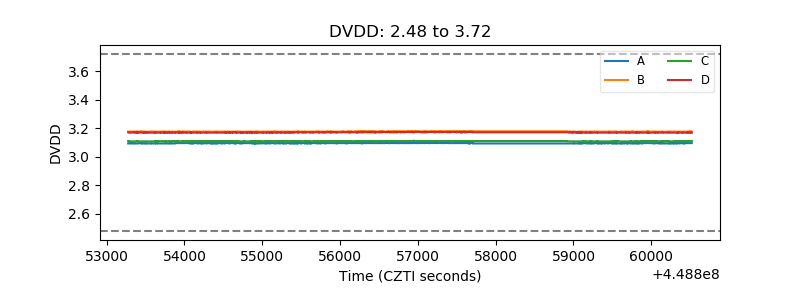 |
| Temperature 1 | 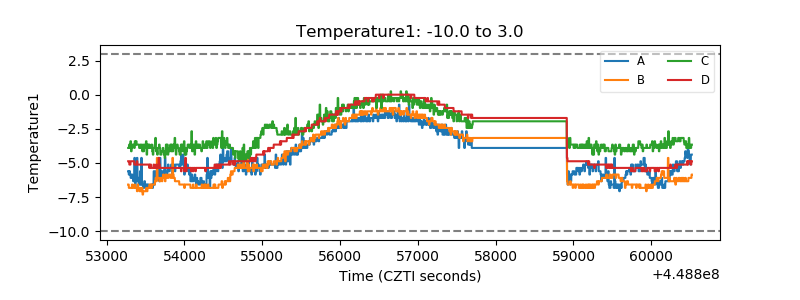 |
| Veto HV Monitor | 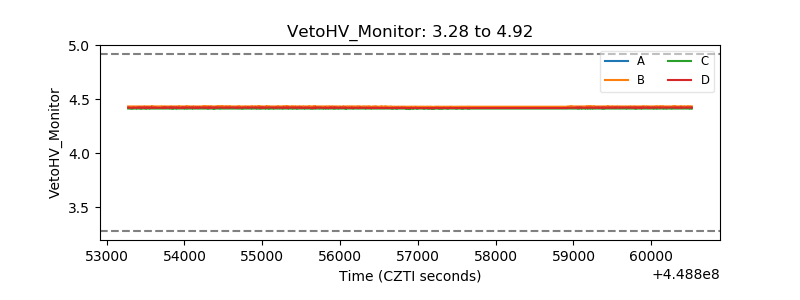 |
| Veto LLD | 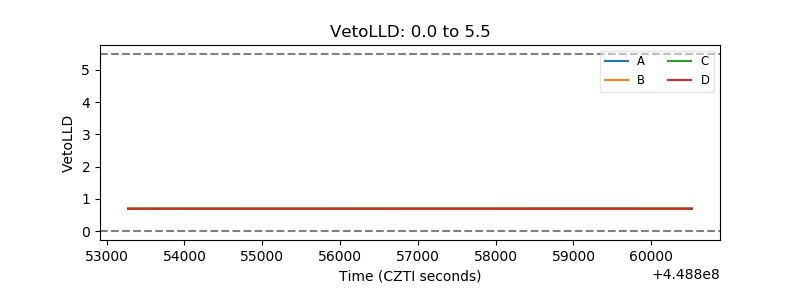 |
| Alpha Counter | 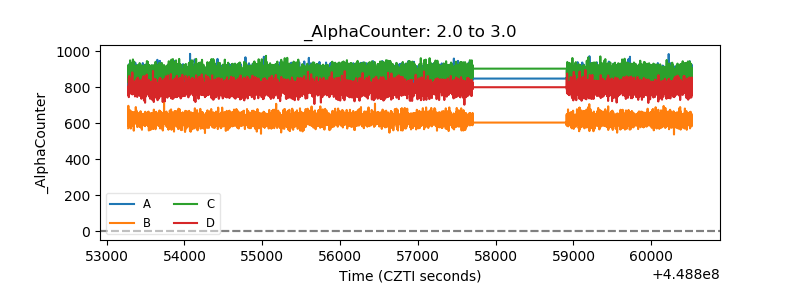 |
| _CPM_Rate | 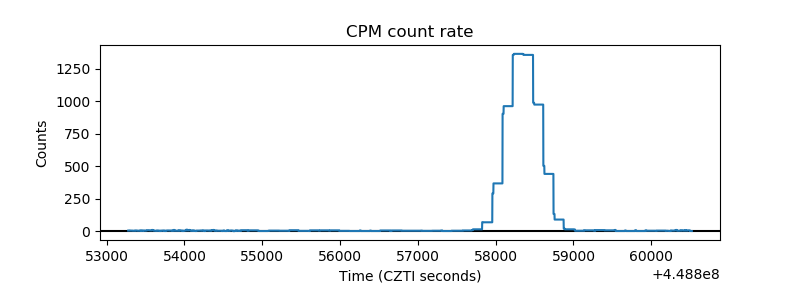 |
| CZT Counter | 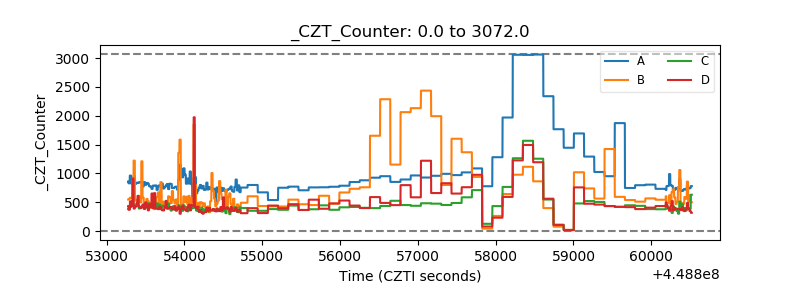 |
| +2.5 Volts monitor | 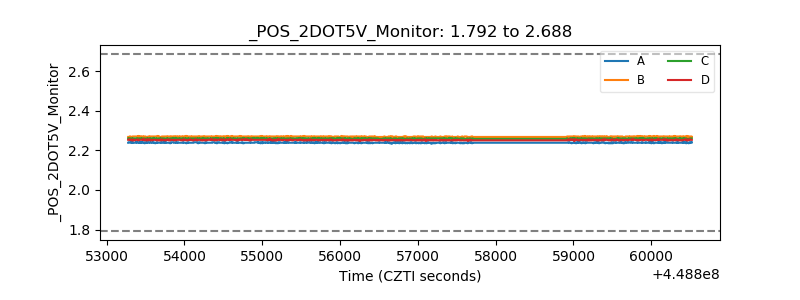 |
| +5 Volts monitor | 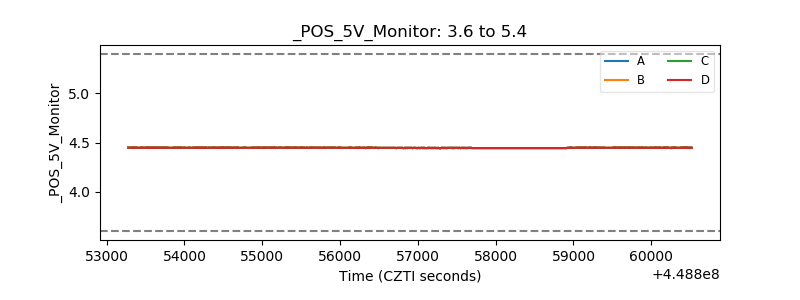 |
| _ROLL_ROT | 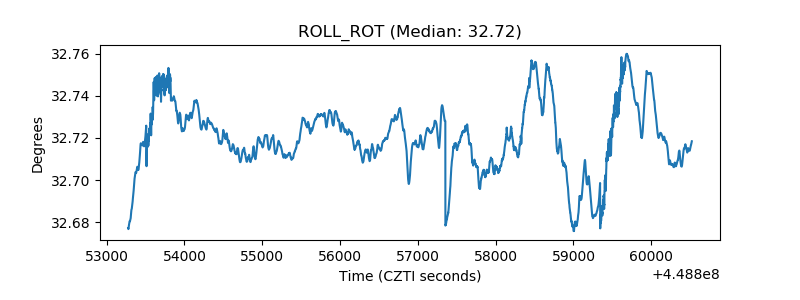 |
| _Roll_DEC | 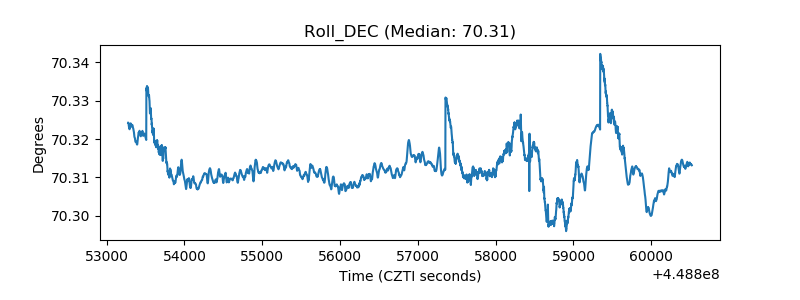 |
| _Roll_RA | 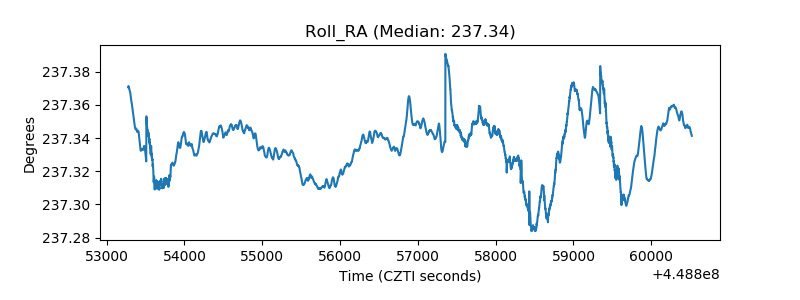 |
| Veto Counter | 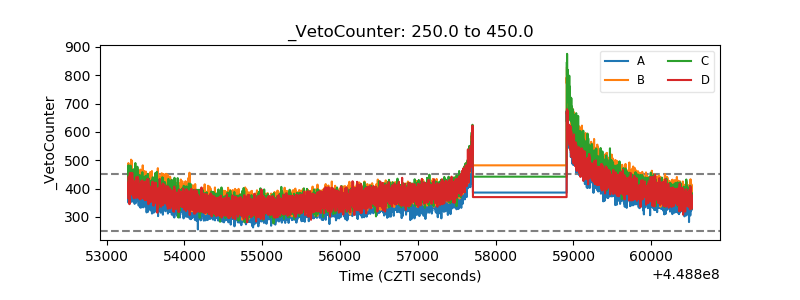 |