| Param | Original file | Final file |
|---|---|---|
| Filename | modeM0/AS1C07_001T01_9000006136_45880cztM0_level2.fits | modeM0/AS1C07_001T01_9000006136_45880cztM0_level2_quad_clean.evt |
| Size (bytes) | 504,463,680 | 94,507,200 |
| Size | 481.1 MB | 90.1 MB |
| Events in quadrant A | 5,028,380 | 655,484 |
| Events in quadrant B | 7,379,989 | 545,312 |
| Events in quadrant C | 2,663,933 | 662,636 |
| Events in quadrant D | 3,150,481 | 592,330 |
| Mode M9 | |||
|---|---|---|---|
| Quadrant | BADHDUFLAG | Total packets | Discarded packets |
| A | 0 | 12 | 0 |
| B | 0 | 12 | 0 |
| C | 0 | 12 | 0 |
| D | 0 | 12 | 0 |
| Mode SS | |||
|---|---|---|---|
| Quadrant | BADHDUFLAG | Total packets | Discarded packets |
| A | 0 | 118 | 0 |
| B | 0 | 118 | 0 |
| C | 0 | 118 | 0 |
| D | 0 | 118 | 0 |
| Mode M0 | |||
|---|---|---|---|
| Quadrant | BADHDUFLAG | Total packets | Discarded packets |
| A | 0 | 18974 | 18 |
| B | 0 | 25980 | 16 |
| C | 0 | 12314 | 14 |
| D | 0 | 13812 | 19 |
| Quadrant | Total seconds | Saturated seconds | Saturation percentage |
|---|---|---|---|
| A | 5807 | 106 | 1.825383% |
| B | 5810 | 1494 | 25.714286% |
| C | 5807 | 54 | 0.929912% |
| D | 5803 | 139 | 2.395313% |
Noise dominated data is calculated using 1-second bins in cleaned event files. If a bin has >2000 counts, and if more than 50% of those come from <1% of pixels, then it is considered to be noise-dominated and hence unusable.
| Quadrant | # 1 sec bins | Bins with >0 counts | Bins with >2000 counts | High rate bins dominated by noise | Noise dominated (total time) | Noise dominated (detector-on time) | Marked lightcurve |
|---|---|---|---|---|---|---|---|
| A | 7000 | 5815 | 8 | 8 | 0.11% | 0.14% | 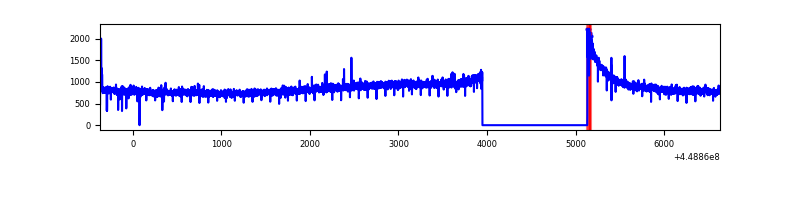 |
| B | 7001 | 5815 | 1031 | 1031 | 14.73% | 17.73% | 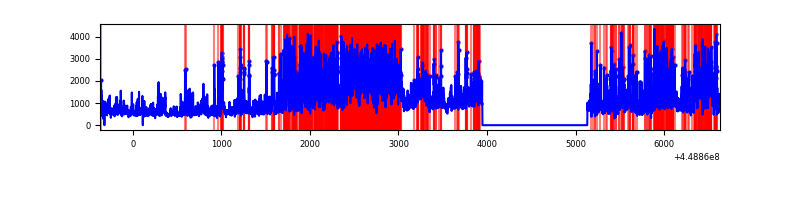 |
| C | 7001 | 5815 | 35 | 35 | 0.50% | 0.60% | 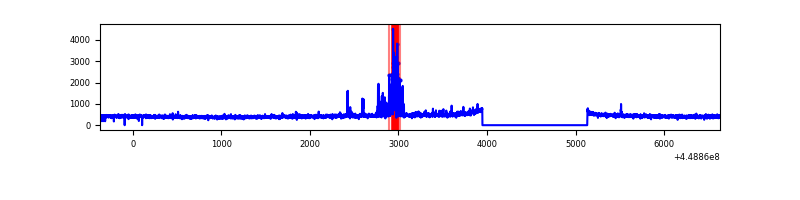 |
| D | 7001 | 5812 | 106 | 106 | 1.51% | 1.82% | 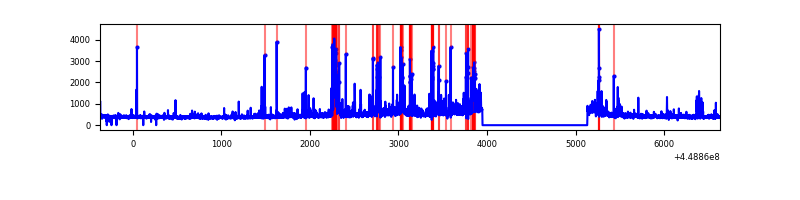 |
Top three noisy pixels from each quadrant. If the there are fewer than three noisy pixels in the level2.evt file, extra rows are filled as -1
| Pixel properties | Quadrant properties | ||||||
|---|---|---|---|---|---|---|---|
| Quadrant | DetID | PixID | Counts | Sigma | Mean | Median | Sigma |
| A | 10 | 83 | 2528221 | 19256.03 | 639 | 626 | 131.3 |
| A | 13 | 254 | 8713 | 61.61 | 639 | 626 | 131.3 |
| A | 4 | 0 | 8005 | 56.22 | 639 | 626 | 131.3 |
| B | 3 | 112 | 4876965 | 43582.64 | 581 | 565 | 111.9 |
| B | 4 | 171 | 92658 | 823.08 | 581 | 565 | 111.9 |
| B | 5 | 172 | 32007 | 281.01 | 581 | 565 | 111.9 |
| C | 12 | 2 | 180459 | 1230.45 | 628 | 630 | 146.1 |
| C | 3 | 233 | 13861 | 90.53 | 628 | 630 | 146.1 |
| C | 0 | 207 | 11622 | 75.21 | 628 | 630 | 146.1 |
| D | 1 | 52 | 225872 | 1477.64 | 617 | 600 | 152.5 |
| D | 13 | 249 | 206806 | 1352.58 | 617 | 600 | 152.5 |
| D | 2 | 249 | 131536 | 858.86 | 617 | 600 | 152.5 |
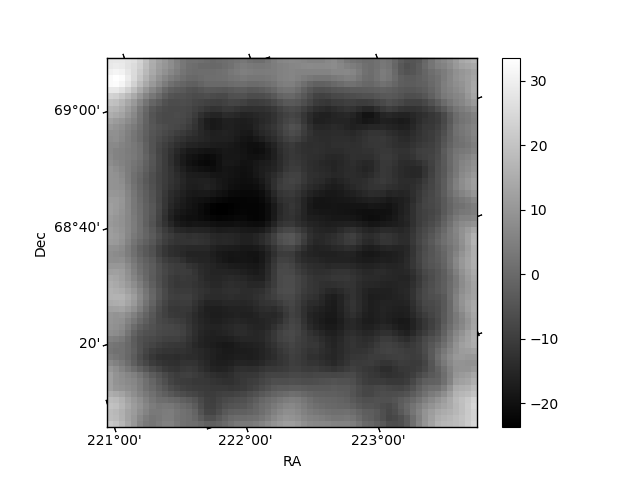
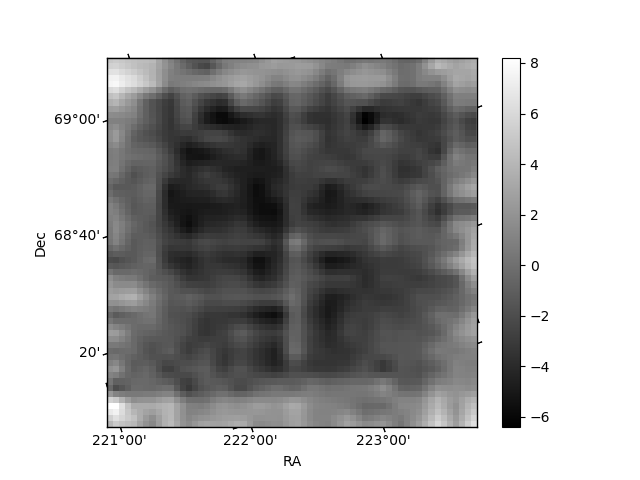
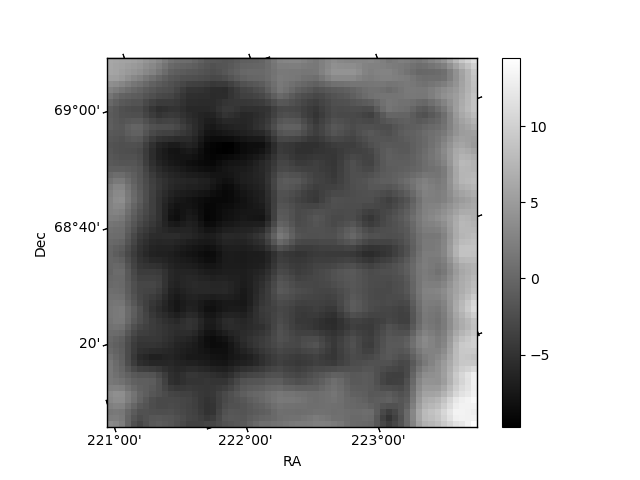
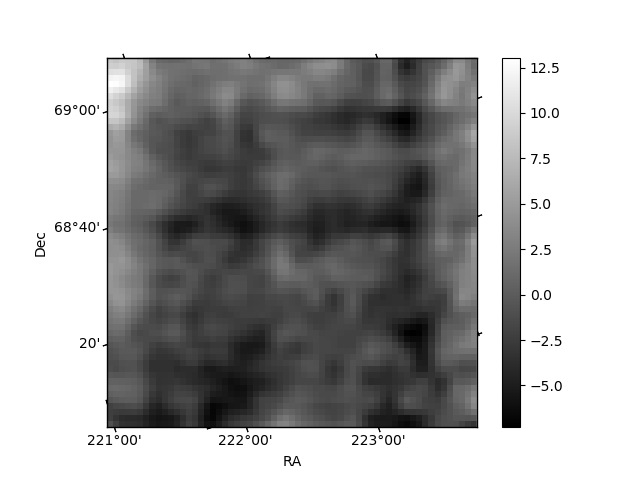
Histogram calculated using DETX and DETY for each event in the final _common_clean file
| Quadrant A | 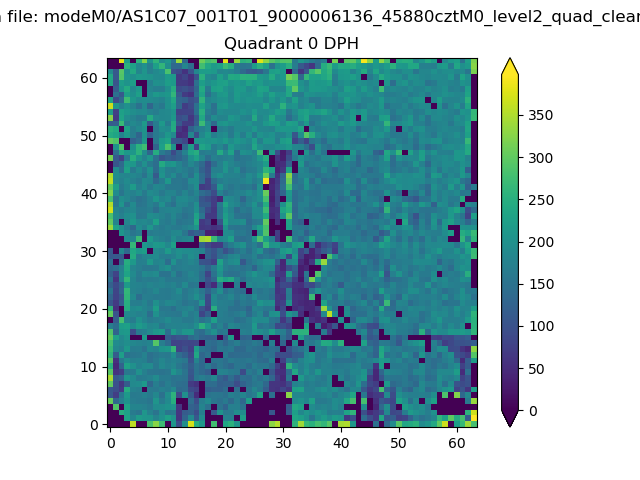 |
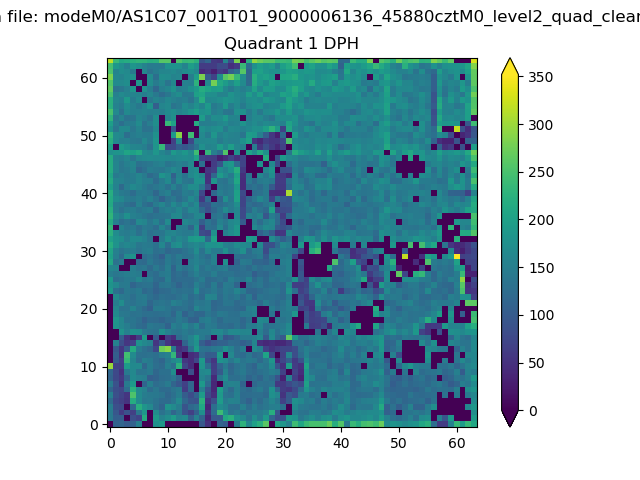 |
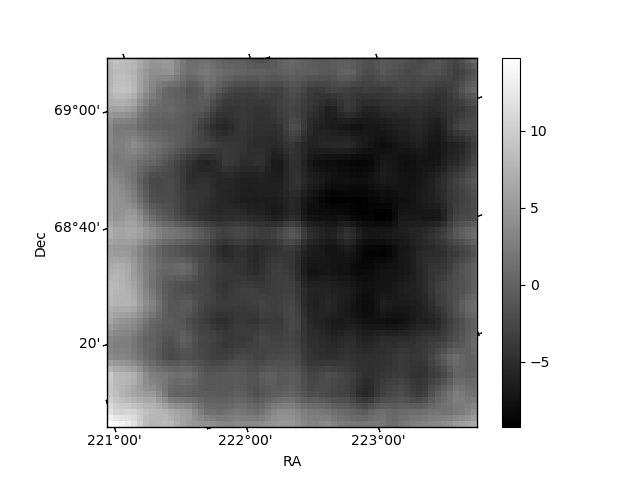
Quadrant B |
|---|---|---|---|
| Quadrant D | 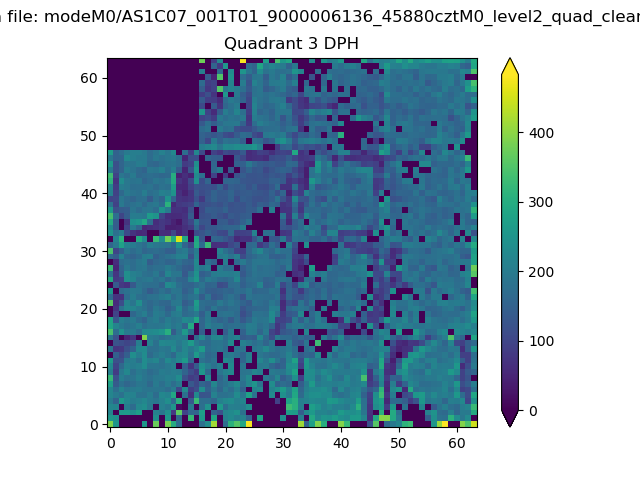 |
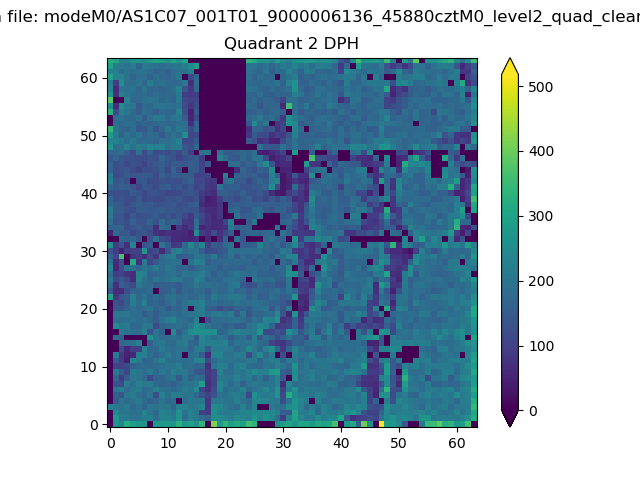 |
Quadrant C |
| Plot type | Count rate plots | Images |
|---|---|---|
| Comparison with Poisson distribution Blue bars denote a histogram of data divided into 1 sec bins. Red curve is a Poisson curve with rate = median count rate of data. |
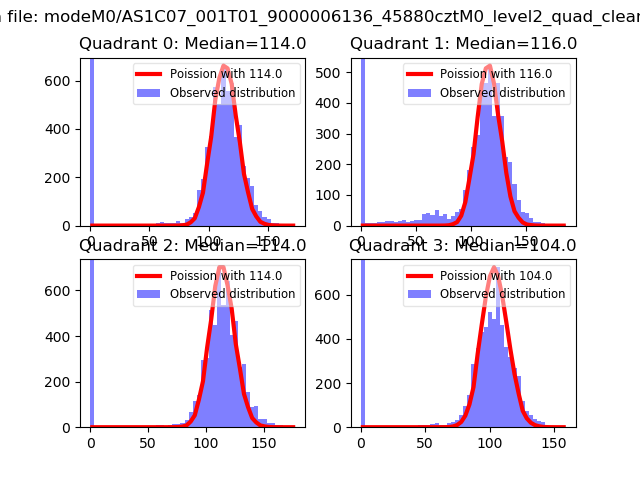 |
 |
| Quadrant-wise count rates Data is divided into 100 sec bins |
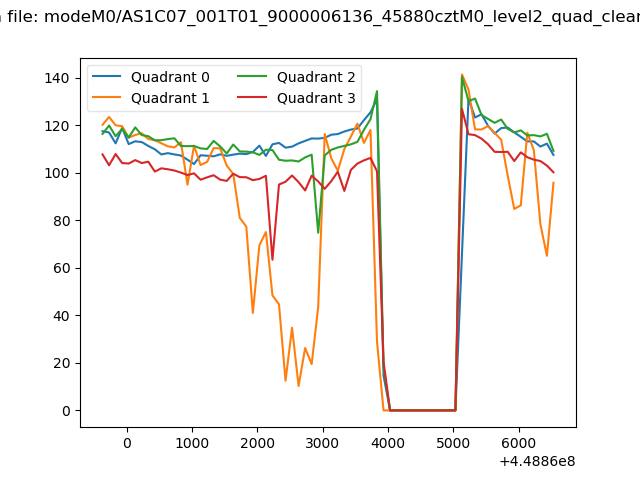 |
|
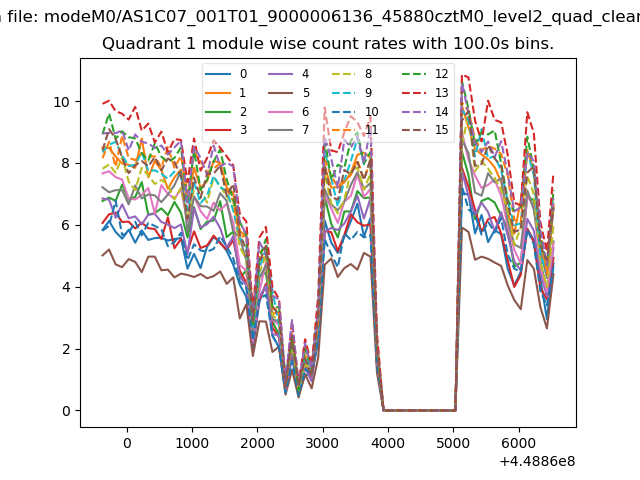
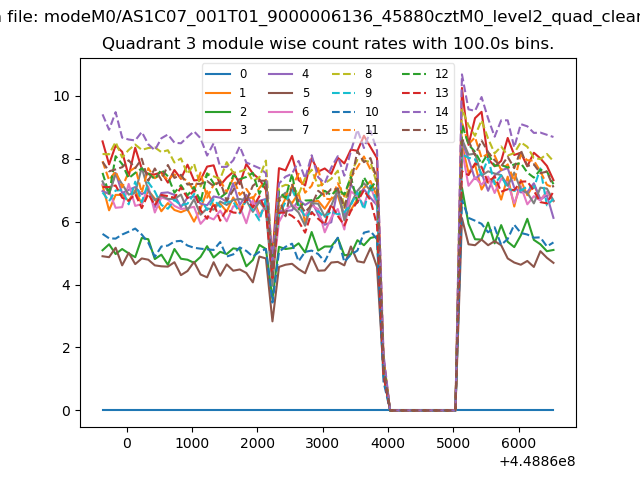
| Module-wise count rates for Quadrant A Data is divided into 100 sec bins |
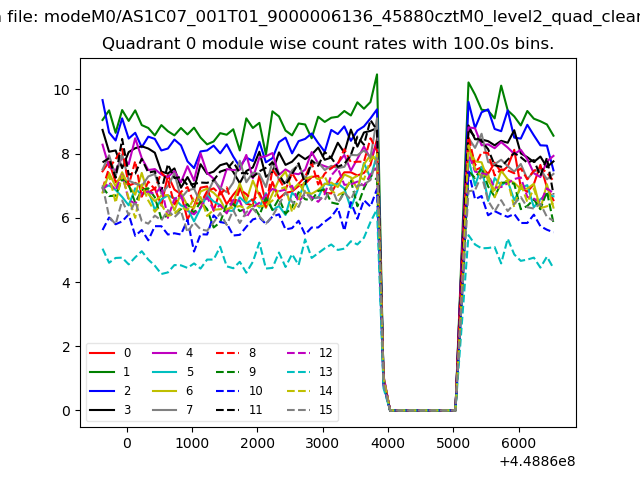 |
 |
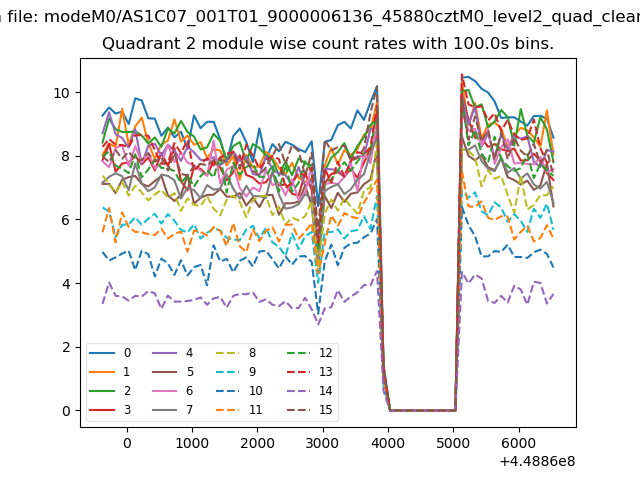
| Module-wise count rates for Quadrant B Data is divided into 100 sec bins |
 |
 |
| Module-wise count rates for Quadrant C Data is divided into 100 sec bins |
 |
 |
| Module-wise count rates for Quadrant D Data is divided into 100 sec bins |
 |
 |
| Parameter | Plot |
|---|---|
| CZT HV Monitor | 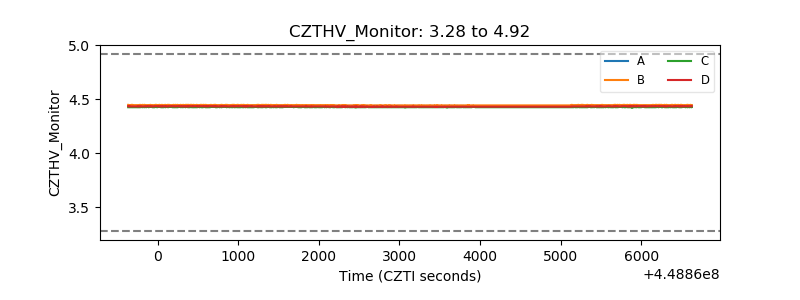 |
| D_VDD | 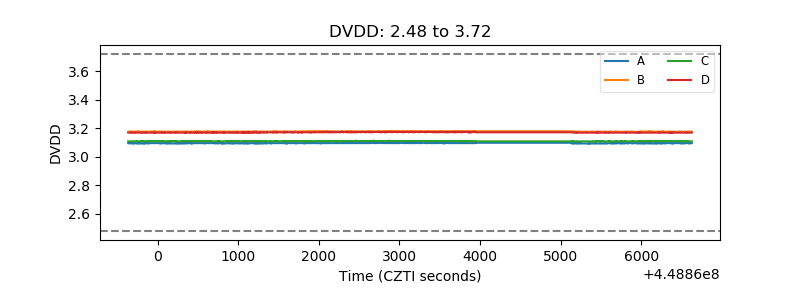 |
| Temperature 1 | 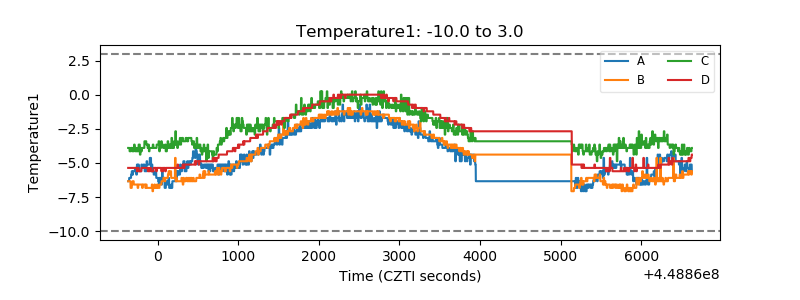 |
| Veto HV Monitor | 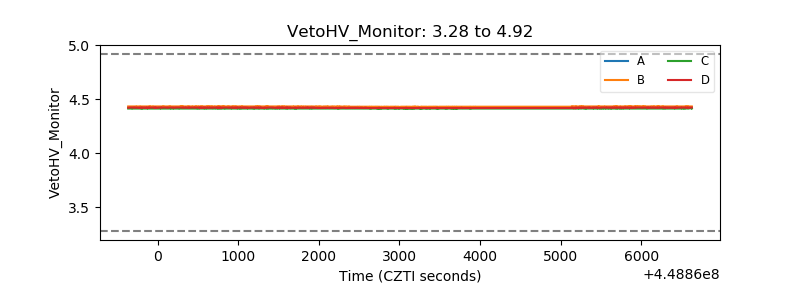 |
| Veto LLD | 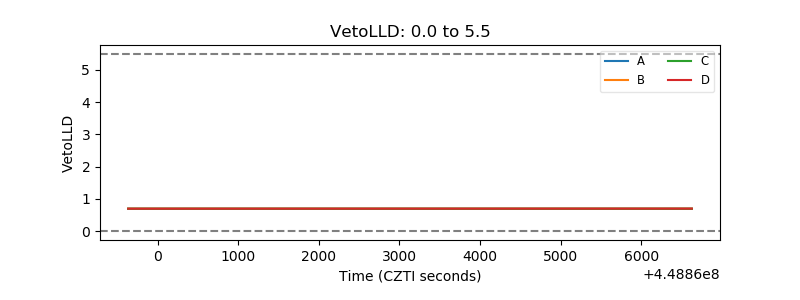 |
| Alpha Counter | 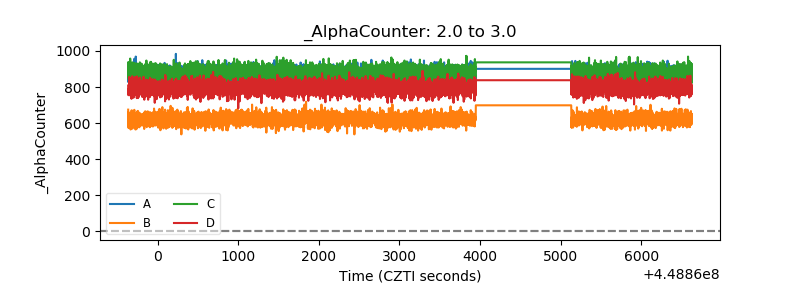 |
| _CPM_Rate | 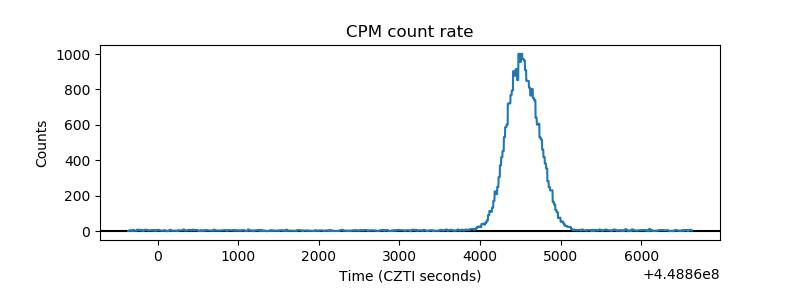 |
| CZT Counter | 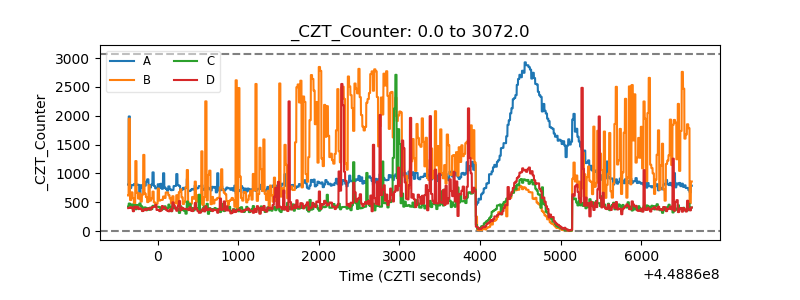 |
| +2.5 Volts monitor | 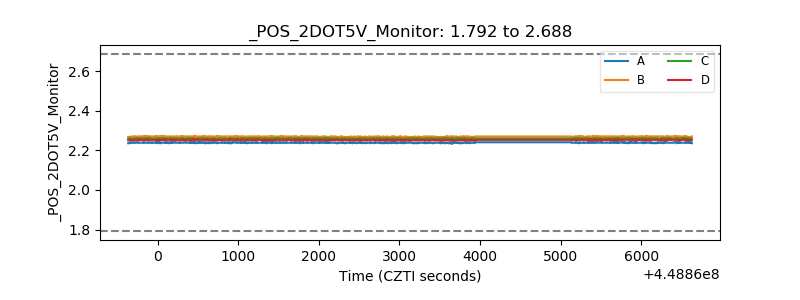 |
| +5 Volts monitor | 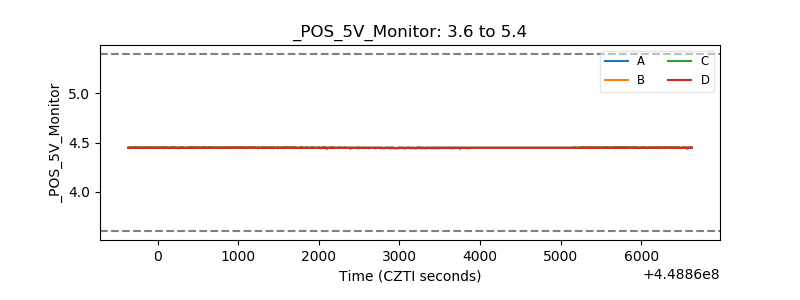 |
| _ROLL_ROT | 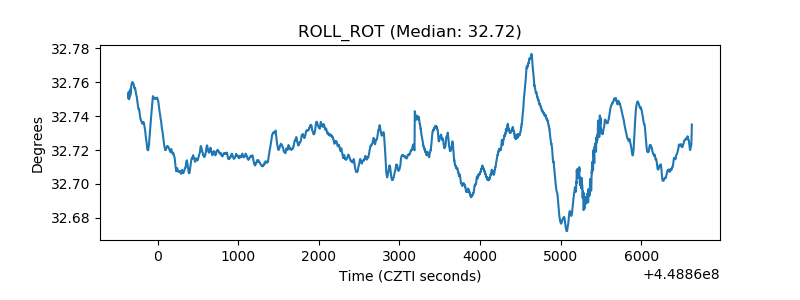 |
| _Roll_DEC | 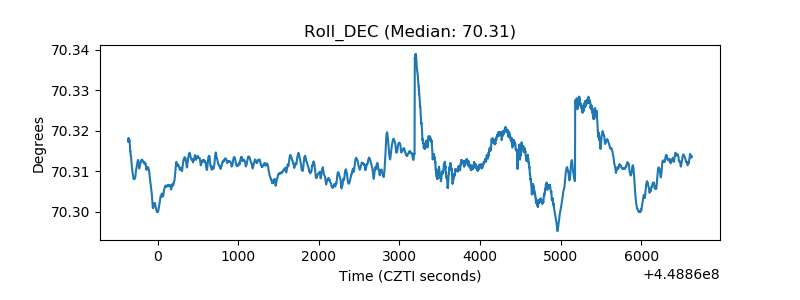 |
| _Roll_RA | 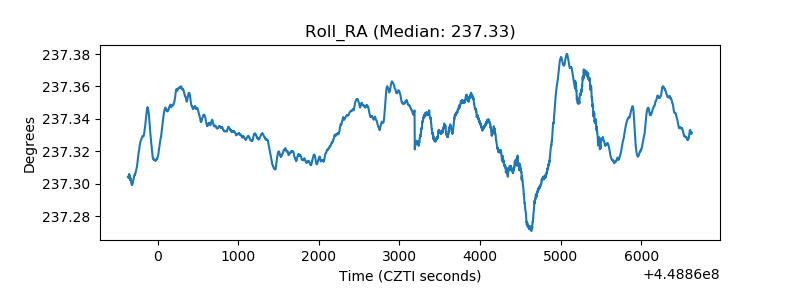 |
| Veto Counter | 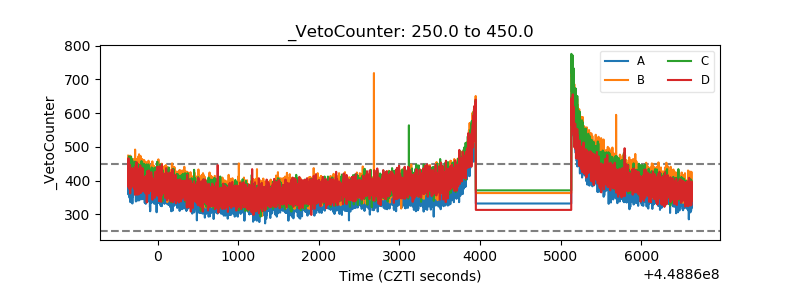 |