| Param | Original file | Final file |
|---|---|---|
| Filename | modeM0/AS1C07_001T01_9000006136_45882cztM0_level2.fits | modeM0/AS1C07_001T01_9000006136_45882cztM0_level2_quad_clean.evt |
| Size (bytes) | 717,589,440 | 94,896,000 |
| Size | 684.3 MB | 90.5 MB |
| Events in quadrant A | 5,789,802 | 720,957 |
| Events in quadrant B | 13,679,112 | 279,605 |
| Events in quadrant C | 2,874,147 | 743,934 |
| Events in quadrant D | 3,696,618 | 659,339 |
| Mode M9 | |||
|---|---|---|---|
| Quadrant | BADHDUFLAG | Total packets | Discarded packets |
| A | 0 | 9 | 0 |
| B | 0 | 9 | 0 |
| C | 0 | 9 | 0 |
| D | 0 | 9 | 0 |
| Mode SS | |||
|---|---|---|---|
| Quadrant | BADHDUFLAG | Total packets | Discarded packets |
| A | 0 | 136 | 0 |
| B | 0 | 136 | 0 |
| C | 0 | 136 | 0 |
| D | 0 | 136 | 0 |
| Mode M0 | |||
|---|---|---|---|
| Quadrant | BADHDUFLAG | Total packets | Discarded packets |
| A | 0 | 21602 | 3 |
| B | 0 | 45284 | 1 |
| C | 0 | 13725 | 1 |
| D | 0 | 16015 | 1 |
| Quadrant | Total seconds | Saturated seconds | Saturation percentage |
|---|---|---|---|
| A | 6736 | 215 | 3.191805% |
| B | 6737 | 4690 | 69.615556% |
| C | 6737 | 39 | 0.578893% |
| D | 6737 | 215 | 3.191331% |
Noise dominated data is calculated using 1-second bins in cleaned event files. If a bin has >2000 counts, and if more than 50% of those come from <1% of pixels, then it is considered to be noise-dominated and hence unusable.
| Quadrant | # 1 sec bins | Bins with >0 counts | Bins with >2000 counts | High rate bins dominated by noise | Noise dominated (total time) | Noise dominated (detector-on time) | Marked lightcurve |
|---|---|---|---|---|---|---|---|
| A | 7606 | 6737 | 13 | 13 | 0.17% | 0.19% | 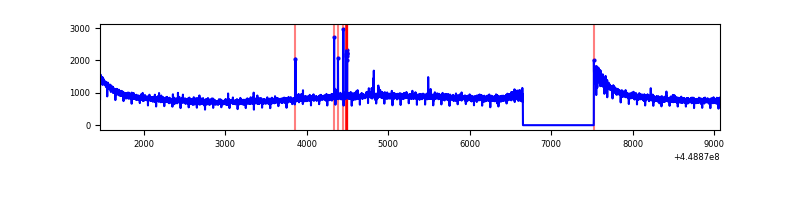 |
| B | 7607 | 6737 | 3660 | 3660 | 48.11% | 54.33% | 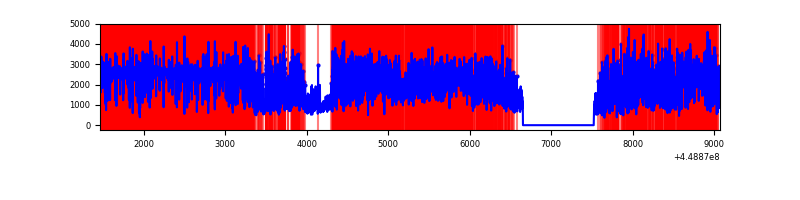 |
| C | 7607 | 6738 | 2 | 2 | 0.03% | 0.03% | 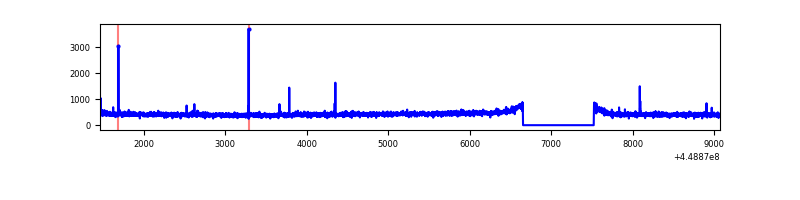 |
| D | 7607 | 6738 | 128 | 128 | 1.68% | 1.90% | 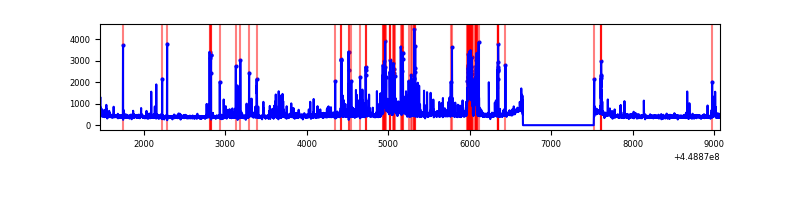 |
Top three noisy pixels from each quadrant. If the there are fewer than three noisy pixels in the level2.evt file, extra rows are filled as -1
| Pixel properties | Quadrant properties | ||||||
|---|---|---|---|---|---|---|---|
| Quadrant | DetID | PixID | Counts | Sigma | Mean | Median | Sigma |
| A | 10 | 83 | 2892016 | 18916.15 | 735 | 720 | 152.8 |
| A | 0 | 247 | 17575 | 110.27 | 735 | 720 | 152.8 |
| A | 2 | 79 | 13300 | 82.3 | 735 | 720 | 152.8 |
| B | 3 | 112 | 11522131 | 116913.53 | 506 | 492 | 98.5 |
| B | 12 | 18 | 51289 | 515.45 | 506 | 492 | 98.5 |
| B | 15 | 54 | 20247 | 200.46 | 506 | 492 | 98.5 |
| C | 12 | 2 | 25795 | 148.38 | 728 | 731 | 168.9 |
| C | 3 | 233 | 5629 | 29.0 | 728 | 731 | 168.9 |
| C | 13 | 61 | 4952 | 24.99 | 728 | 731 | 168.9 |
| D | 13 | 249 | 424820 | 2378.69 | 717 | 693 | 178.3 |
| D | 5 | 171 | 178947 | 999.73 | 717 | 693 | 178.3 |
| D | 2 | 249 | 123255 | 687.38 | 717 | 693 | 178.3 |
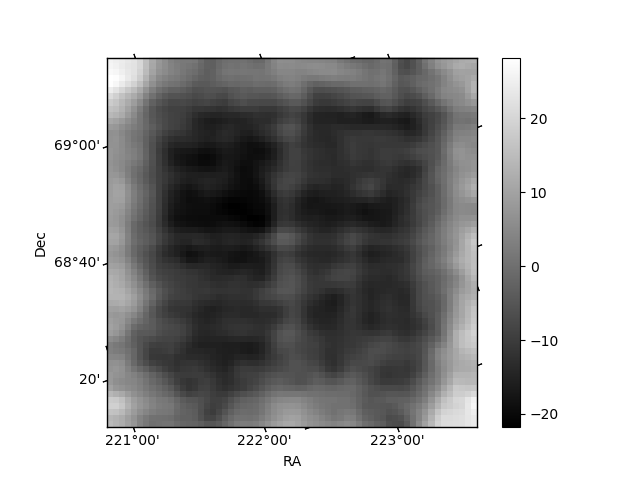
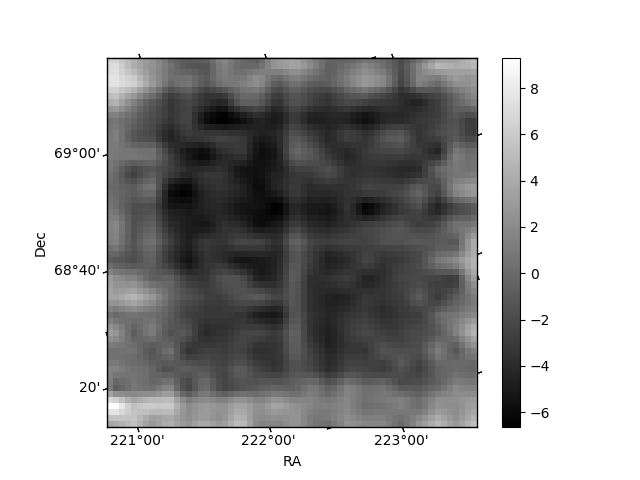
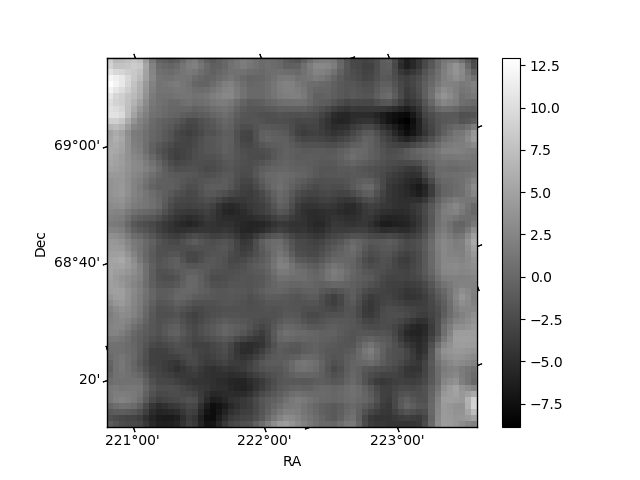
Histogram calculated using DETX and DETY for each event in the final _common_clean file
| Quadrant A | 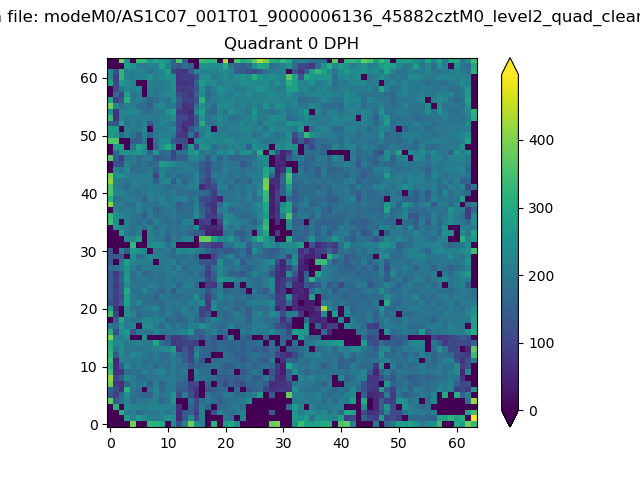 |
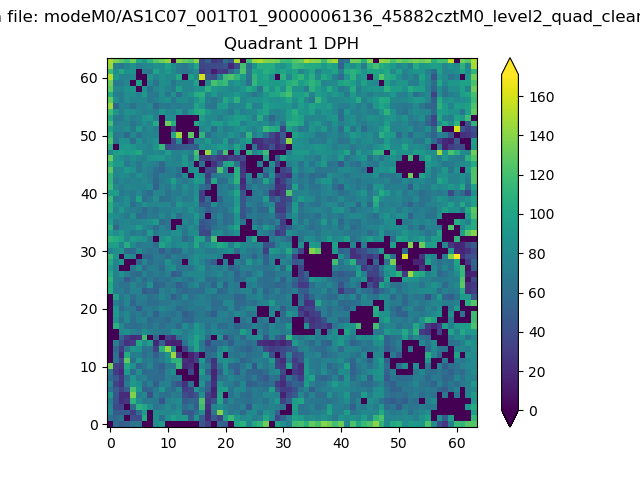 |
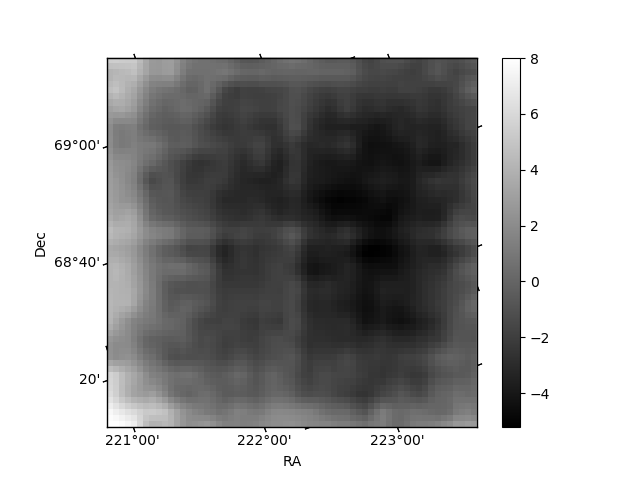
Quadrant B |
|---|---|---|---|
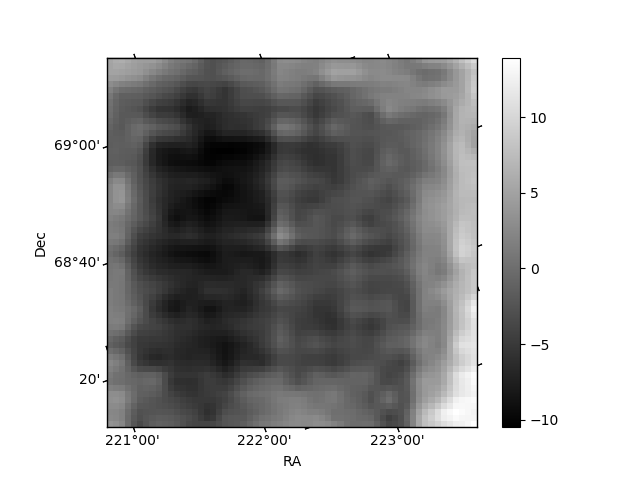
| Quadrant D | 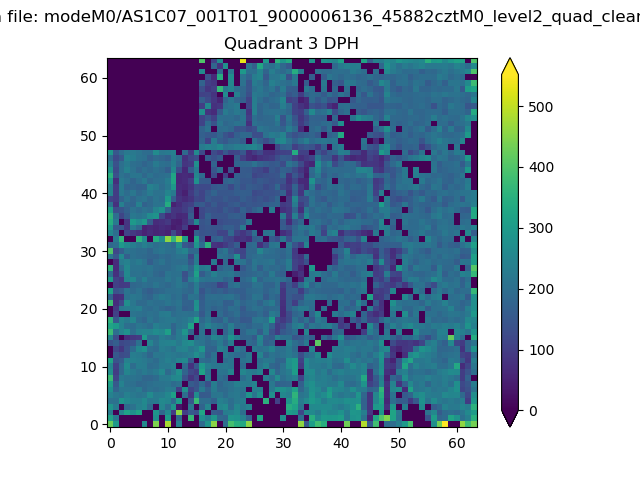 |
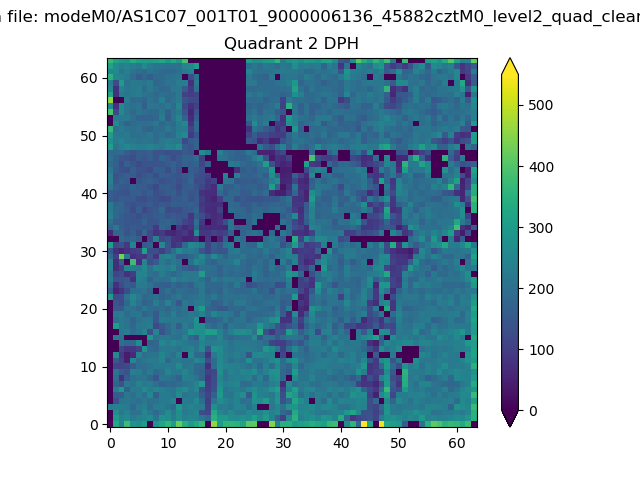 |
Quadrant C |
| Plot type | Count rate plots | Images |
|---|---|---|
| Comparison with Poisson distribution Blue bars denote a histogram of data divided into 1 sec bins. Red curve is a Poisson curve with rate = median count rate of data. |
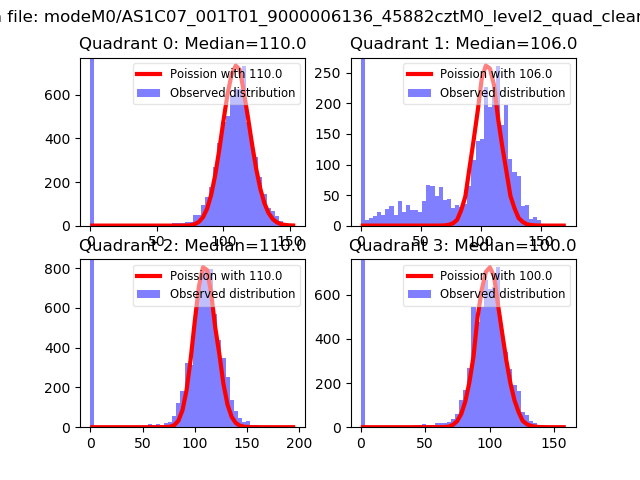 |
 |
| Quadrant-wise count rates Data is divided into 100 sec bins |
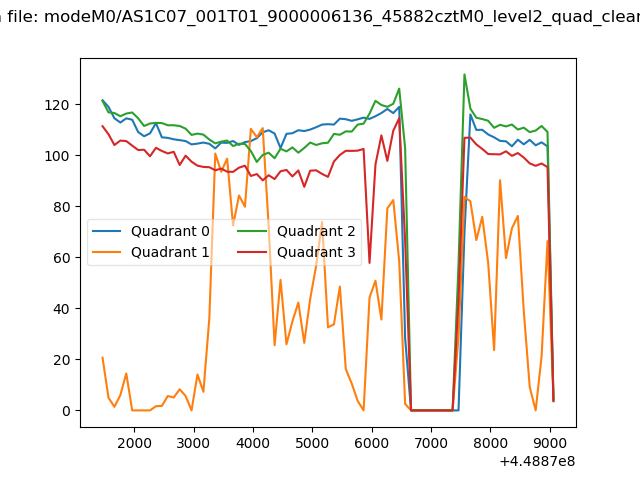 |
|
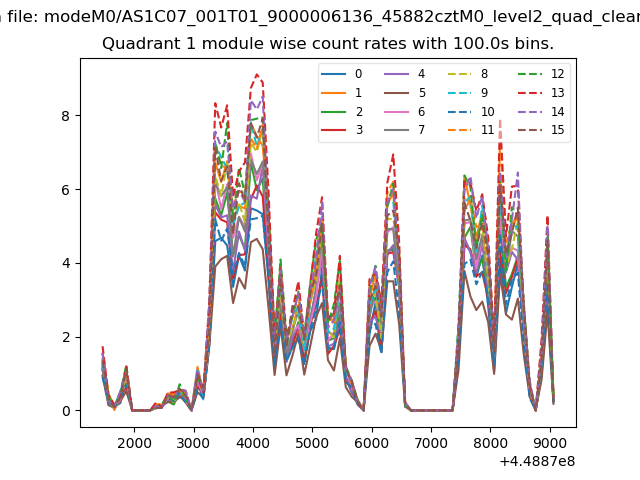
| Module-wise count rates for Quadrant A Data is divided into 100 sec bins |
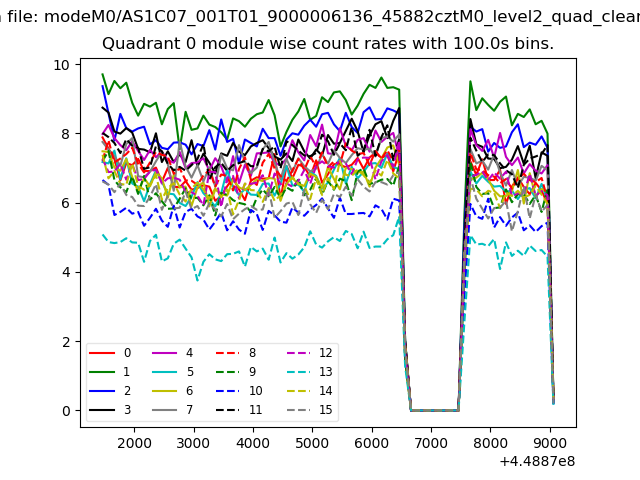 |
 |
| Module-wise count rates for Quadrant B Data is divided into 100 sec bins |
 |
 |
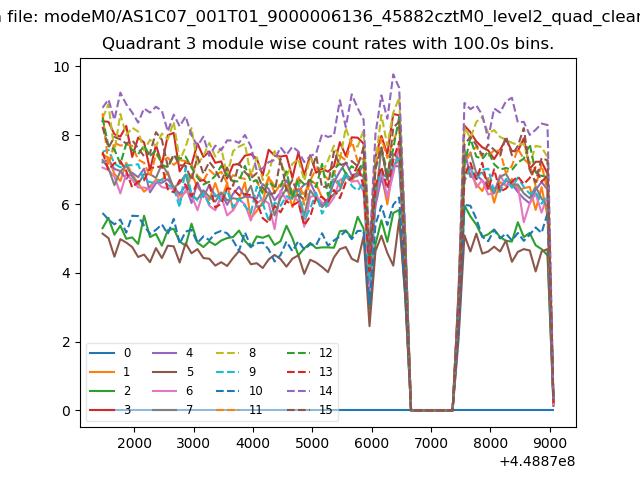
| Module-wise count rates for Quadrant C Data is divided into 100 sec bins |
 |
 |
| Module-wise count rates for Quadrant D Data is divided into 100 sec bins |
 |
 |
| Parameter | Plot |
|---|---|
| CZT HV Monitor | 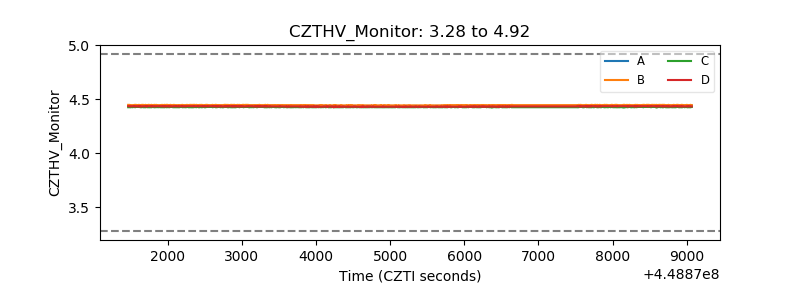 |
| D_VDD | 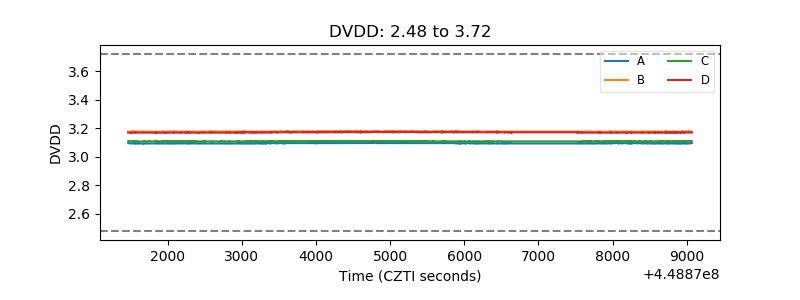 |
| Temperature 1 | 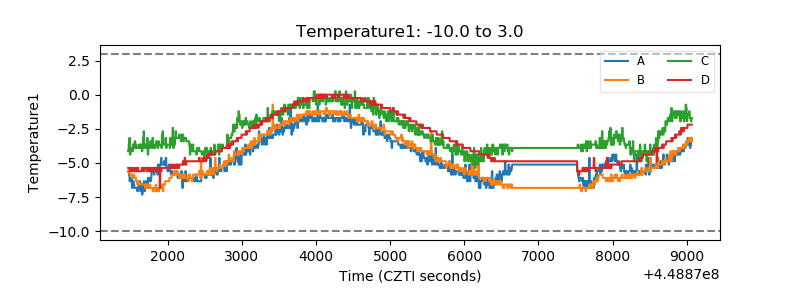 |
| Veto HV Monitor |  |
| Veto LLD | 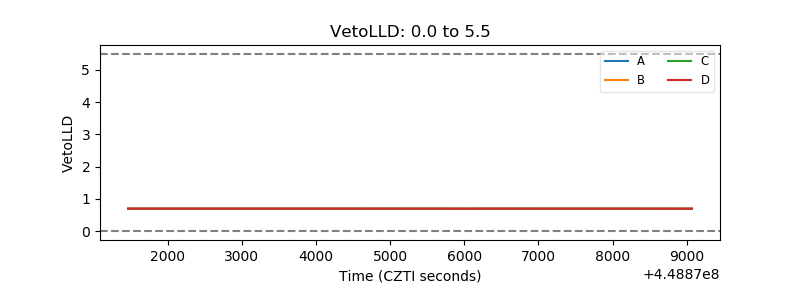 |
| Alpha Counter | 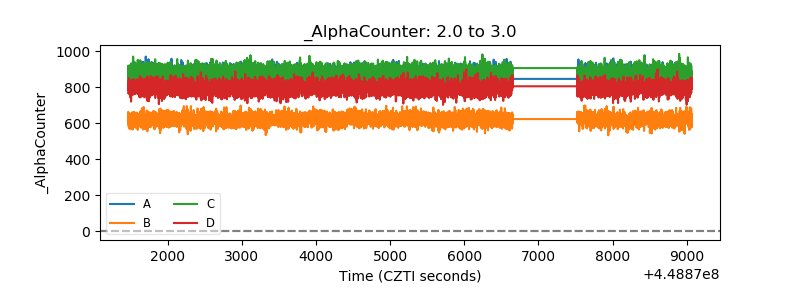 |
| _CPM_Rate | 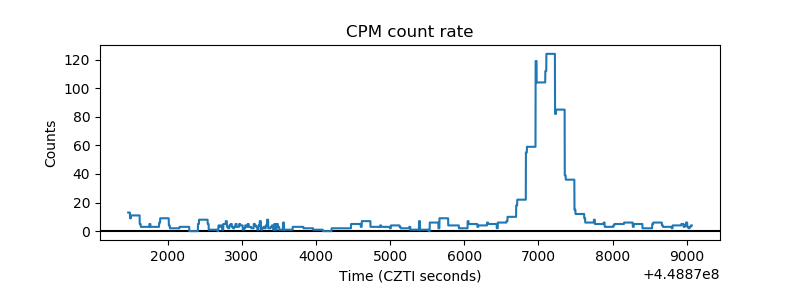 |
| CZT Counter | 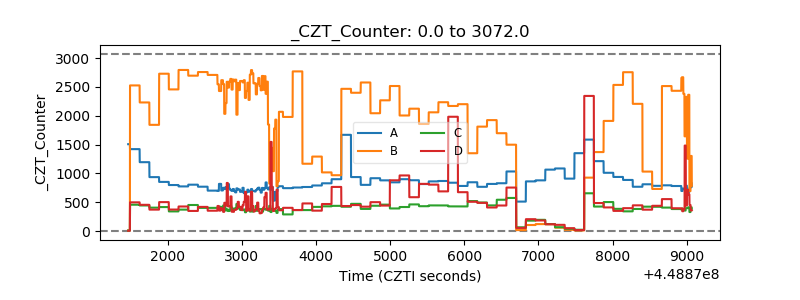 |
| +2.5 Volts monitor | 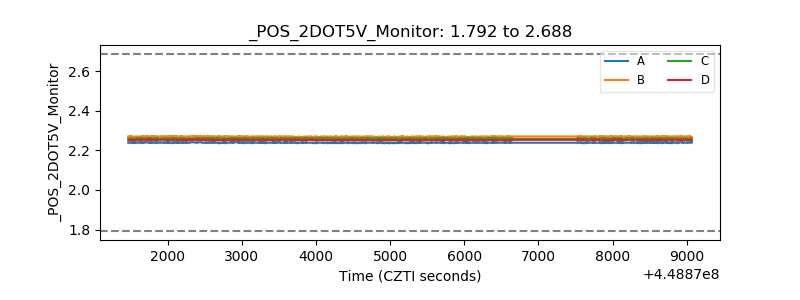 |
| +5 Volts monitor | 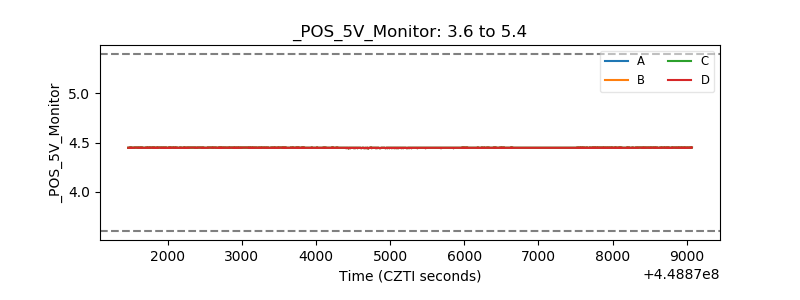 |
| _ROLL_ROT | 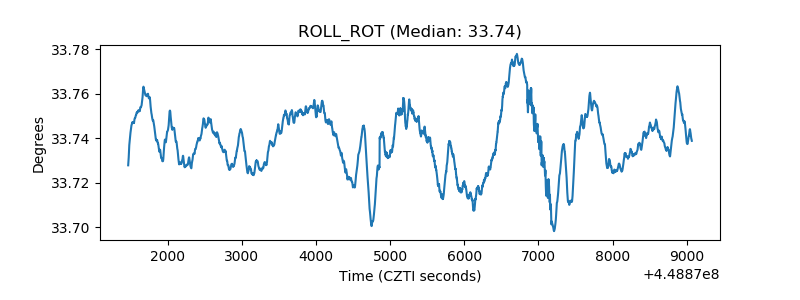 |
| _Roll_DEC | 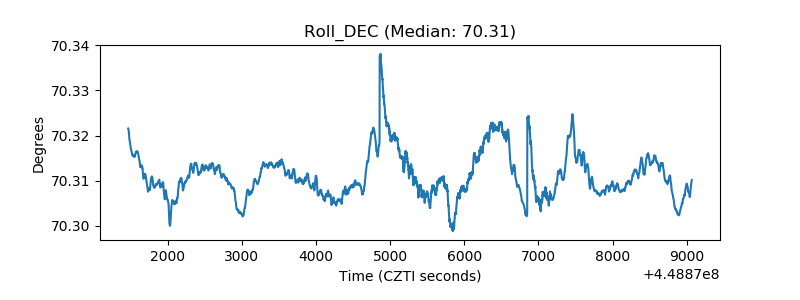 |
| _Roll_RA | 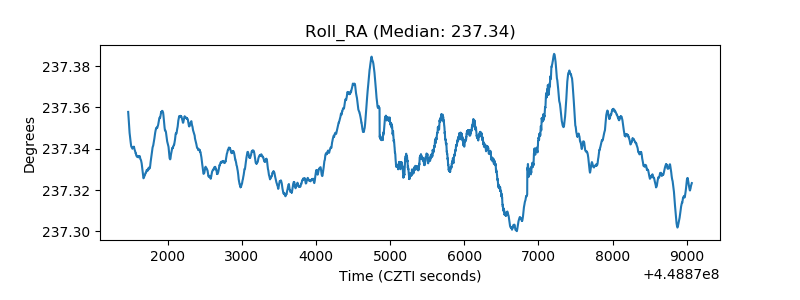 |
| Veto Counter | 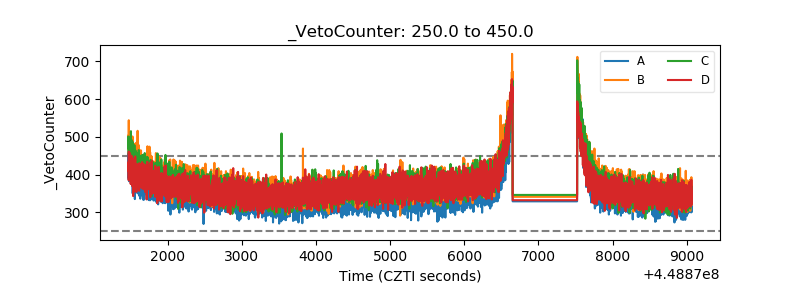 |