| Param | Original file | Final file |
|---|---|---|
| Filename | modeM0/AS1T05_188T01_9000006138_45885cztM0_level2.fits | modeM0/AS1T05_188T01_9000006138_45885cztM0_level2_quad_clean.evt |
| Size (bytes) | 510,675,840 | 96,033,600 |
| Size | 487.0 MB | 91.6 MB |
| Events in quadrant A | 5,443,954 | 644,462 |
| Events in quadrant B | 6,226,928 | 618,655 |
| Events in quadrant C | 2,755,722 | 645,766 |
| Events in quadrant D | 4,007,583 | 576,167 |
| Mode SS | |||
|---|---|---|---|
| Quadrant | BADHDUFLAG | Total packets | Discarded packets |
| A | 0 | 120 | 0 |
| B | 0 | 120 | 0 |
| C | 0 | 120 | 0 |
| D | 0 | 120 | 0 |
| Mode M0 | |||
|---|---|---|---|
| Quadrant | BADHDUFLAG | Total packets | Discarded packets |
| A | 0 | 19814 | 0 |
| B | 0 | 22656 | 1 |
| C | 0 | 12771 | 0 |
| D | 0 | 16042 | 0 |
| Quadrant | Total seconds | Saturated seconds | Saturation percentage |
|---|---|---|---|
| A | 6054 | 151 | 2.494219% |
| B | 6053 | 774 | 12.787048% |
| C | 6053 | 15 | 0.247811% |
| D | 6053 | 179 | 2.957211% |
Noise dominated data is calculated using 1-second bins in cleaned event files. If a bin has >2000 counts, and if more than 50% of those come from <1% of pixels, then it is considered to be noise-dominated and hence unusable.
| Quadrant | # 1 sec bins | Bins with >0 counts | Bins with >2000 counts | High rate bins dominated by noise | Noise dominated (total time) | Noise dominated (detector-on time) | Marked lightcurve |
|---|---|---|---|---|---|---|---|
| A | 6054 | 6054 | 40 | 40 | 0.66% | 0.66% | 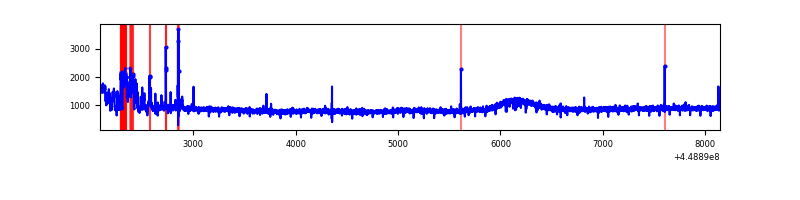 |
| B | 6053 | 6053 | 507 | 507 | 8.38% | 8.38% | 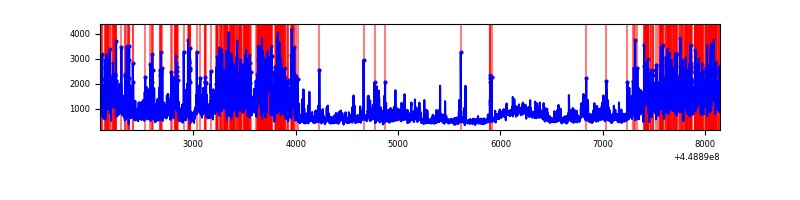 |
| C | 6053 | 6053 | 4 | 4 | 0.07% | 0.07% | 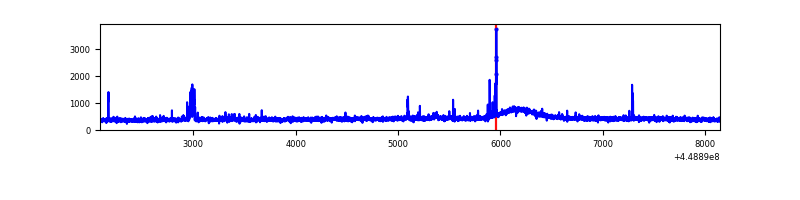 |
| D | 6052 | 6052 | 123 | 123 | 2.03% | 2.03% | 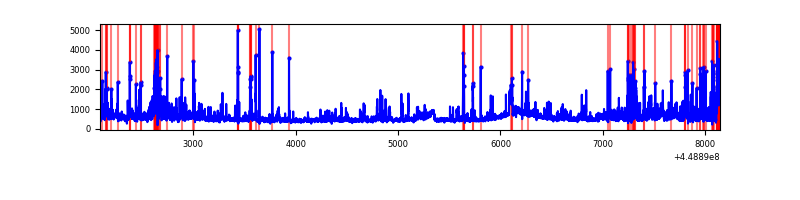 |
Top three noisy pixels from each quadrant. If the there are fewer than three noisy pixels in the level2.evt file, extra rows are filled as -1
| Pixel properties | Quadrant properties | ||||||
|---|---|---|---|---|---|---|---|
| Quadrant | DetID | PixID | Counts | Sigma | Mean | Median | Sigma |
| A | 10 | 83 | 2481773 | 17127.93 | 690 | 673 | 144.9 |
| A | 0 | 247 | 248057 | 1707.78 | 690 | 673 | 144.9 |
| A | 0 | 226 | 19965 | 133.18 | 690 | 673 | 144.9 |
| B | 3 | 112 | 3313448 | 24746.3 | 666 | 647 | 133.9 |
| B | 4 | 171 | 130540 | 970.28 | 666 | 647 | 133.9 |
| B | 5 | 172 | 50789 | 374.55 | 666 | 647 | 133.9 |
| C | 12 | 249 | 57144 | 349.38 | 679 | 681 | 161.6 |
| C | 12 | 2 | 37221 | 226.1 | 679 | 681 | 161.6 |
| C | 13 | 61 | 4508 | 23.68 | 679 | 681 | 161.6 |
| D | 1 | 52 | 506965 | 3000.75 | 669 | 647 | 168.7 |
| D | 5 | 171 | 190624 | 1125.92 | 669 | 647 | 168.7 |
| D | 11 | 241 | 148976 | 879.09 | 669 | 647 | 168.7 |
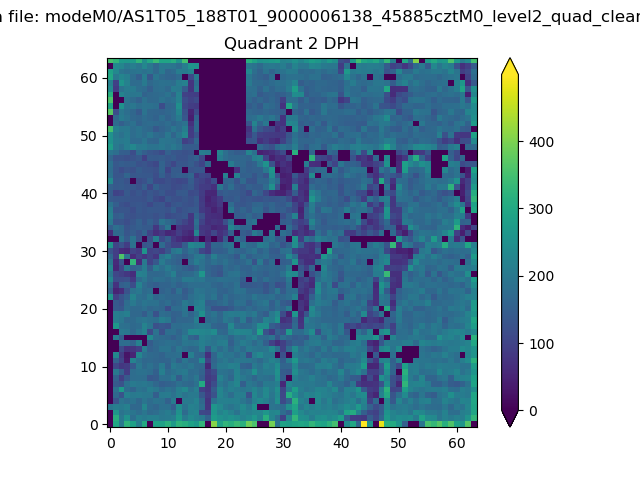
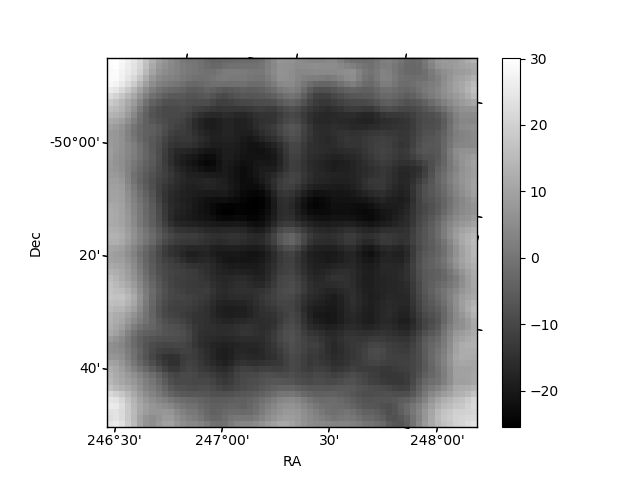
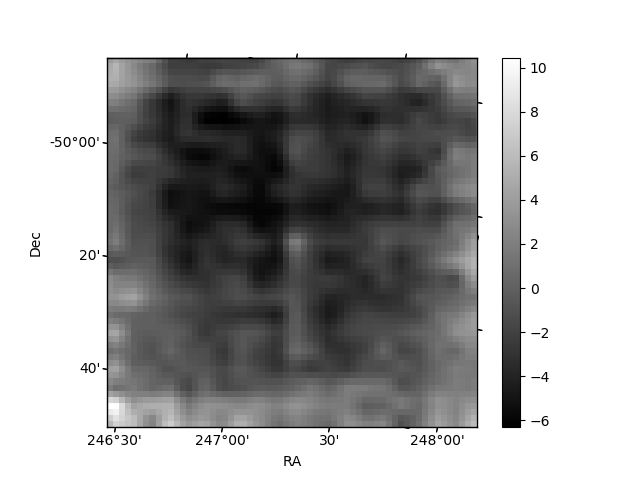
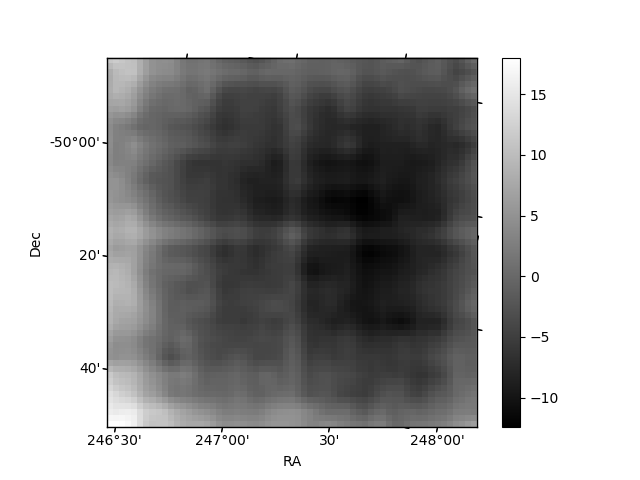
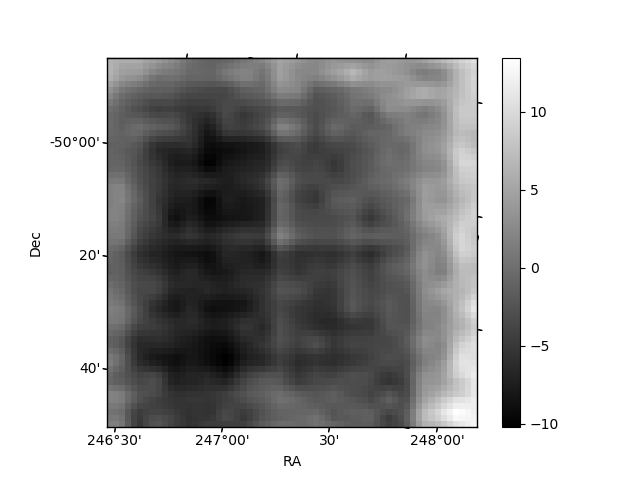
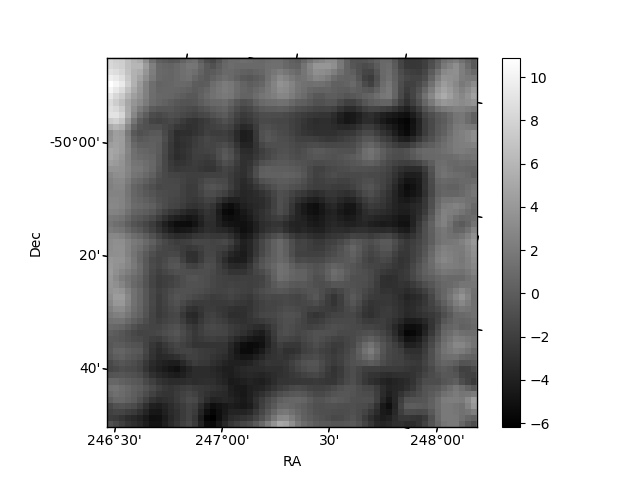
Histogram calculated using DETX and DETY for each event in the final _common_clean file
| Quadrant A | 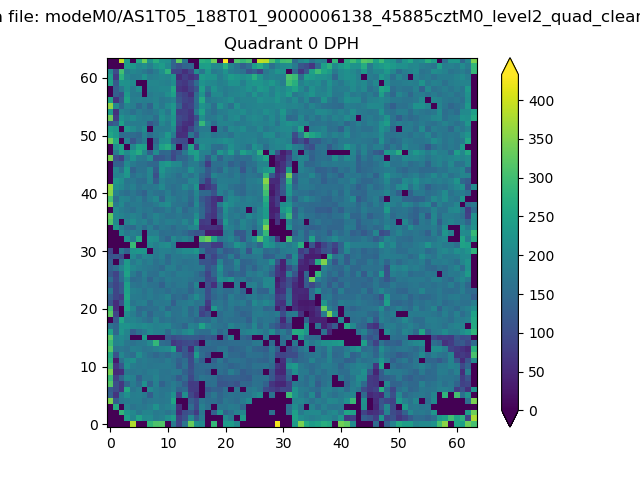 |
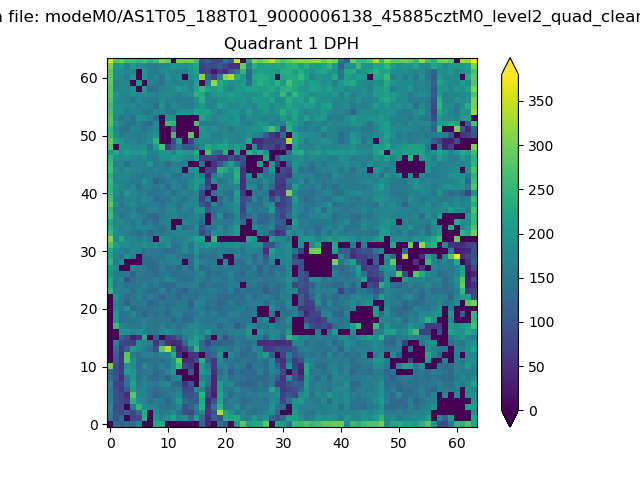 |
Quadrant B |
|---|---|---|---|
| Quadrant D | 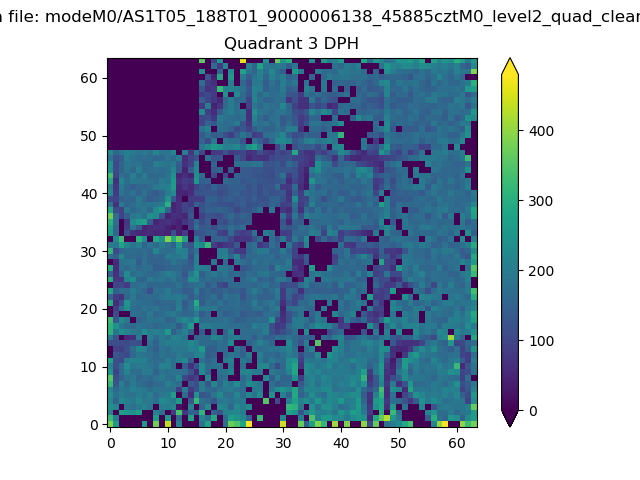 |
 |
Quadrant C |
| Plot type | Count rate plots | Images |
|---|---|---|
| Comparison with Poisson distribution Blue bars denote a histogram of data divided into 1 sec bins. Red curve is a Poisson curve with rate = median count rate of data. |
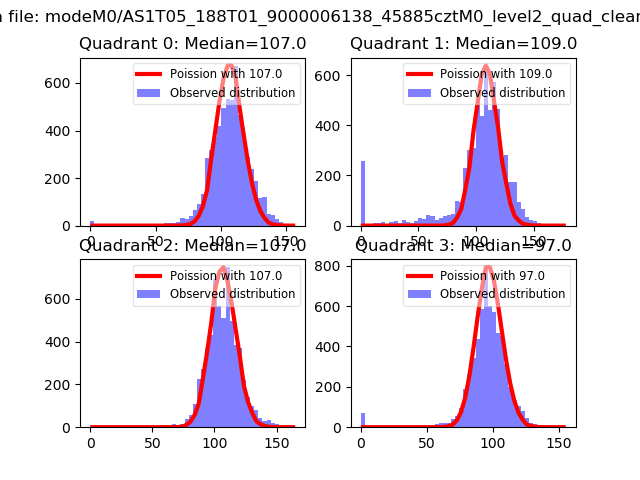 |
 |
| Quadrant-wise count rates Data is divided into 100 sec bins |
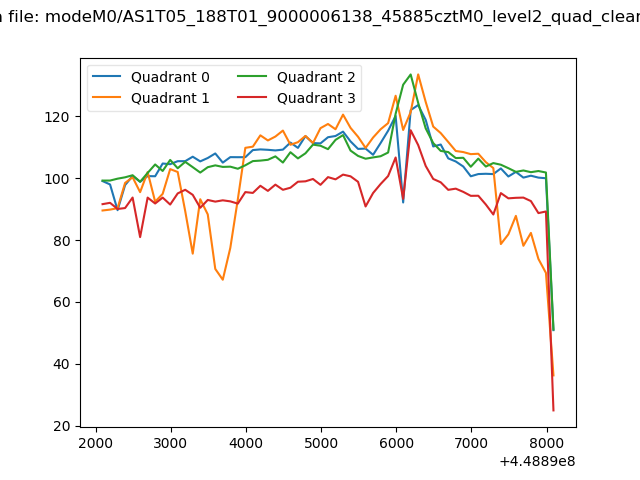 |
|
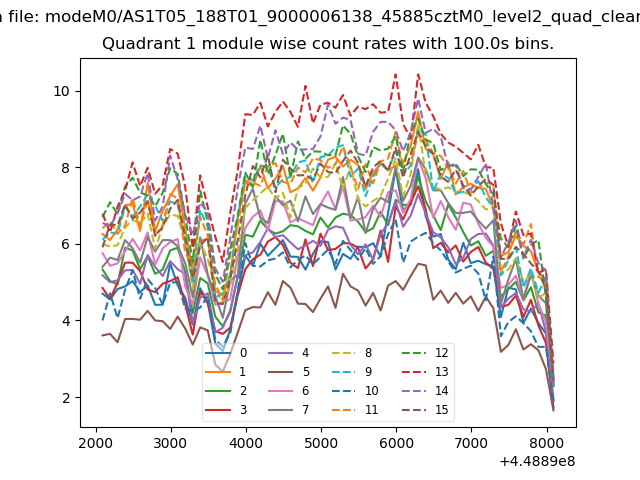
| Module-wise count rates for Quadrant A Data is divided into 100 sec bins |
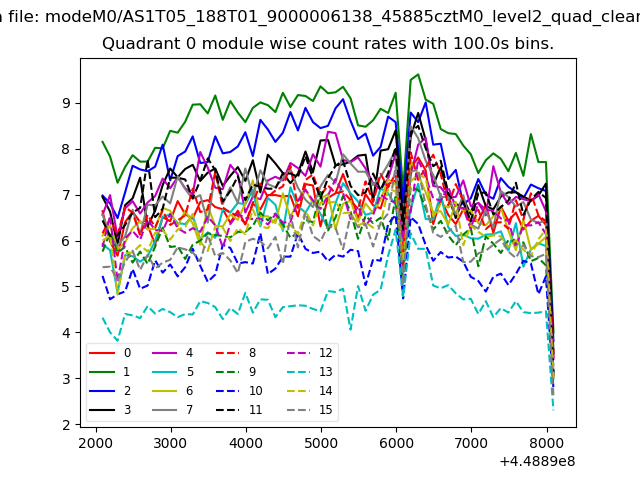 |
 |
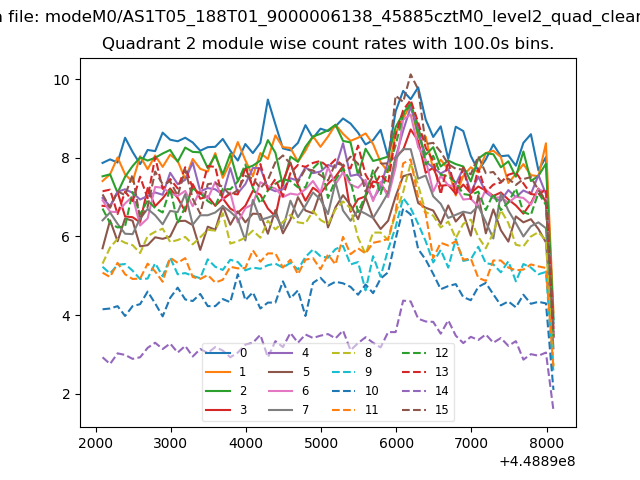
| Module-wise count rates for Quadrant B Data is divided into 100 sec bins |
 |
 |
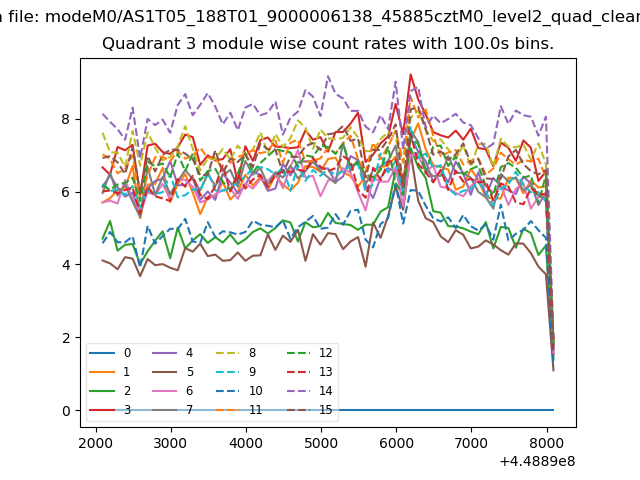
| Module-wise count rates for Quadrant C Data is divided into 100 sec bins |
 |
 |
| Module-wise count rates for Quadrant D Data is divided into 100 sec bins |
 |
 |
| Parameter | Plot |
|---|---|
| CZT HV Monitor | 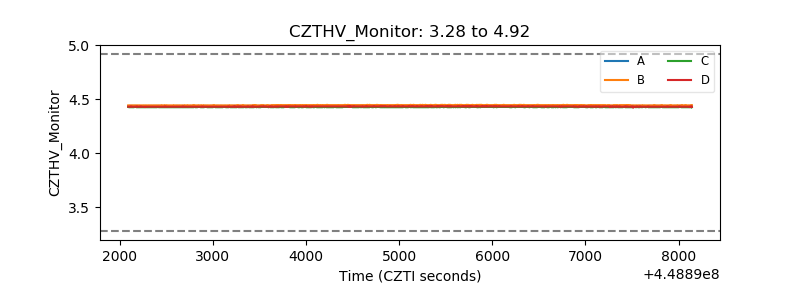 |
| D_VDD | 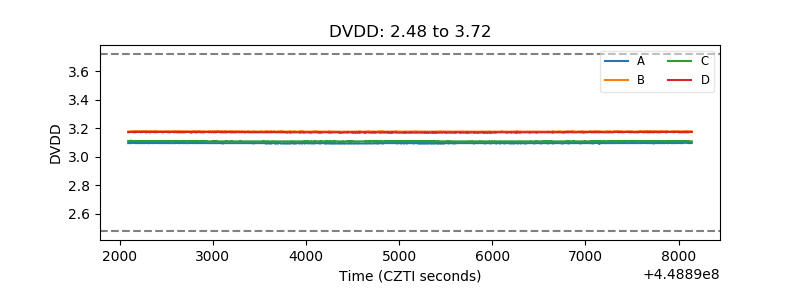 |
| Temperature 1 | 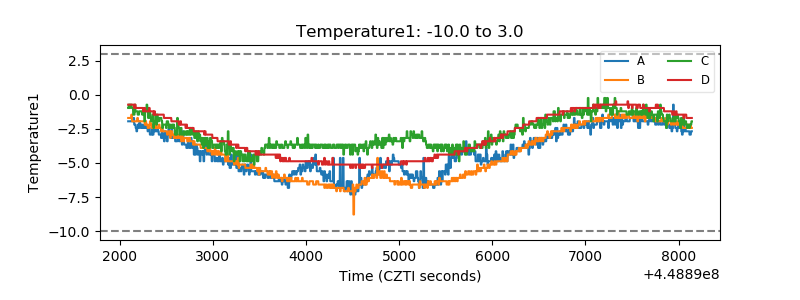 |
| Veto HV Monitor | 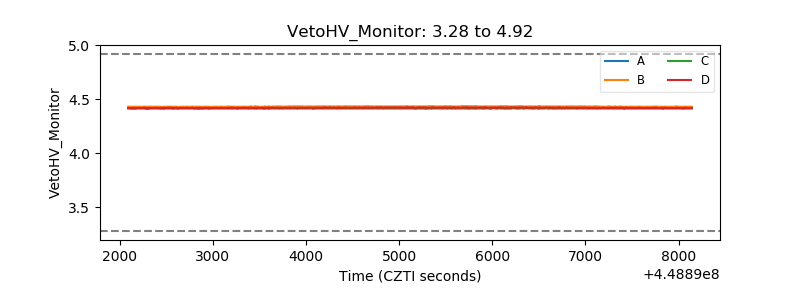 |
| Veto LLD | 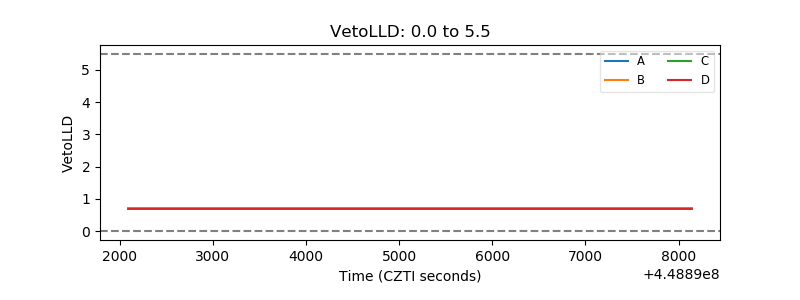 |
| Alpha Counter | 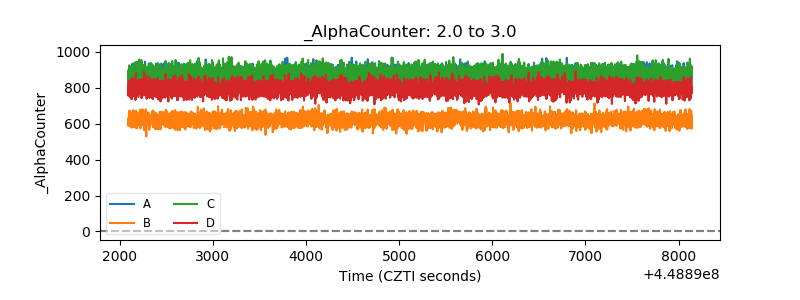 |
| _CPM_Rate | 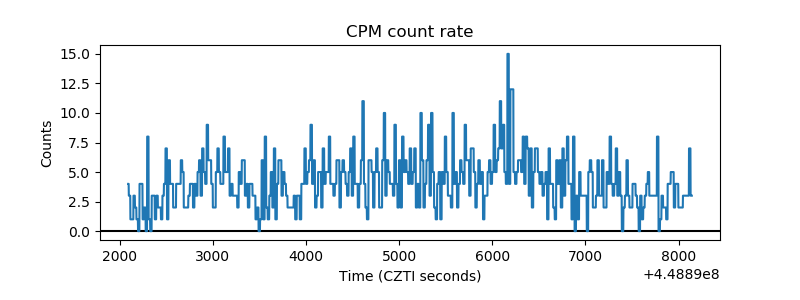 |
| CZT Counter | 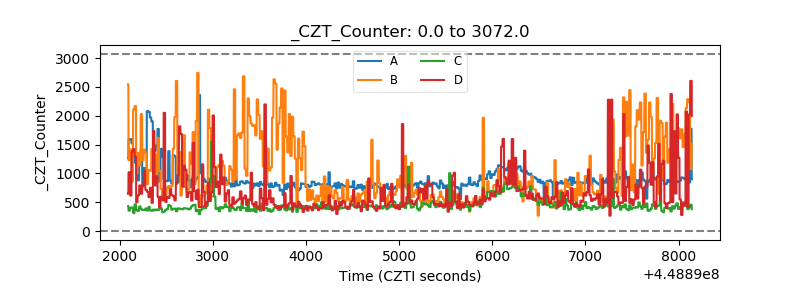 |
| +2.5 Volts monitor |  |
| +5 Volts monitor | 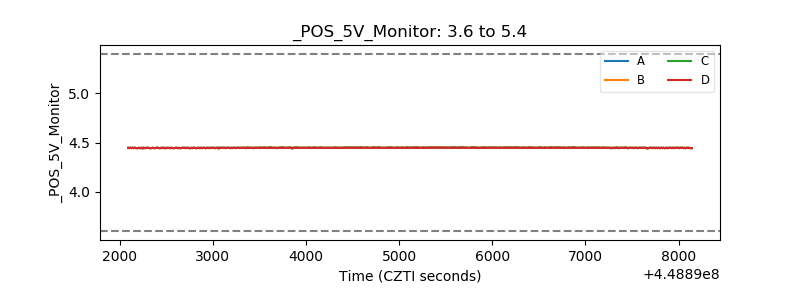 |
| _ROLL_ROT | 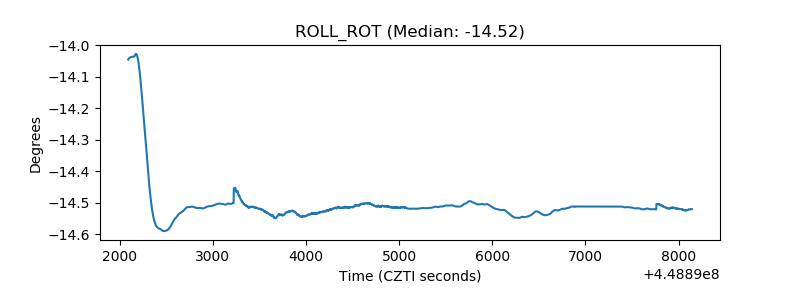 |
| _Roll_DEC | 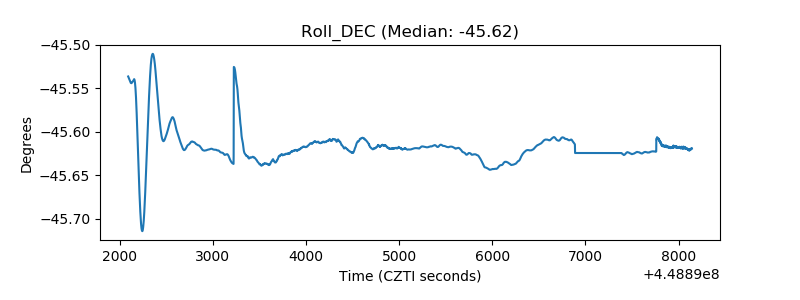 |
| _Roll_RA | 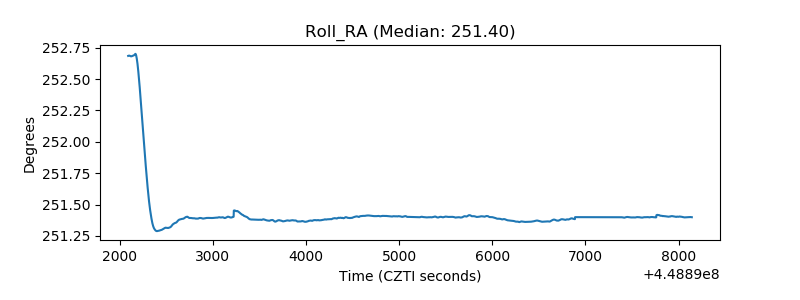 |
| Veto Counter | 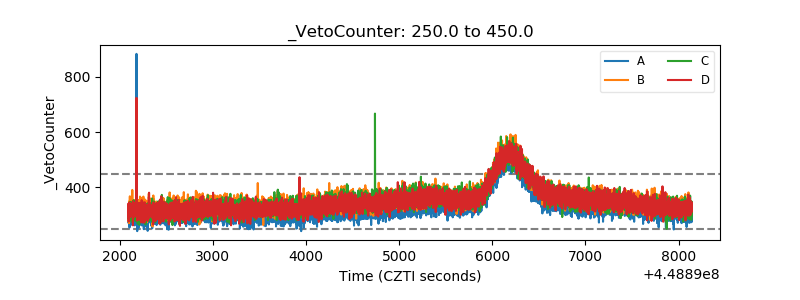 |