| Param | Original file | Final file |
|---|---|---|
| Filename | modeM0/AS1T05_188T01_9000006138_45886cztM0_level2.fits | modeM0/AS1T05_188T01_9000006138_45886cztM0_level2_quad_clean.evt |
| Size (bytes) | 664,721,280 | 106,035,840 |
| Size | 633.9 MB | 101.1 MB |
| Events in quadrant A | 6,098,193 | 730,565 |
| Events in quadrant B | 8,896,146 | 587,116 |
| Events in quadrant C | 3,211,519 | 754,516 |
| Events in quadrant D | 5,847,954 | 641,825 |
| Mode SS | |||
|---|---|---|---|
| Quadrant | BADHDUFLAG | Total packets | Discarded packets |
| A | 0 | 144 | 0 |
| B | 0 | 144 | 0 |
| C | 0 | 144 | 0 |
| D | 0 | 144 | 0 |
| Mode M0 | |||
|---|---|---|---|
| Quadrant | BADHDUFLAG | Total packets | Discarded packets |
| A | 0 | 22447 | 1 |
| B | 0 | 31277 | 1 |
| C | 0 | 14884 | 1 |
| D | 0 | 22242 | 7 |
| Mode M9 | |||
|---|---|---|---|
| Quadrant | BADHDUFLAG | Total packets | Discarded packets |
| A | 0 | 1 | 0 |
| B | 0 | 1 | 0 |
| C | 0 | 1 | 0 |
| D | 0 | 1 | 0 |
| Quadrant | Total seconds | Saturated seconds | Saturation percentage |
|---|---|---|---|
| A | 7126 | 303 | 4.252035% |
| B | 7127 | 2065 | 28.974323% |
| C | 7127 | 56 | 0.785744% |
| D | 7126 | 645 | 9.051361% |
Noise dominated data is calculated using 1-second bins in cleaned event files. If a bin has >2000 counts, and if more than 50% of those come from <1% of pixels, then it is considered to be noise-dominated and hence unusable.
| Quadrant | # 1 sec bins | Bins with >0 counts | Bins with >2000 counts | High rate bins dominated by noise | Noise dominated (total time) | Noise dominated (detector-on time) | Marked lightcurve |
|---|---|---|---|---|---|---|---|
| A | 7206 | 7127 | 24 | 24 | 0.33% | 0.34% | 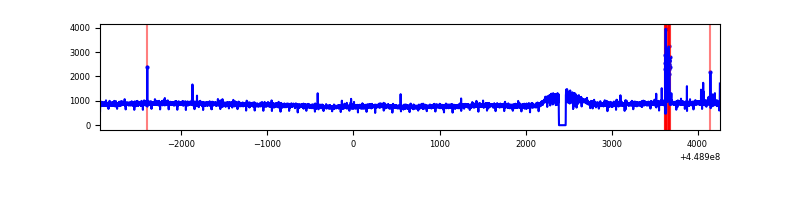 |
| B | 7207 | 7128 | 1309 | 1309 | 18.16% | 18.36% | 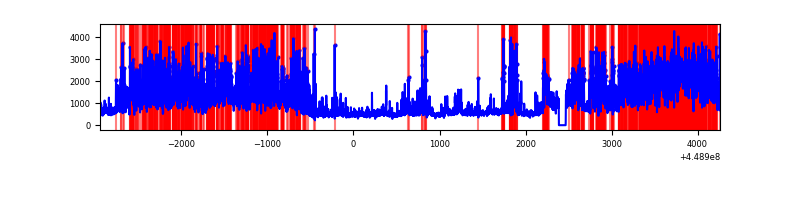 |
| C | 7207 | 7128 | 4 | 4 | 0.06% | 0.06% | 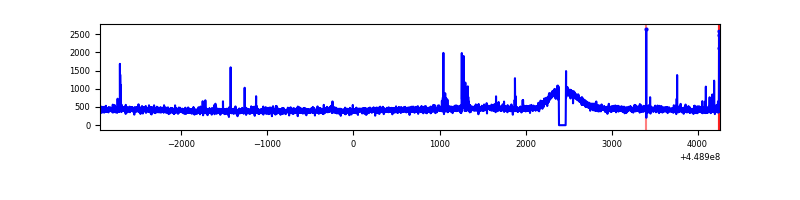 |
| D | 7205 | 7126 | 464 | 464 | 6.44% | 6.51% | 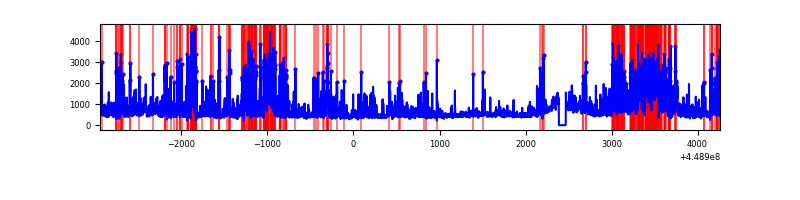 |
Top three noisy pixels from each quadrant. If the there are fewer than three noisy pixels in the level2.evt file, extra rows are filled as -1
| Pixel properties | Quadrant properties | ||||||
|---|---|---|---|---|---|---|---|
| Quadrant | DetID | PixID | Counts | Sigma | Mean | Median | Sigma |
| A | 10 | 83 | 2870992 | 16972.33 | 808 | 790 | 169.1 |
| A | 4 | 0 | 76532 | 447.88 | 808 | 790 | 169.1 |
| A | 0 | 247 | 10591 | 57.96 | 808 | 790 | 169.1 |
| B | 3 | 112 | 3628811 | 25170.59 | 726 | 703 | 144.1 |
| B | 0 | 189 | 1882695 | 13056.63 | 726 | 703 | 144.1 |
| B | 4 | 171 | 309404 | 2141.66 | 726 | 703 | 144.1 |
| C | 12 | 2 | 40072 | 206.8 | 801 | 805 | 189.9 |
| C | 10 | 20 | 27786 | 142.1 | 801 | 805 | 189.9 |
| C | 2 | 14 | 8203 | 38.96 | 801 | 805 | 189.9 |
| D | 13 | 249 | 1039589 | 5340.22 | 774 | 749 | 194.5 |
| D | 1 | 52 | 806445 | 4141.73 | 774 | 749 | 194.5 |
| D | 5 | 171 | 337277 | 1729.94 | 774 | 749 | 194.5 |
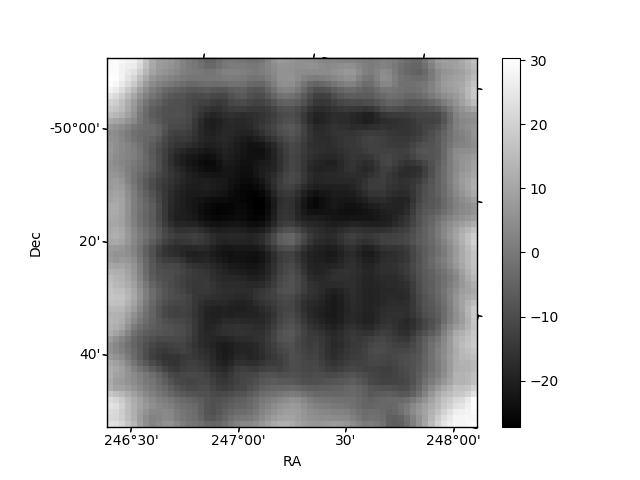
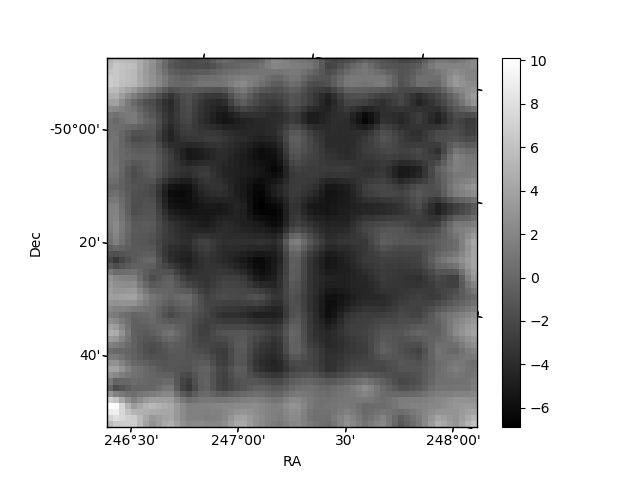
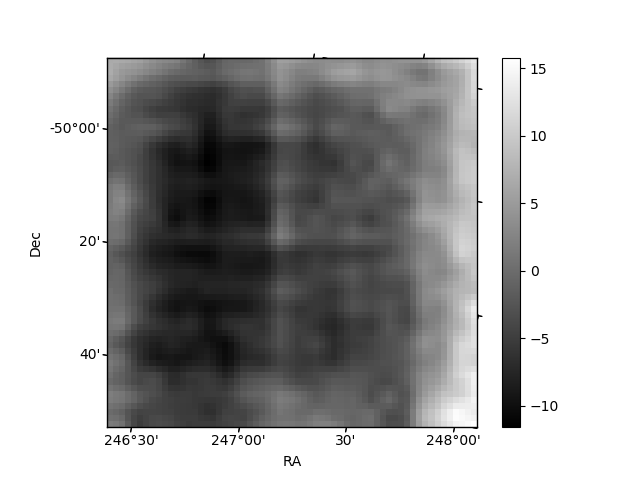
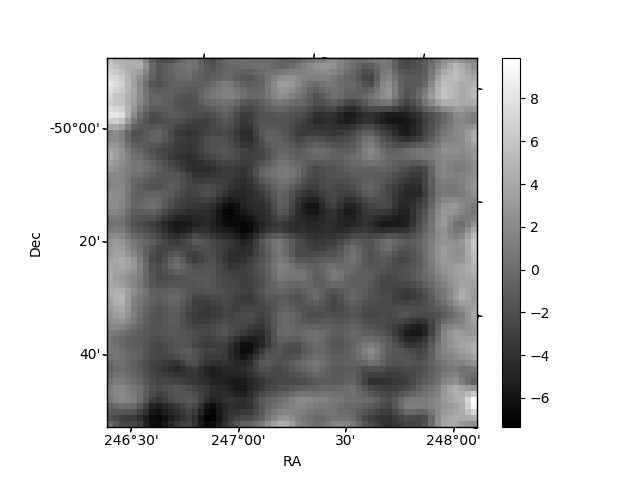
Histogram calculated using DETX and DETY for each event in the final _common_clean file
| Quadrant A | 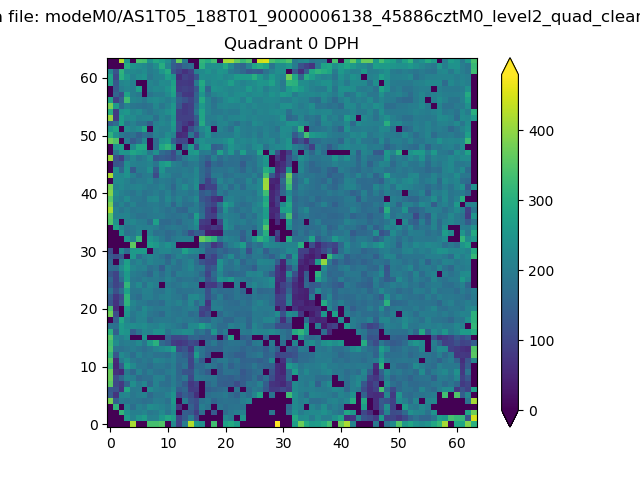 |
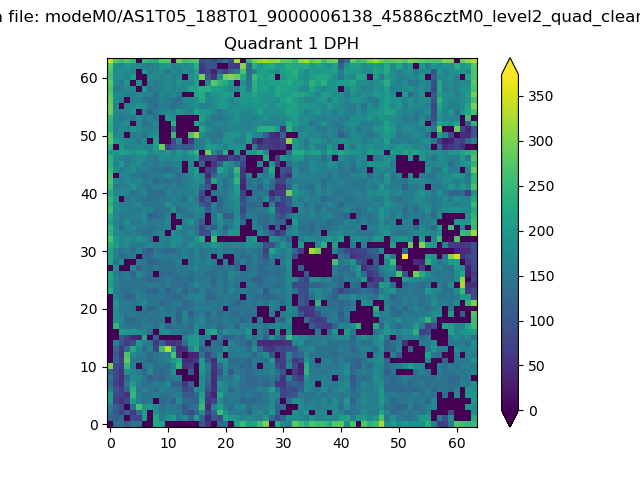 |
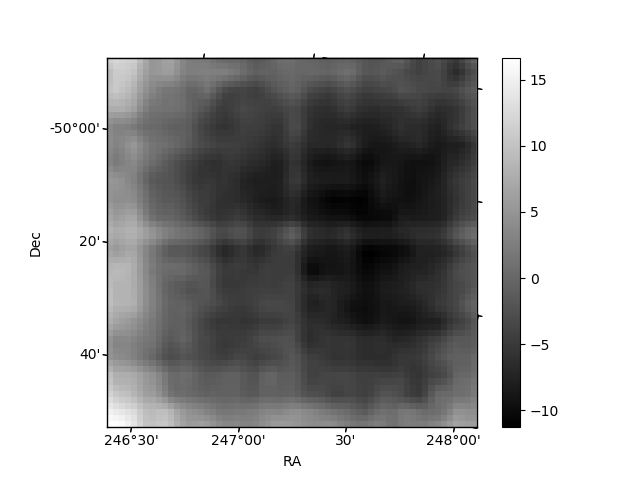
Quadrant B |
|---|---|---|---|
| Quadrant D | 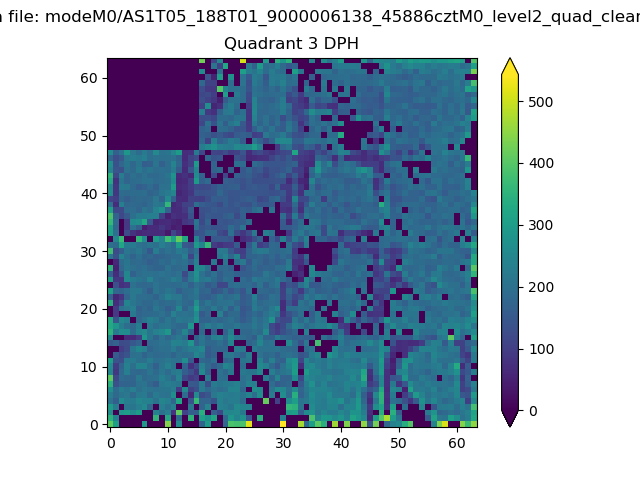 |
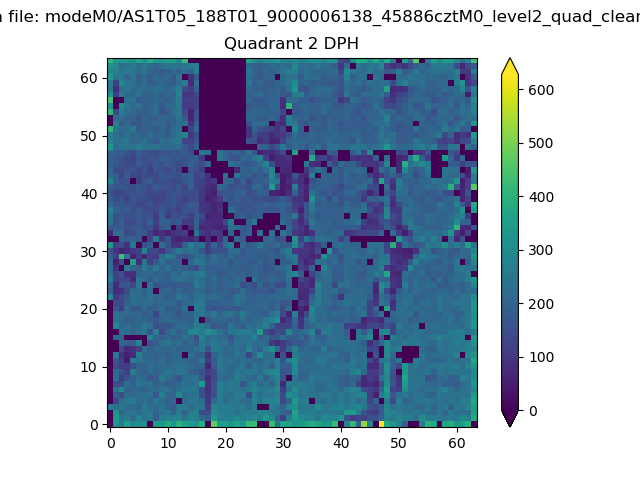 |
Quadrant C |
| Plot type | Count rate plots | Images |
|---|---|---|
| Comparison with Poisson distribution Blue bars denote a histogram of data divided into 1 sec bins. Red curve is a Poisson curve with rate = median count rate of data. |
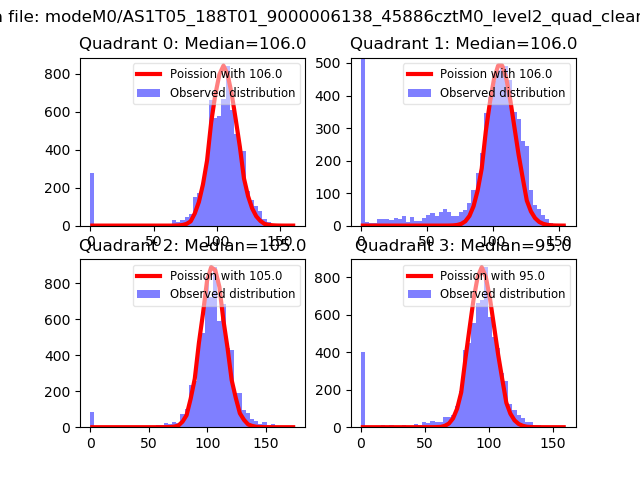 |
 |
| Quadrant-wise count rates Data is divided into 100 sec bins |
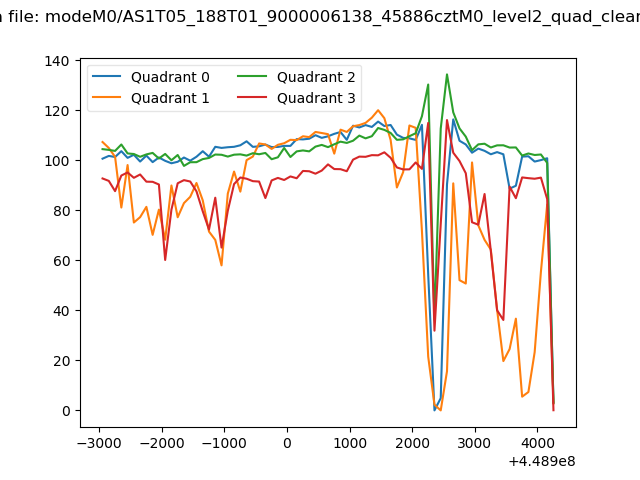 |
|
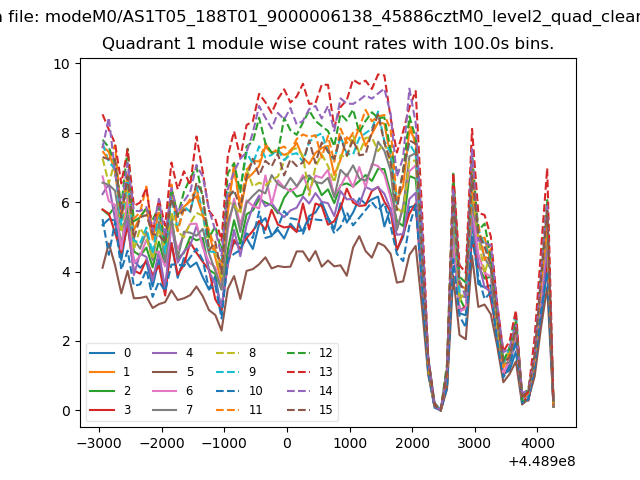
| Module-wise count rates for Quadrant A Data is divided into 100 sec bins |
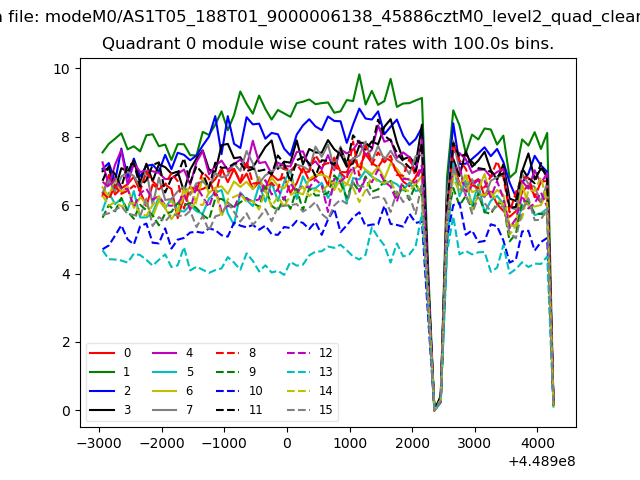 |
 |
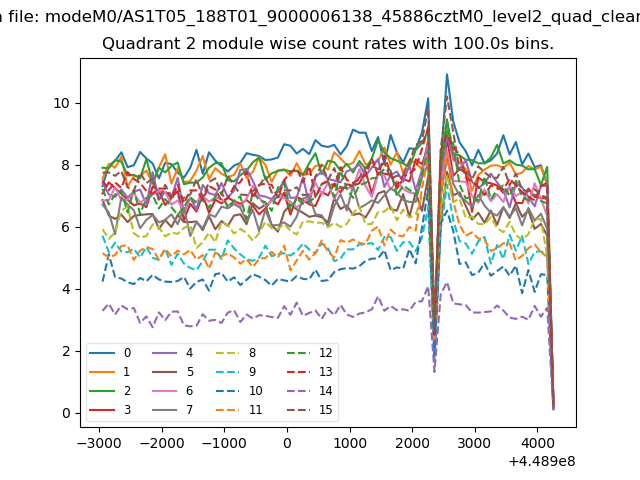
| Module-wise count rates for Quadrant B Data is divided into 100 sec bins |
 |
 |
| Module-wise count rates for Quadrant C Data is divided into 100 sec bins |
 |
 |
| Module-wise count rates for Quadrant D Data is divided into 100 sec bins |
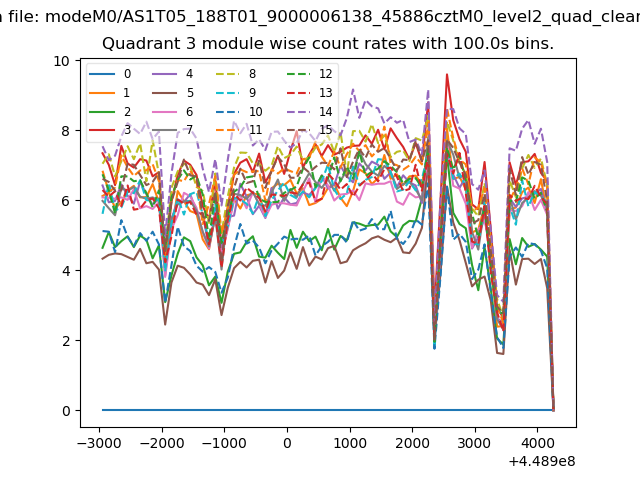 |
 |
| Parameter | Plot |
|---|---|
| CZT HV Monitor | 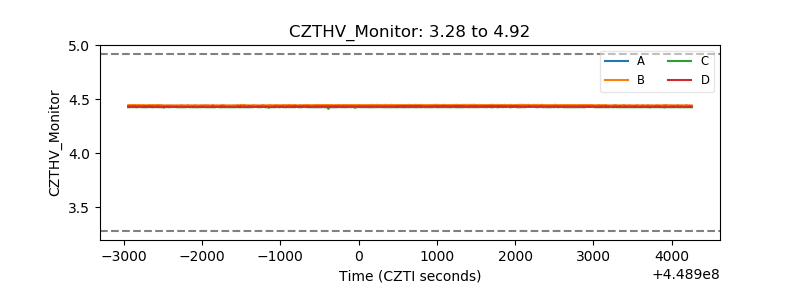 |
| D_VDD | 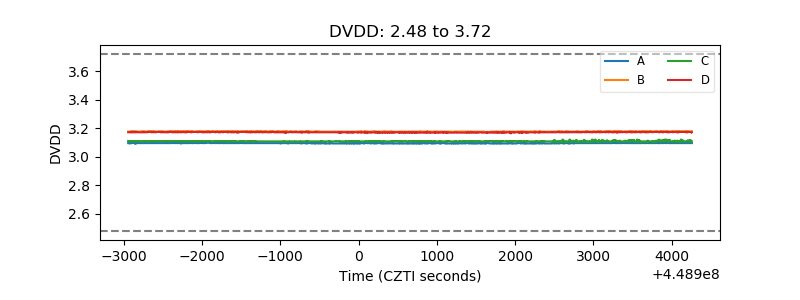 |
| Temperature 1 | 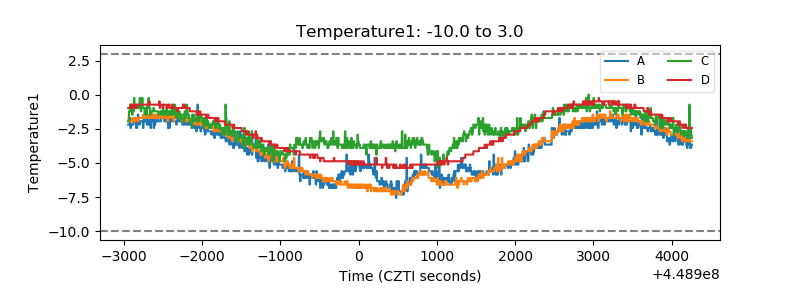 |
| Veto HV Monitor | 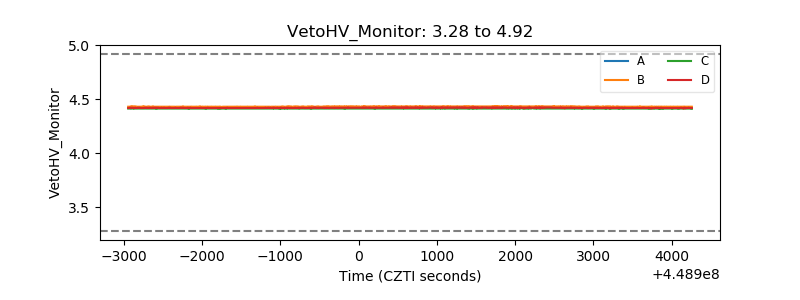 |
| Veto LLD | 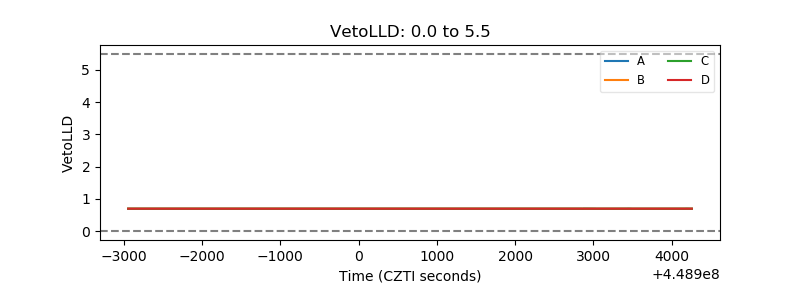 |
| Alpha Counter | 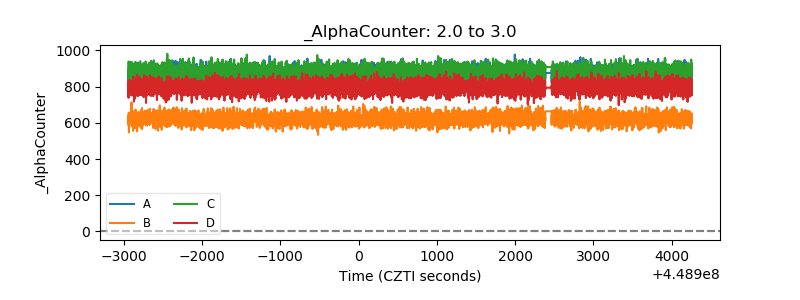 |
| _CPM_Rate | 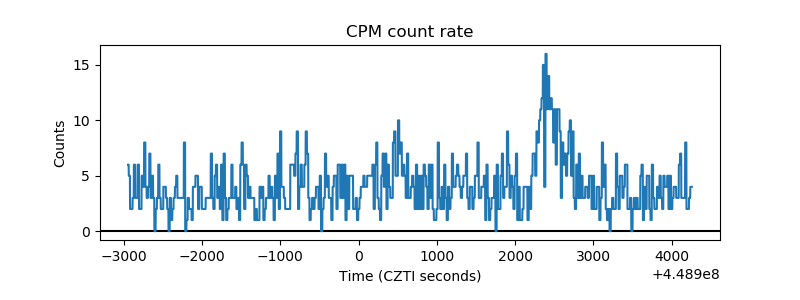 |
| CZT Counter | 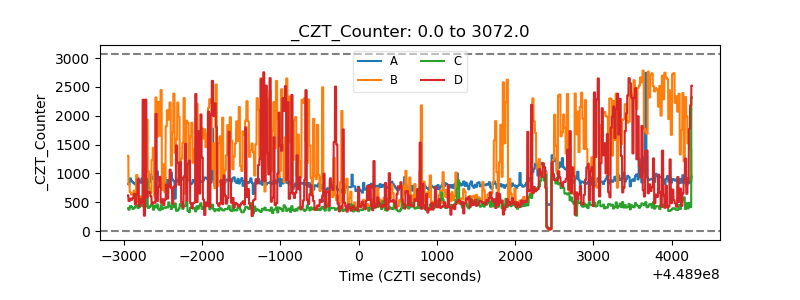 |
| +2.5 Volts monitor | 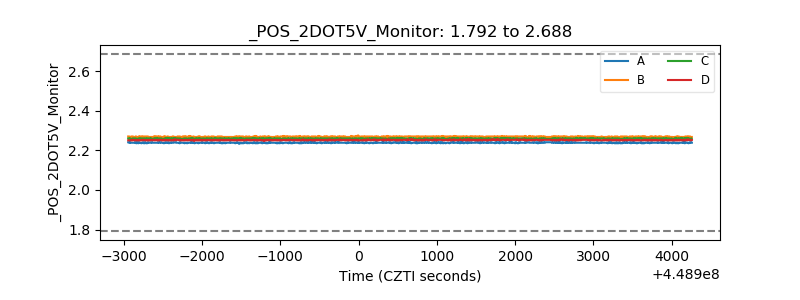 |
| +5 Volts monitor | 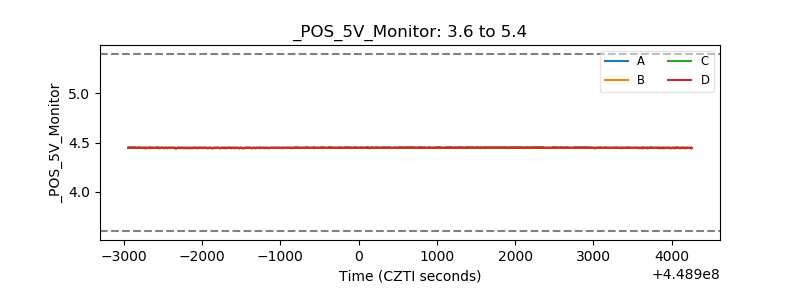 |
| _ROLL_ROT | 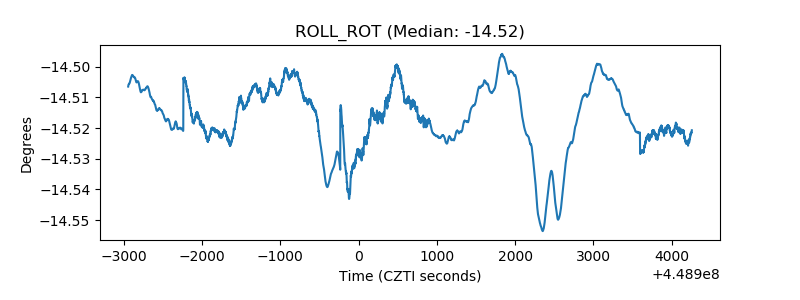 |
| _Roll_DEC | 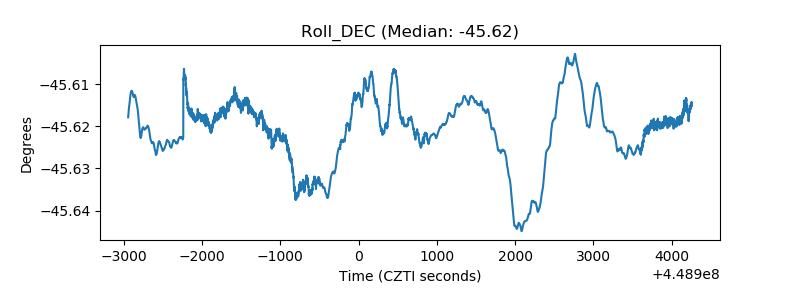 |
| _Roll_RA | 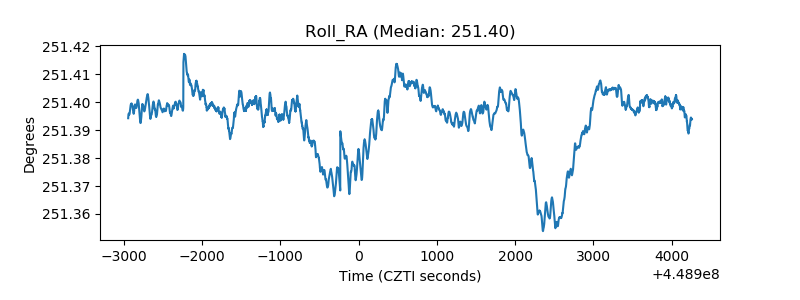 |
| Veto Counter | 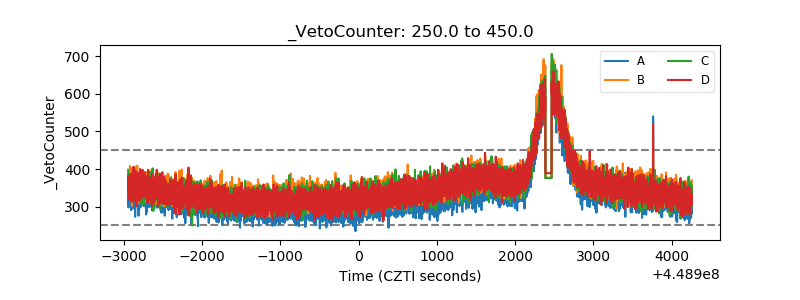 |