| Param | Original file | Final file |
|---|---|---|
| Filename | modeM0/AS1T05_188T01_9000006138_45888cztM0_level2.fits | modeM0/AS1T05_188T01_9000006138_45888cztM0_level2_quad_clean.evt |
| Size (bytes) | 1,012,109,760 | 156,386,880 |
| Size | 965.2 MB | 149.1 MB |
| Events in quadrant A | 8,859,649 | 1,111,168 |
| Events in quadrant B | 12,159,358 | 943,850 |
| Events in quadrant C | 4,806,514 | 1,103,050 |
| Events in quadrant D | 10,820,273 | 842,011 |
| Mode SS | |||
|---|---|---|---|
| Quadrant | BADHDUFLAG | Total packets | Discarded packets |
| A | 0 | 214 | 0 |
| B | 0 | 214 | 0 |
| C | 0 | 214 | 0 |
| D | 0 | 214 | 0 |
| Mode M0 | |||
|---|---|---|---|
| Quadrant | BADHDUFLAG | Total packets | Discarded packets |
| A | 0 | 33235 | 1 |
| B | 0 | 43460 | 1 |
| C | 0 | 22307 | 1 |
| D | 0 | 39530 | 1 |
| Mode M9 | |||
|---|---|---|---|
| Quadrant | BADHDUFLAG | Total packets | Discarded packets |
| A | 0 | 4 | 0 |
| B | 0 | 4 | 0 |
| C | 0 | 4 | 0 |
| D | 0 | 4 | 0 |
| Quadrant | Total seconds | Saturated seconds | Saturation percentage |
|---|---|---|---|
| A | 10604 | 185 | 1.744625% |
| B | 10604 | 2148 | 20.256507% |
| C | 10605 | 111 | 1.046676% |
| D | 10605 | 1886 | 17.784064% |
Noise dominated data is calculated using 1-second bins in cleaned event files. If a bin has >2000 counts, and if more than 50% of those come from <1% of pixels, then it is considered to be noise-dominated and hence unusable.
| Quadrant | # 1 sec bins | Bins with >0 counts | Bins with >2000 counts | High rate bins dominated by noise | Noise dominated (total time) | Noise dominated (detector-on time) | Marked lightcurve |
|---|---|---|---|---|---|---|---|
| A | 11049 | 10605 | 24 | 24 | 0.22% | 0.23% | 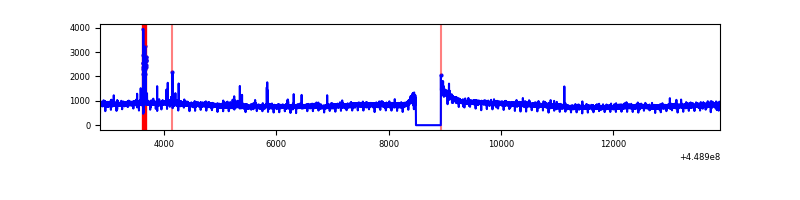 |
| B | 11049 | 10605 | 1496 | 1496 | 13.54% | 14.11% | 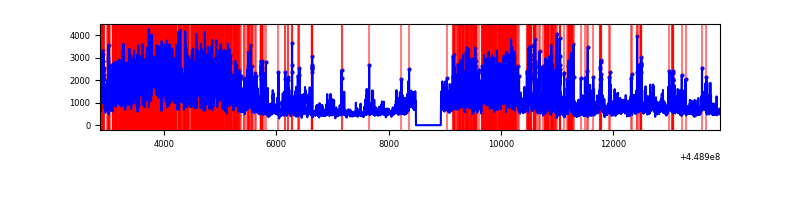 |
| C | 11050 | 10606 | 82 | 82 | 0.74% | 0.77% | 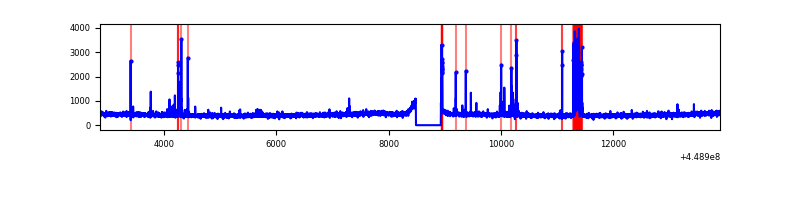 |
| D | 11050 | 10606 | 1553 | 1553 | 14.05% | 14.64% | 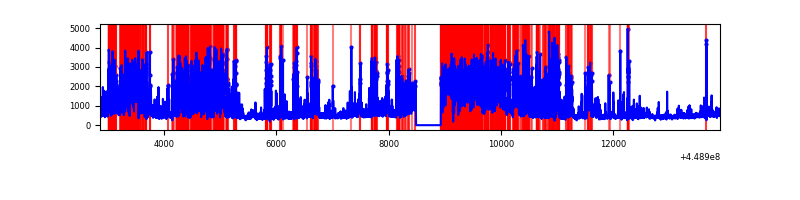 |
Top three noisy pixels from each quadrant. If the there are fewer than three noisy pixels in the level2.evt file, extra rows are filled as -1
| Pixel properties | Quadrant properties | ||||||
|---|---|---|---|---|---|---|---|
| Quadrant | DetID | PixID | Counts | Sigma | Mean | Median | Sigma |
| A | 10 | 83 | 4266034 | 17878.57 | 1149 | 1124 | 238.5 |
| A | 4 | 0 | 78246 | 323.3 | 1149 | 1124 | 238.5 |
| A | 2 | 79 | 58827 | 241.89 | 1149 | 1124 | 238.5 |
| B | 3 | 112 | 5610080 | 26509.42 | 1072 | 1040 | 211.6 |
| B | 0 | 189 | 1689268 | 7978.9 | 1072 | 1040 | 211.6 |
| B | 4 | 171 | 348459 | 1641.97 | 1072 | 1040 | 211.6 |
| C | 12 | 2 | 340244 | 1258.26 | 1136 | 1139 | 269.5 |
| C | 2 | 14 | 15458 | 53.13 | 1136 | 1139 | 269.5 |
| C | 10 | 20 | 11047 | 36.76 | 1136 | 1139 | 269.5 |
| D | 1 | 52 | 1820260 | 6959.85 | 1044 | 1013 | 261.4 |
| D | 12 | 233 | 1740328 | 6654.06 | 1044 | 1013 | 261.4 |
| D | 13 | 249 | 1572995 | 6013.89 | 1044 | 1013 | 261.4 |
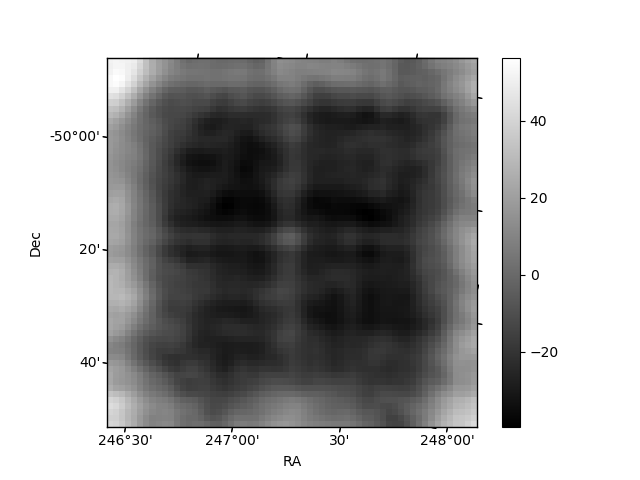
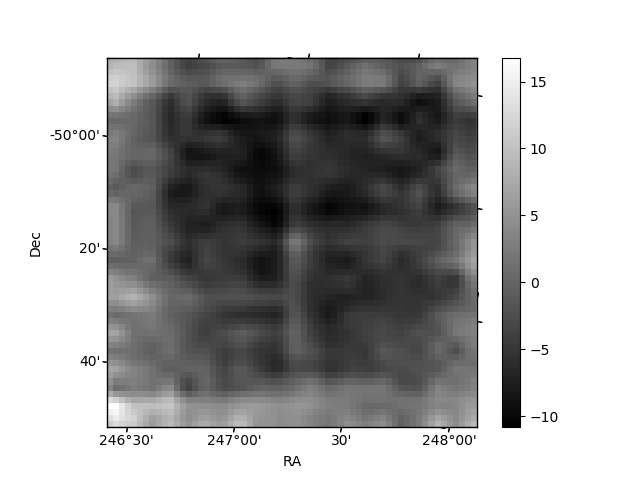
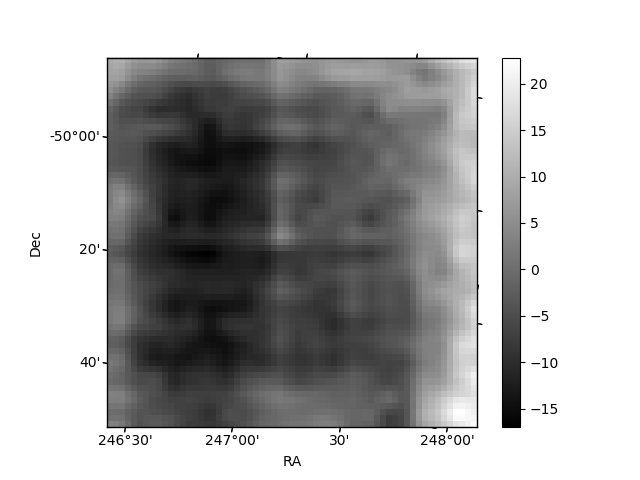
Histogram calculated using DETX and DETY for each event in the final _common_clean file
| Quadrant A | 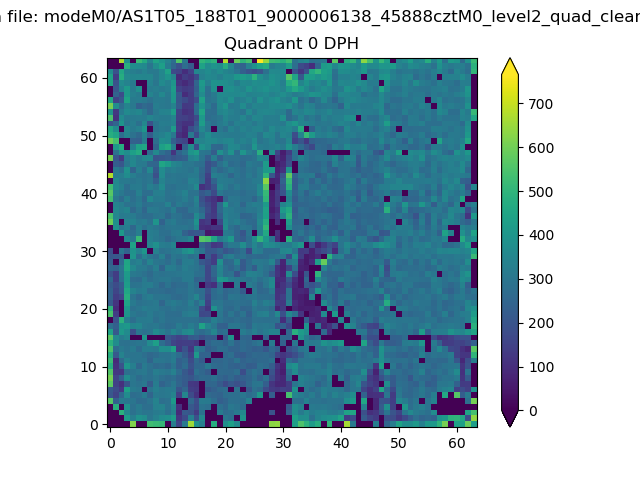 |
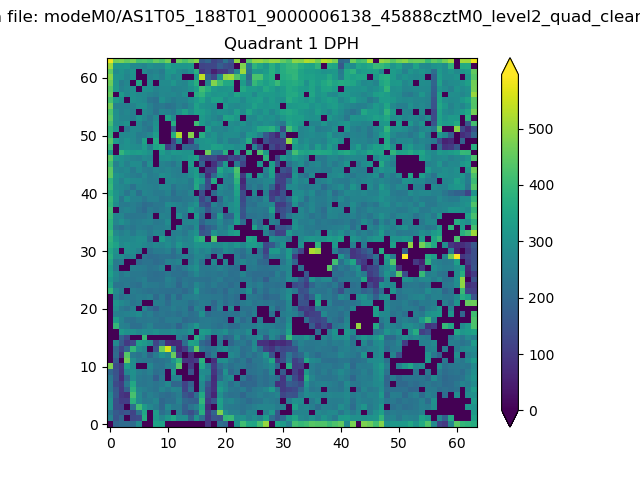 |
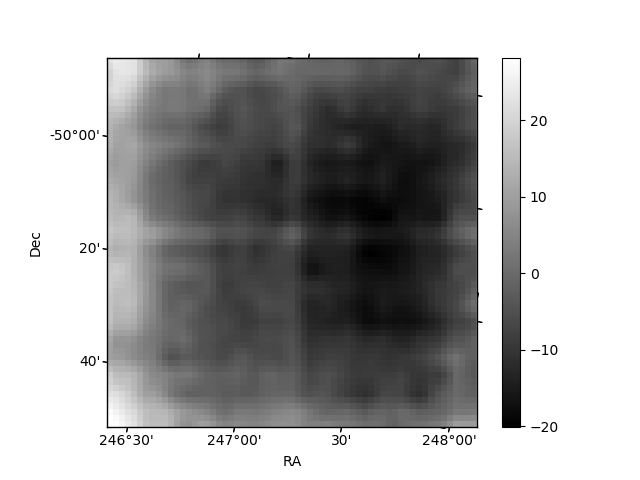
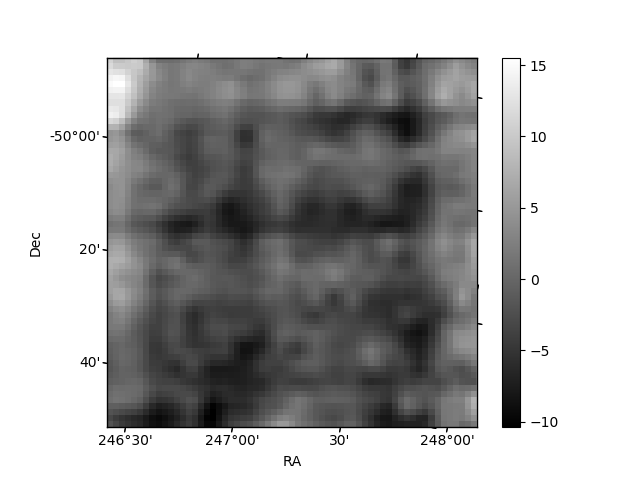
Quadrant B |
|---|---|---|---|
| Quadrant D | 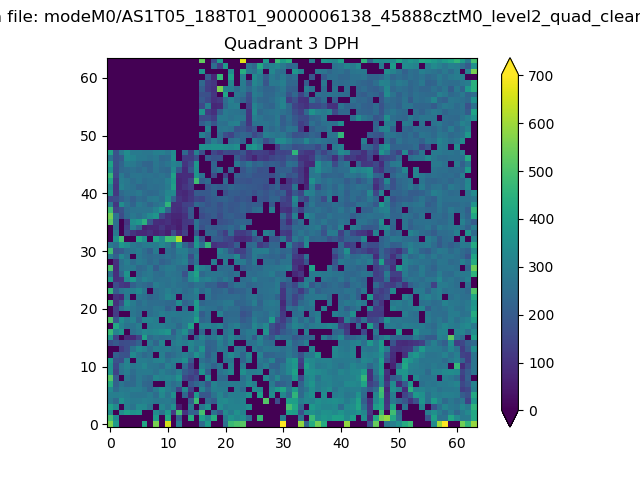 |
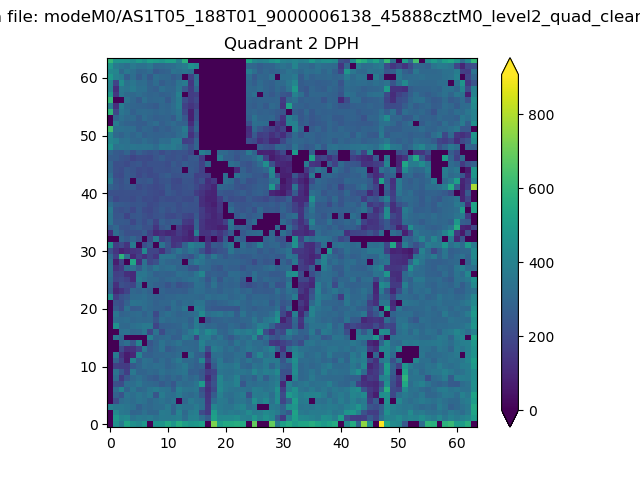 |
Quadrant C |
| Plot type | Count rate plots | Images |
|---|---|---|
| Comparison with Poisson distribution Blue bars denote a histogram of data divided into 1 sec bins. Red curve is a Poisson curve with rate = median count rate of data. |
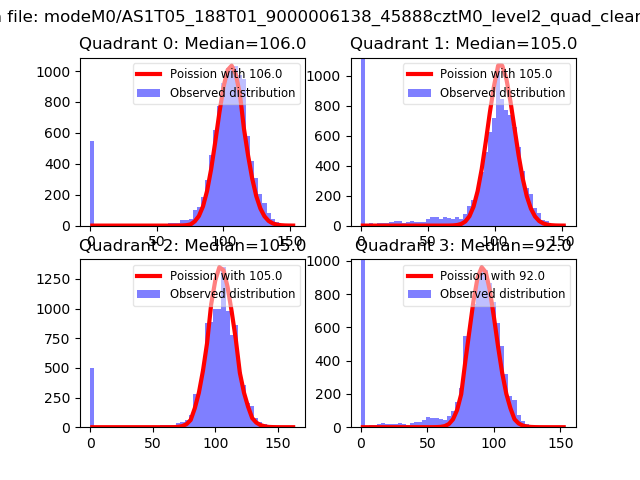 |
 |
| Quadrant-wise count rates Data is divided into 100 sec bins |
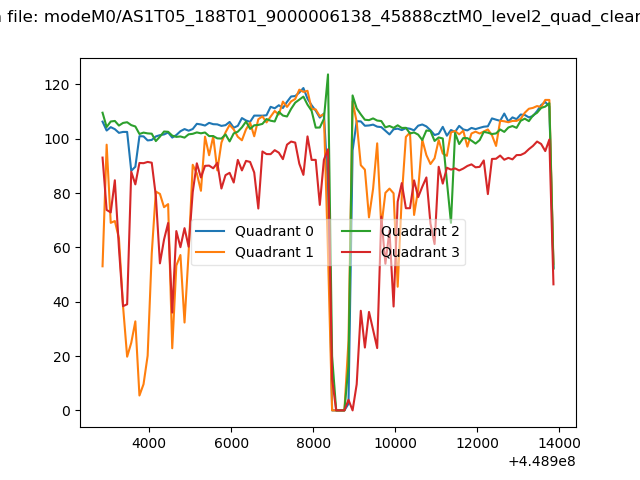 |
|
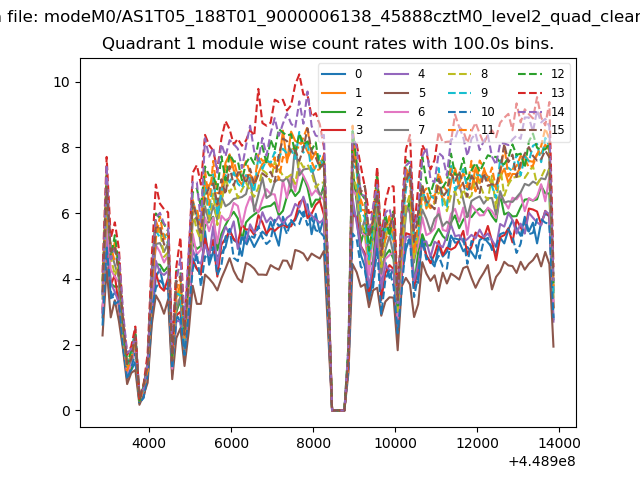
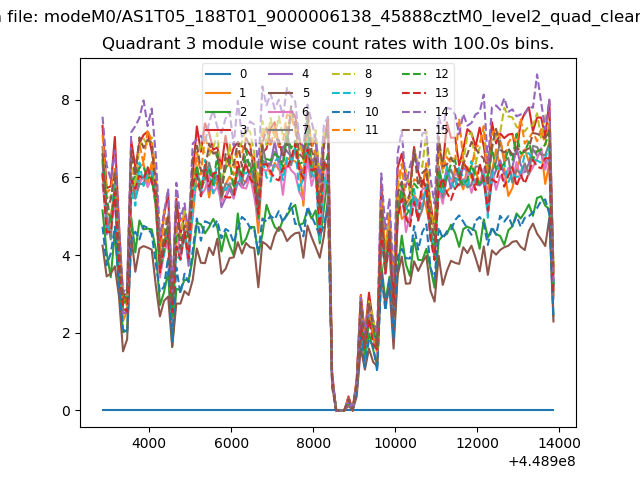
| Module-wise count rates for Quadrant A Data is divided into 100 sec bins |
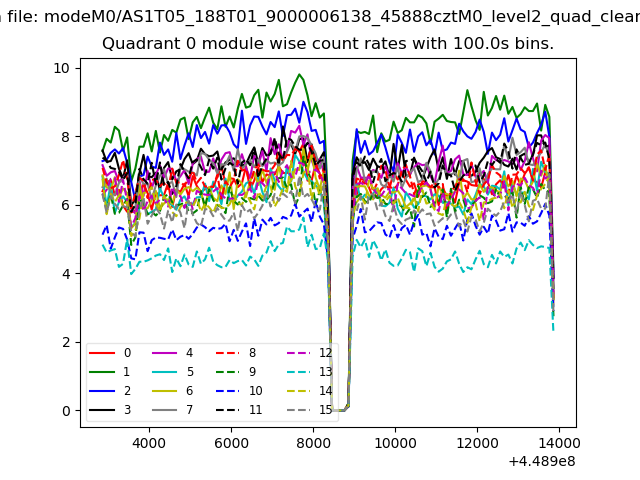 |
 |
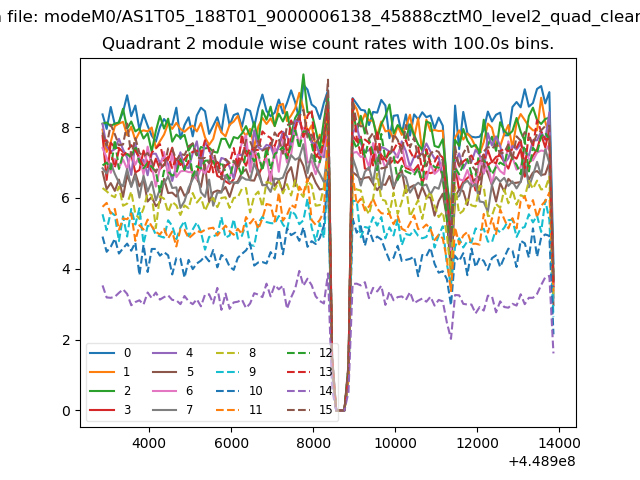
| Module-wise count rates for Quadrant B Data is divided into 100 sec bins |
 |
 |
| Module-wise count rates for Quadrant C Data is divided into 100 sec bins |
 |
 |
| Module-wise count rates for Quadrant D Data is divided into 100 sec bins |
 |
 |
| Parameter | Plot |
|---|---|
| CZT HV Monitor | 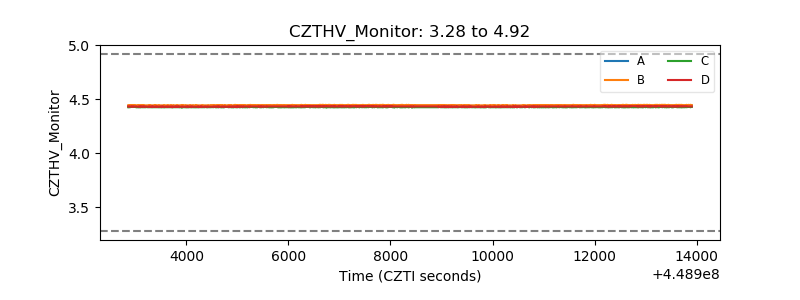 |
| D_VDD | 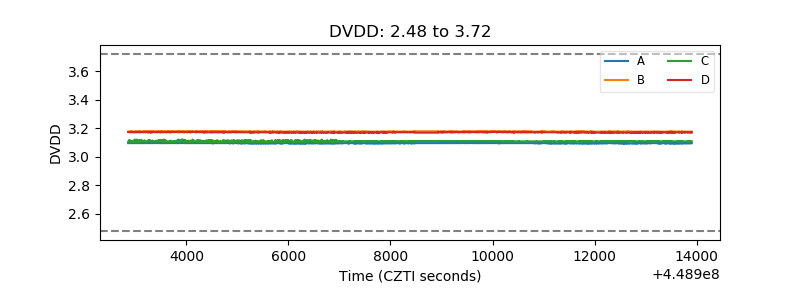 |
| Temperature 1 | 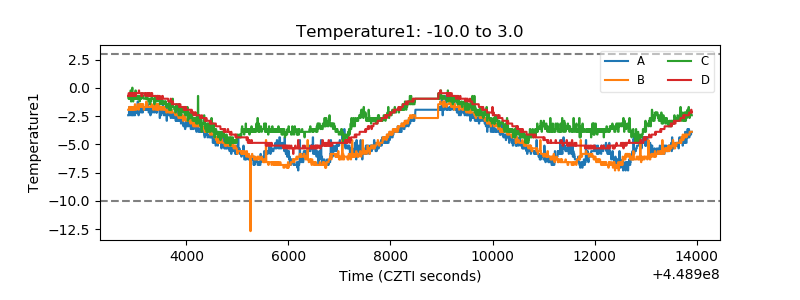 |
| Veto HV Monitor | 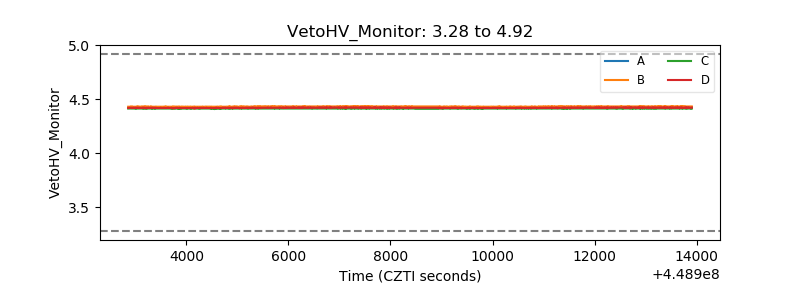 |
| Veto LLD | 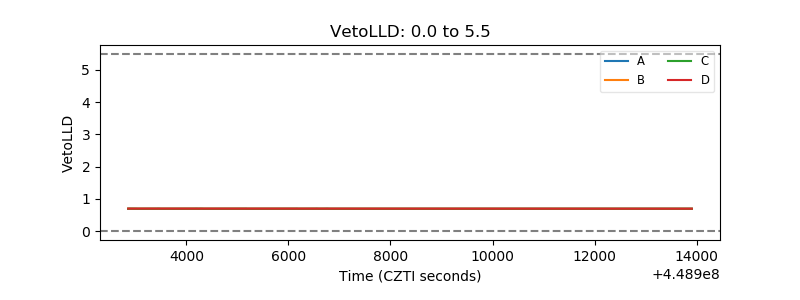 |
| Alpha Counter | 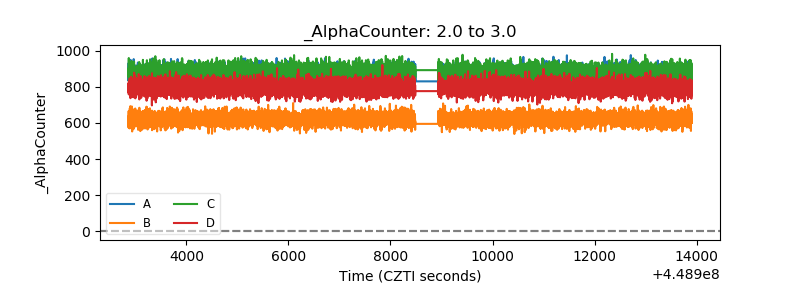 |
| _CPM_Rate | 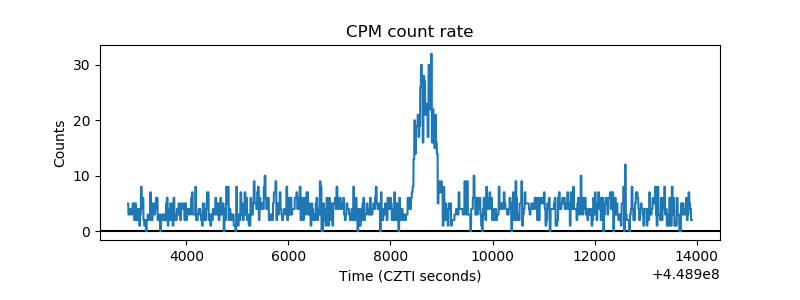 |
| CZT Counter | 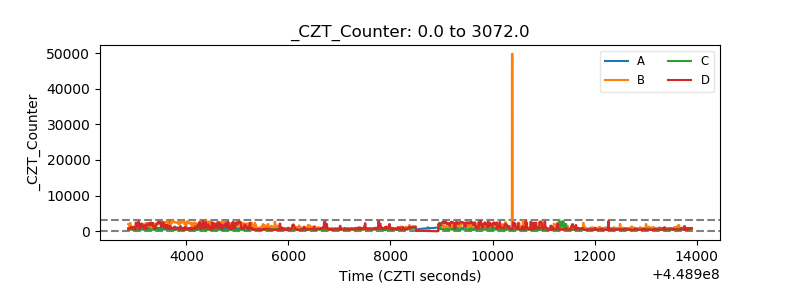 |
| +2.5 Volts monitor |  |
| +5 Volts monitor | 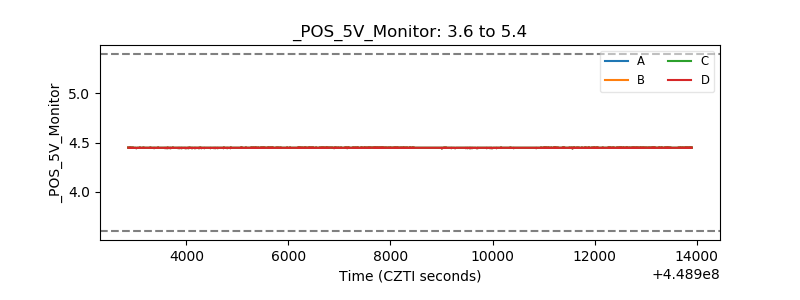 |
| _ROLL_ROT | 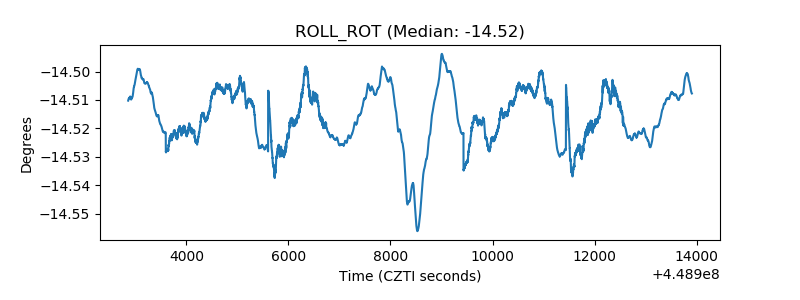 |
| _Roll_DEC | 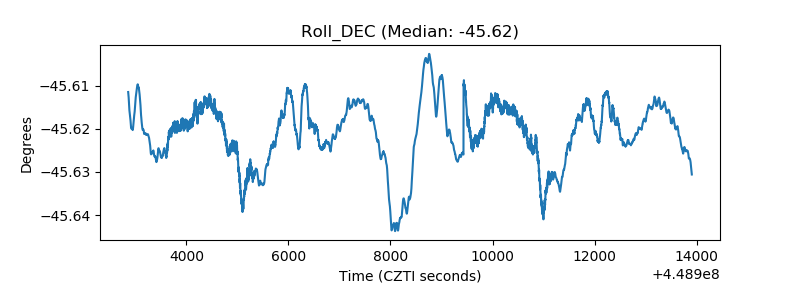 |
| _Roll_RA | 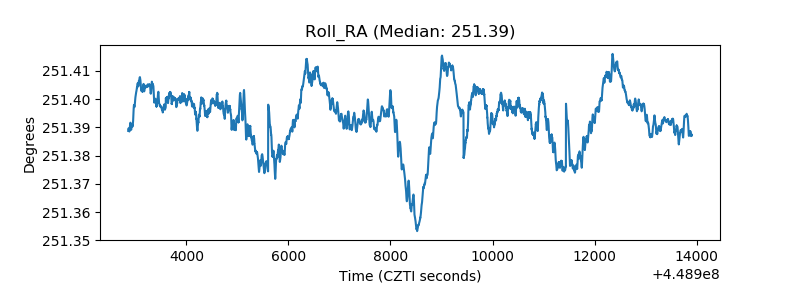 |
| Veto Counter | 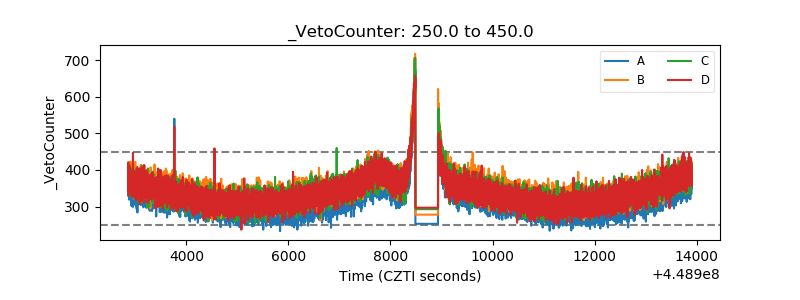 |