| Param | Original file | Final file |
|---|---|---|
| Filename | modeM0/AS1T05_188T01_9000006138_45889cztM0_level2.fits | modeM0/AS1T05_188T01_9000006138_45889cztM0_level2_quad_clean.evt |
| Size (bytes) | 694,408,320 | 127,563,840 |
| Size | 662.2 MB | 121.7 MB |
| Events in quadrant A | 7,188,040 | 864,045 |
| Events in quadrant B | 8,756,972 | 785,494 |
| Events in quadrant C | 3,625,911 | 872,146 |
| Events in quadrant D | 5,500,272 | 771,651 |
| Mode SS | |||
|---|---|---|---|
| Quadrant | BADHDUFLAG | Total packets | Discarded packets |
| A | 0 | 168 | 0 |
| B | 0 | 168 | 0 |
| C | 0 | 168 | 0 |
| D | 0 | 168 | 0 |
| Mode M0 | |||
|---|---|---|---|
| Quadrant | BADHDUFLAG | Total packets | Discarded packets |
| A | 0 | 26959 | 2 |
| B | 0 | 31699 | 2 |
| C | 0 | 16658 | 2 |
| D | 0 | 22196 | 2 |
| Mode M9 | |||
|---|---|---|---|
| Quadrant | BADHDUFLAG | Total packets | Discarded packets |
| A | 0 | 14 | 0 |
| B | 0 | 14 | 0 |
| C | 0 | 14 | 0 |
| D | 0 | 14 | 0 |
| Quadrant | Total seconds | Saturated seconds | Saturation percentage |
|---|---|---|---|
| A | 8183 | 310 | 3.788342% |
| B | 8183 | 1430 | 17.475254% |
| C | 8184 | 36 | 0.439883% |
| D | 8184 | 357 | 4.362170% |
Noise dominated data is calculated using 1-second bins in cleaned event files. If a bin has >2000 counts, and if more than 50% of those come from <1% of pixels, then it is considered to be noise-dominated and hence unusable.
| Quadrant | # 1 sec bins | Bins with >0 counts | Bins with >2000 counts | High rate bins dominated by noise | Noise dominated (total time) | Noise dominated (detector-on time) | Marked lightcurve |
|---|---|---|---|---|---|---|---|
| A | 9588 | 8184 | 29 | 29 | 0.30% | 0.35% | 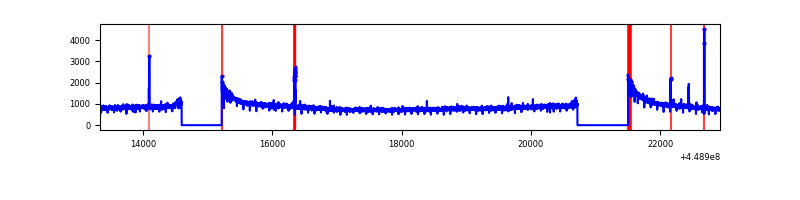 |
| B | 9588 | 8183 | 757 | 757 | 7.90% | 9.25% | 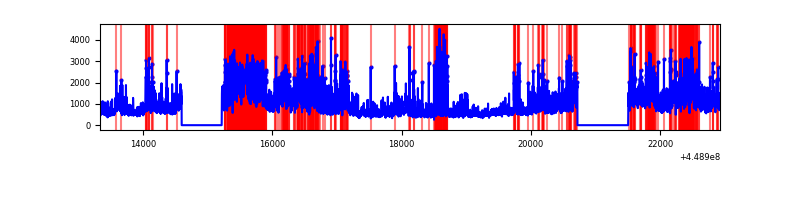 |
| C | 9589 | 8186 | 0 | 0 | 0.00% | 0.00% | 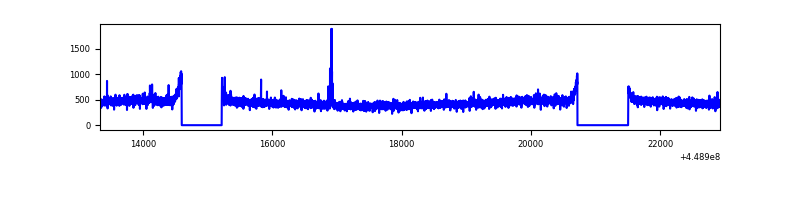 |
| D | 9589 | 8186 | 242 | 242 | 2.52% | 2.96% | 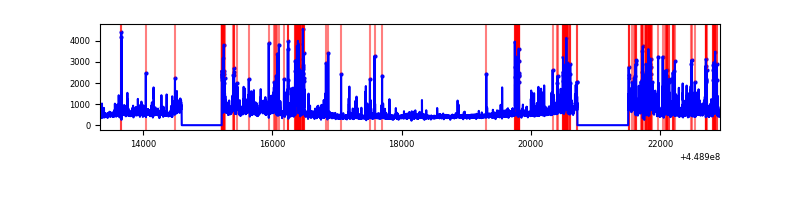 |
Top three noisy pixels from each quadrant. If the there are fewer than three noisy pixels in the level2.evt file, extra rows are filled as -1
| Pixel properties | Quadrant properties | ||||||
|---|---|---|---|---|---|---|---|
| Quadrant | DetID | PixID | Counts | Sigma | Mean | Median | Sigma |
| A | 10 | 83 | 3501169 | 17999.29 | 931 | 910 | 194.5 |
| A | 13 | 248 | 38524 | 193.42 | 931 | 910 | 194.5 |
| A | 10 | 255 | 12141 | 57.75 | 931 | 910 | 194.5 |
| B | 3 | 112 | 4146346 | 23724.68 | 881 | 854 | 174.7 |
| B | 4 | 171 | 491187 | 2806.18 | 881 | 854 | 174.7 |
| B | 0 | 189 | 347687 | 1984.93 | 881 | 854 | 174.7 |
| C | 10 | 20 | 16378 | 70.87 | 920 | 923 | 218.1 |
| C | 15 | 208 | 6848 | 27.17 | 920 | 923 | 218.1 |
| C | 13 | 61 | 6312 | 24.71 | 920 | 923 | 218.1 |
| D | 1 | 52 | 951650 | 4193.23 | 900 | 873 | 226.7 |
| D | 13 | 249 | 318415 | 1400.46 | 900 | 873 | 226.7 |
| D | 12 | 233 | 261508 | 1149.48 | 900 | 873 | 226.7 |
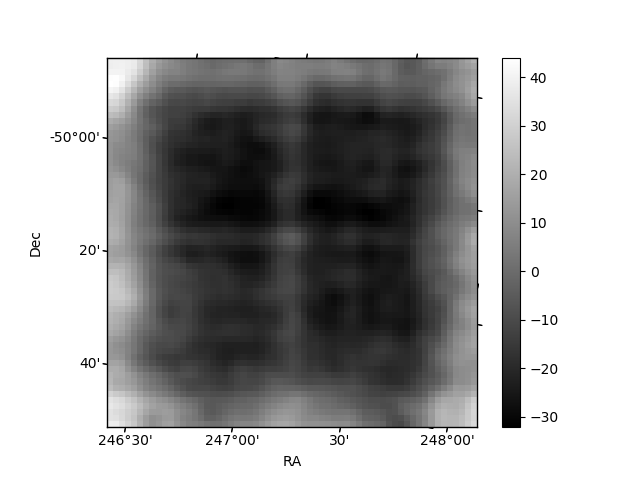
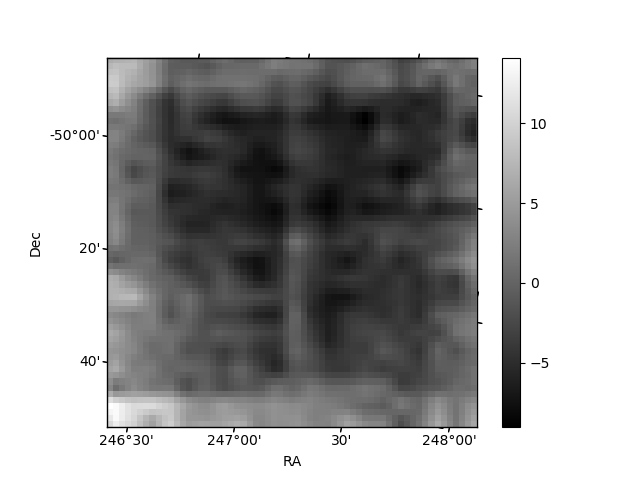
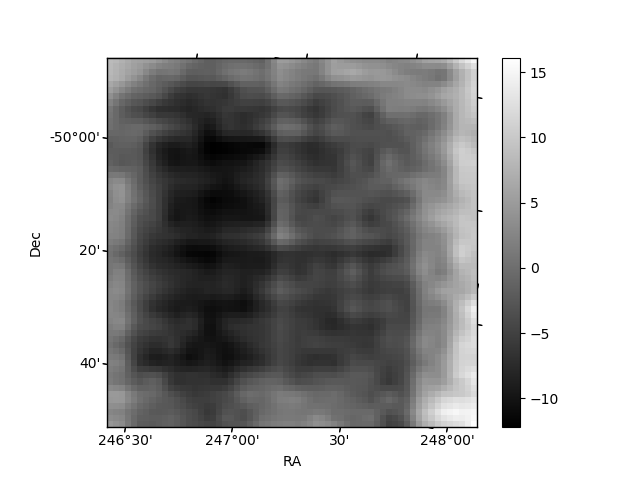
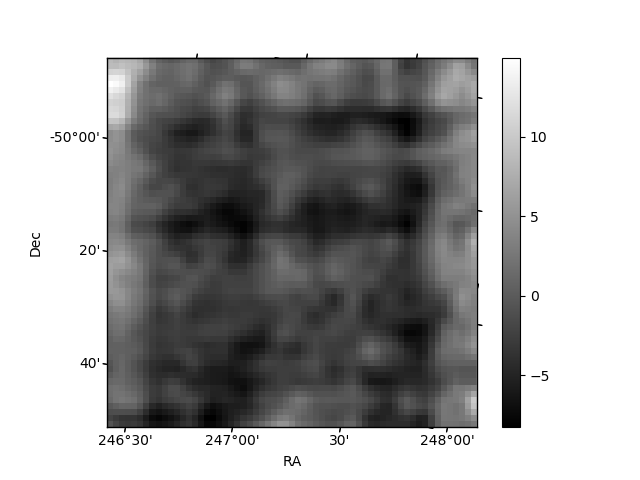
Histogram calculated using DETX and DETY for each event in the final _common_clean file
| Quadrant A | 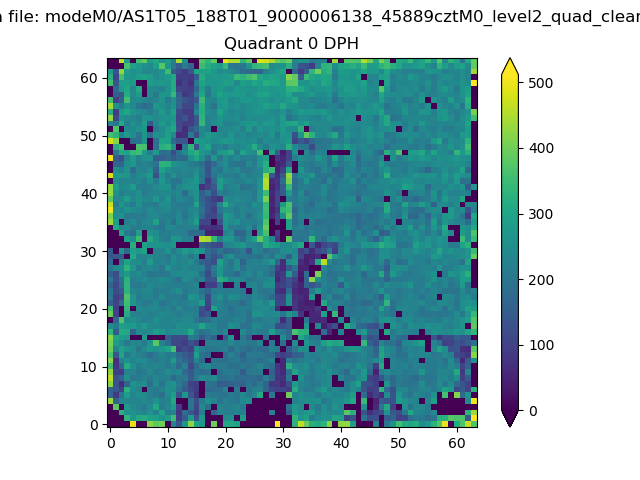 |
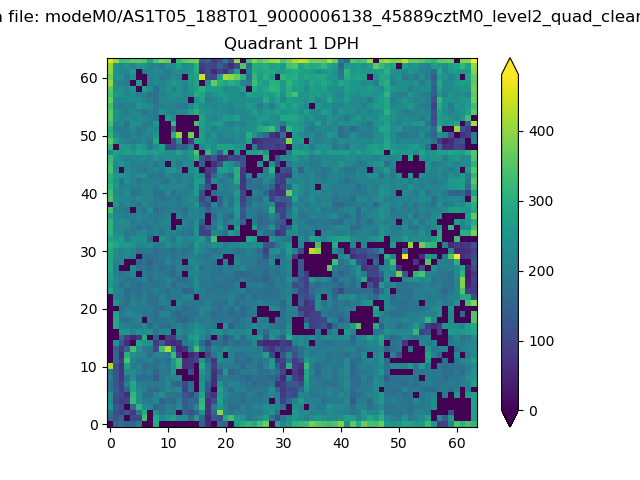 |
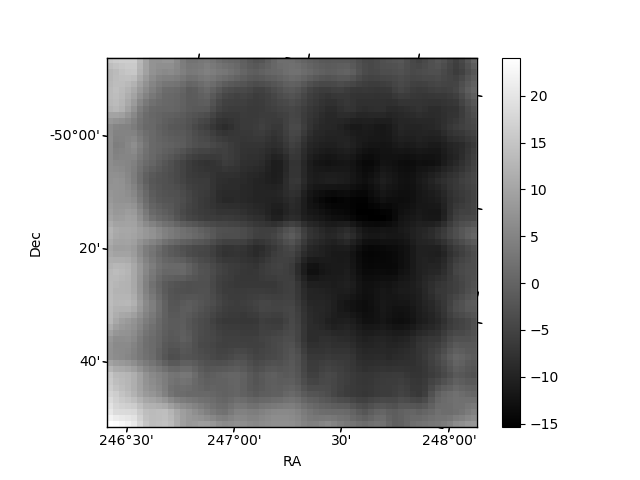
Quadrant B |
|---|---|---|---|
| Quadrant D | 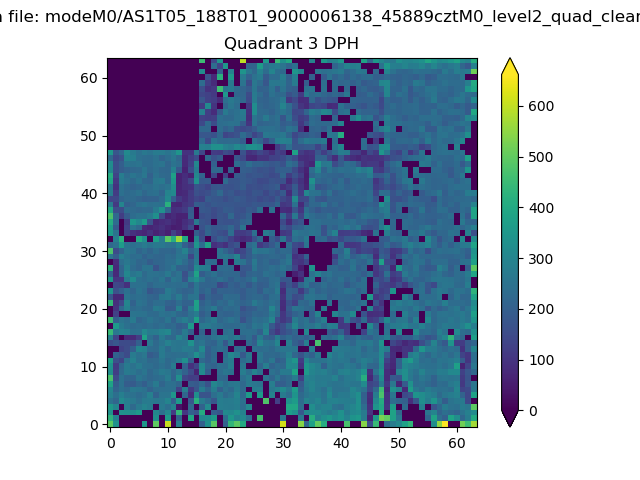 |
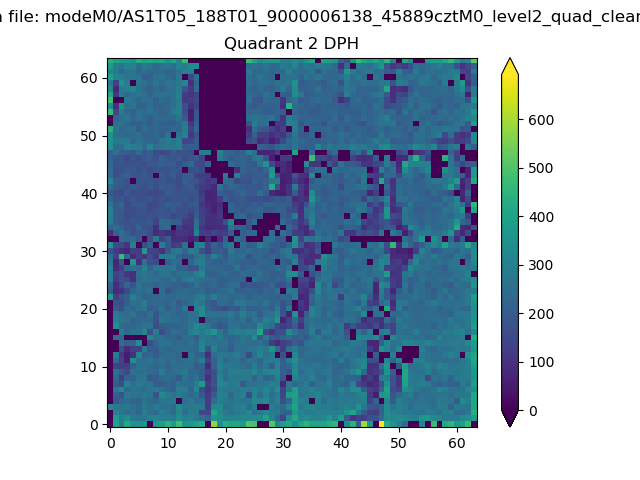 |
Quadrant C |
| Plot type | Count rate plots | Images |
|---|---|---|
| Comparison with Poisson distribution Blue bars denote a histogram of data divided into 1 sec bins. Red curve is a Poisson curve with rate = median count rate of data. |
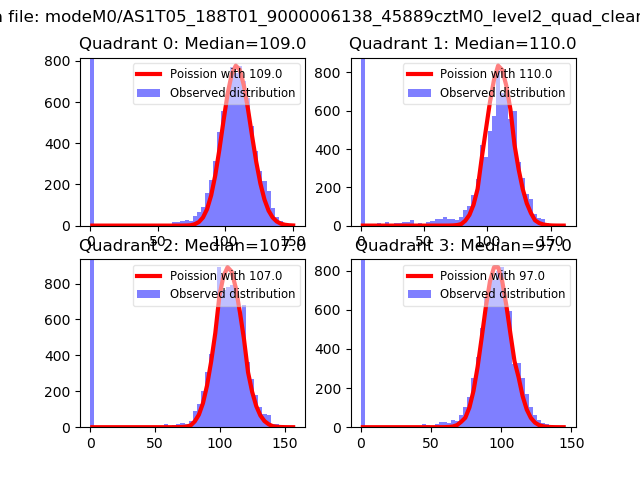 |
 |
| Quadrant-wise count rates Data is divided into 100 sec bins |
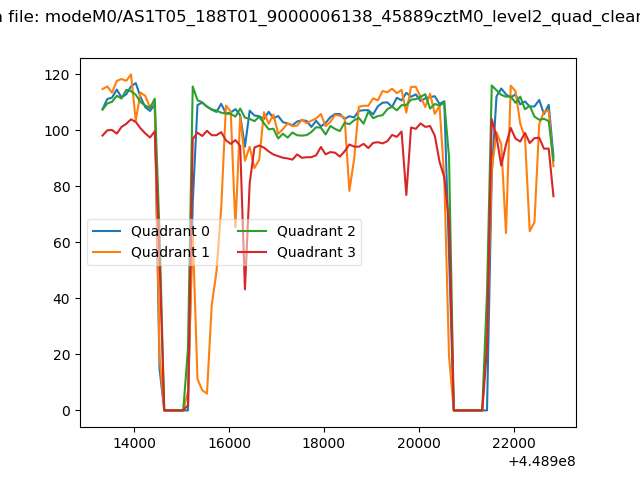 |
|
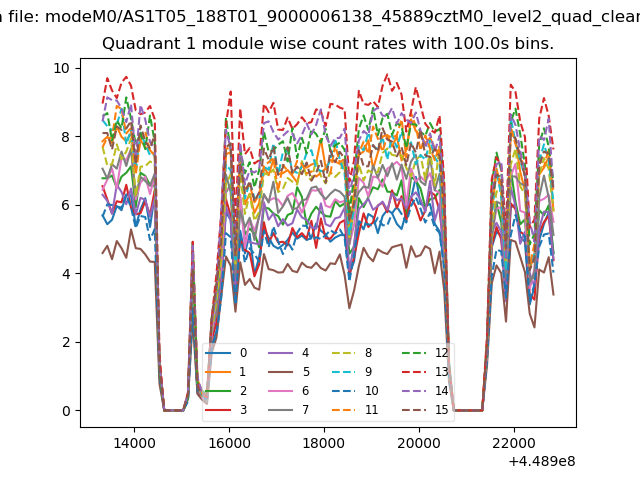
| Module-wise count rates for Quadrant A Data is divided into 100 sec bins |
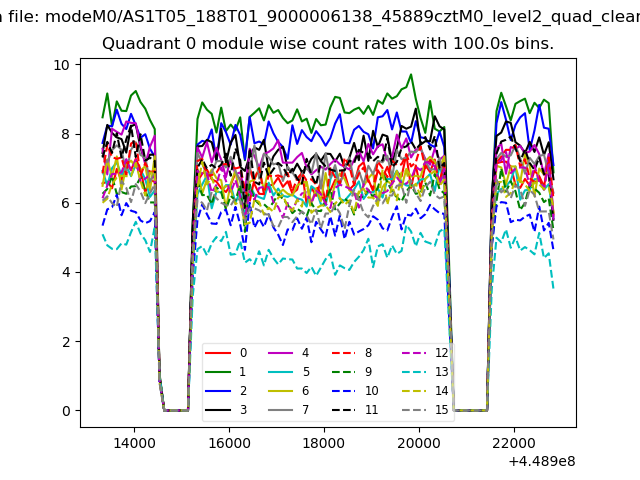 |
 |
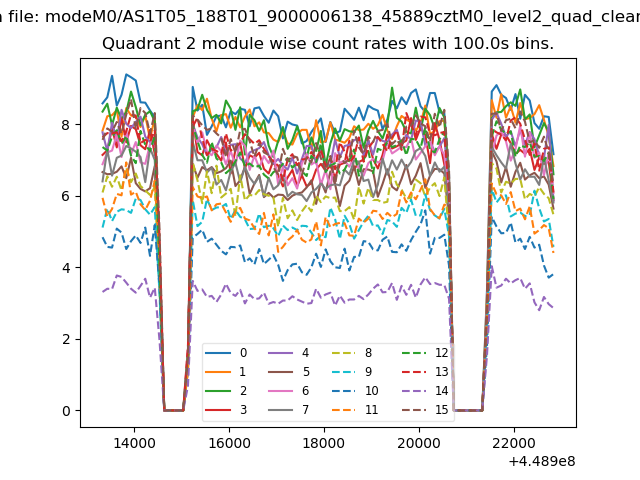
| Module-wise count rates for Quadrant B Data is divided into 100 sec bins |
 |
 |
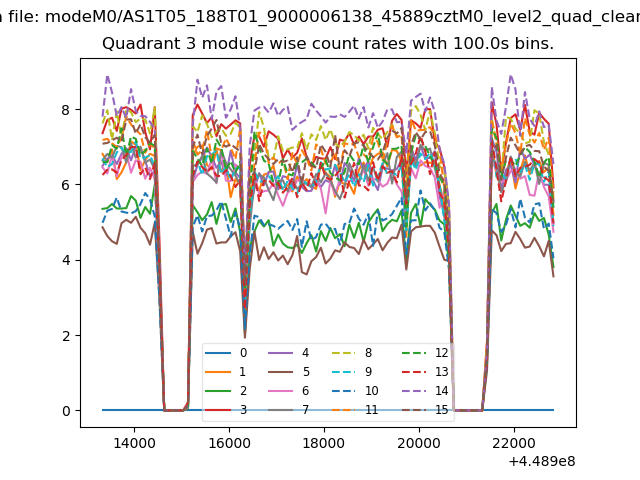
| Module-wise count rates for Quadrant C Data is divided into 100 sec bins |
 |
 |
| Module-wise count rates for Quadrant D Data is divided into 100 sec bins |
 |
 |
| Parameter | Plot |
|---|---|
| CZT HV Monitor | 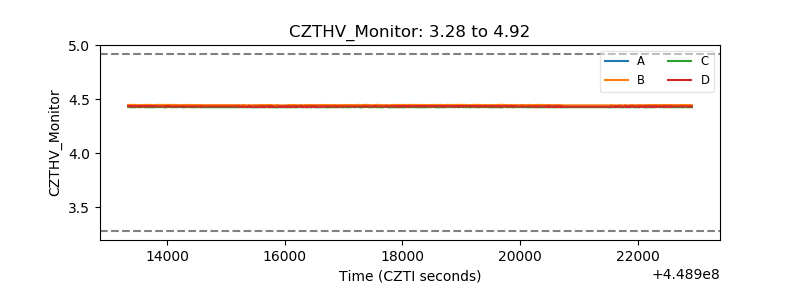 |
| D_VDD | 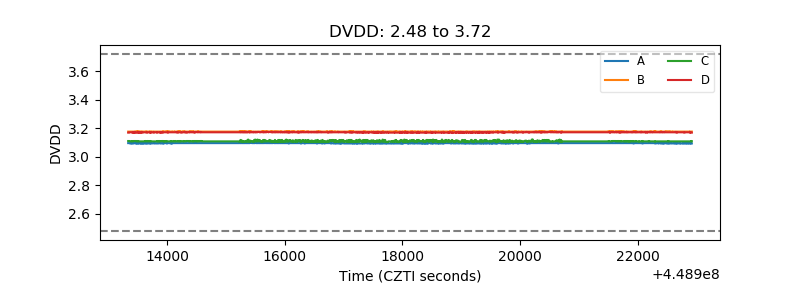 |
| Temperature 1 | 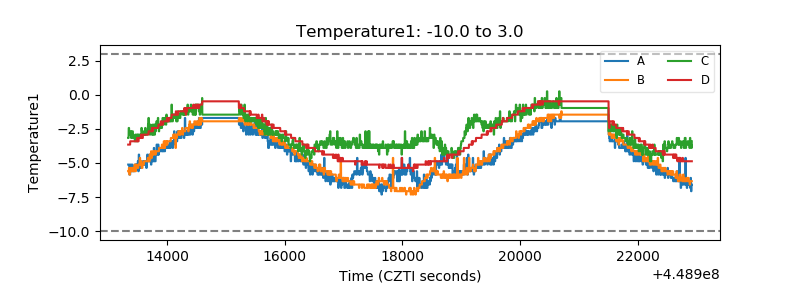 |
| Veto HV Monitor |  |
| Veto LLD | 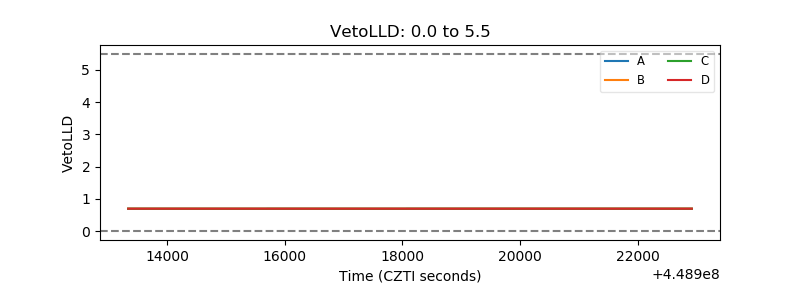 |
| Alpha Counter | 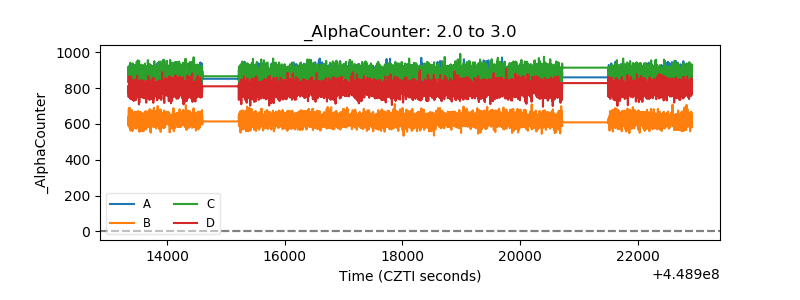 |
| _CPM_Rate | 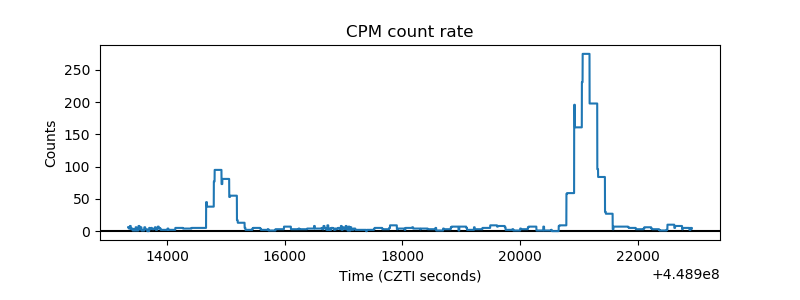 |
| CZT Counter | 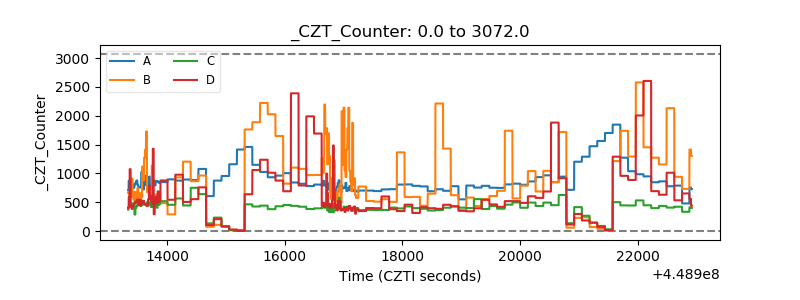 |
| +2.5 Volts monitor | 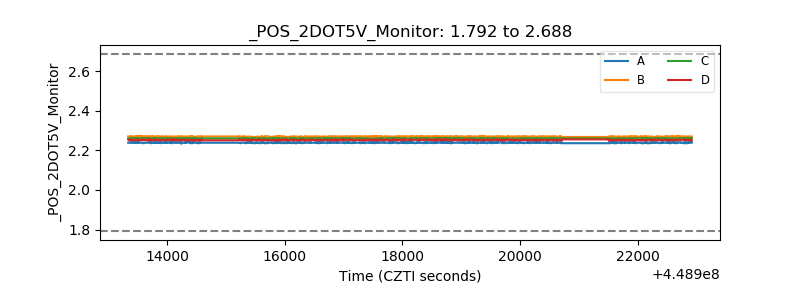 |
| +5 Volts monitor | 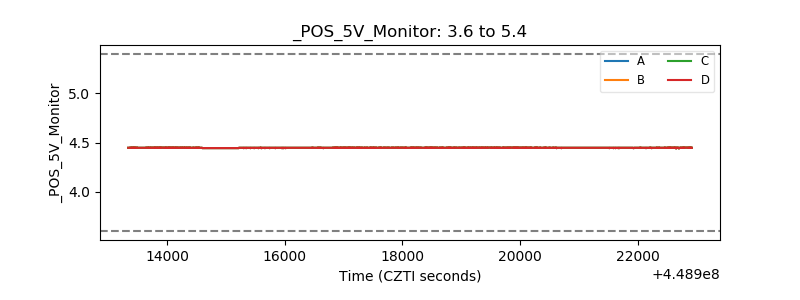 |
| _ROLL_ROT | 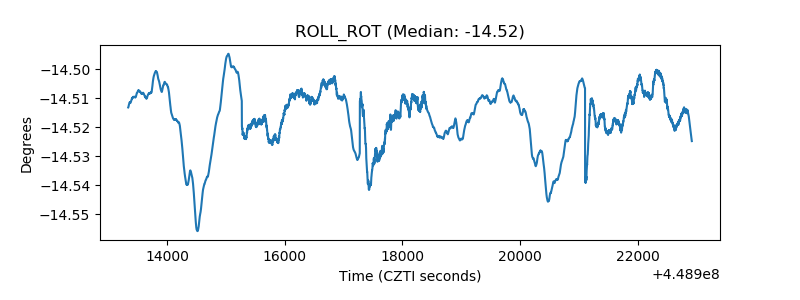 |
| _Roll_DEC | 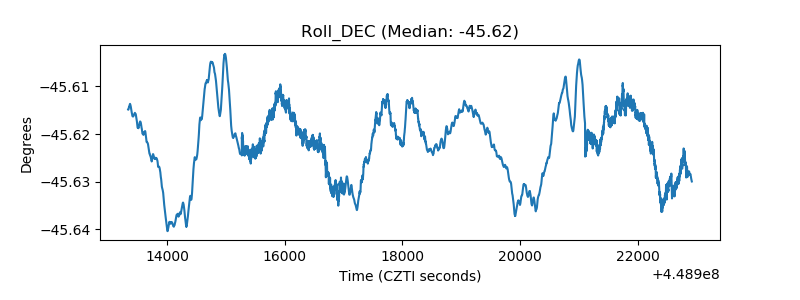 |
| _Roll_RA | 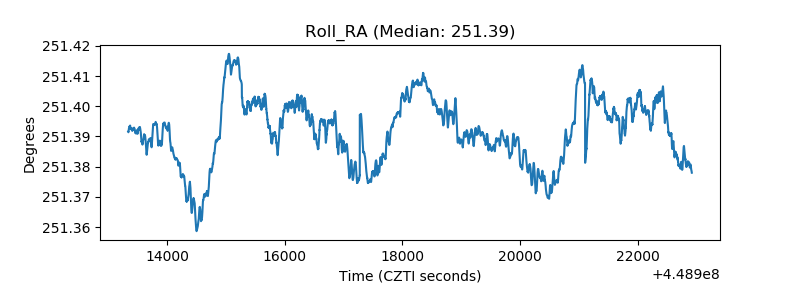 |
| Veto Counter | 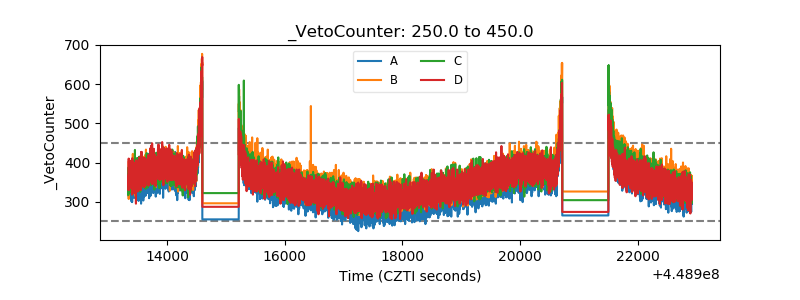 |