| Param | Original file | Final file |
|---|---|---|
| Filename | modeM0/AS1T05_188T01_9000006138_45890cztM0_level2.fits | modeM0/AS1T05_188T01_9000006138_45890cztM0_level2_quad_clean.evt |
| Size (bytes) | 510,180,480 | 103,380,480 |
| Size | 486.5 MB | 98.6 MB |
| Events in quadrant A | 5,610,814 | 699,632 |
| Events in quadrant B | 5,801,612 | 663,433 |
| Events in quadrant C | 2,852,029 | 696,110 |
| Events in quadrant D | 4,119,723 | 620,647 |
| Mode SS | |||
|---|---|---|---|
| Quadrant | BADHDUFLAG | Total packets | Discarded packets |
| A | 0 | 130 | 0 |
| B | 0 | 130 | 0 |
| C | 0 | 130 | 0 |
| D | 0 | 130 | 0 |
| Mode M0 | |||
|---|---|---|---|
| Quadrant | BADHDUFLAG | Total packets | Discarded packets |
| A | 0 | 21272 | 1 |
| B | 0 | 21632 | 1 |
| C | 0 | 13141 | 1 |
| D | 0 | 16814 | 1 |
| Mode M9 | |||
|---|---|---|---|
| Quadrant | BADHDUFLAG | Total packets | Discarded packets |
| A | 0 | 10 | 0 |
| B | 0 | 10 | 0 |
| C | 0 | 10 | 0 |
| D | 0 | 10 | 0 |
| Quadrant | Total seconds | Saturated seconds | Saturation percentage |
|---|---|---|---|
| A | 6459 | 133 | 2.059142% |
| B | 6460 | 745 | 11.532508% |
| C | 6459 | 13 | 0.201270% |
| D | 6459 | 170 | 2.631986% |
Noise dominated data is calculated using 1-second bins in cleaned event files. If a bin has >2000 counts, and if more than 50% of those come from <1% of pixels, then it is considered to be noise-dominated and hence unusable.
| Quadrant | # 1 sec bins | Bins with >0 counts | Bins with >2000 counts | High rate bins dominated by noise | Noise dominated (total time) | Noise dominated (detector-on time) | Marked lightcurve |
|---|---|---|---|---|---|---|---|
| A | 7429 | 6460 | 34 | 34 | 0.46% | 0.53% | 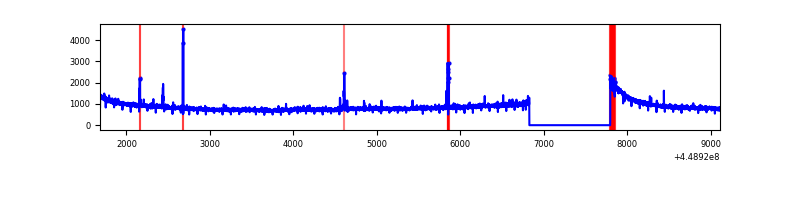 |
| B | 7430 | 6461 | 371 | 371 | 4.99% | 5.74% | 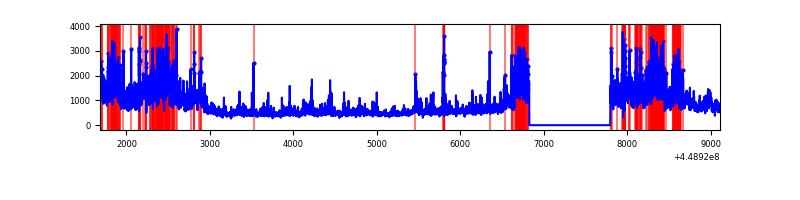 |
| C | 7429 | 6460 | 7 | 7 | 0.09% | 0.11% | 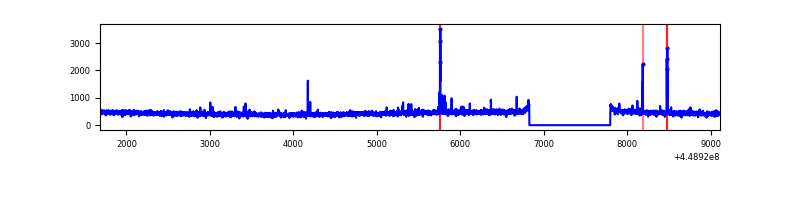 |
| D | 7429 | 6460 | 146 | 146 | 1.97% | 2.26% | 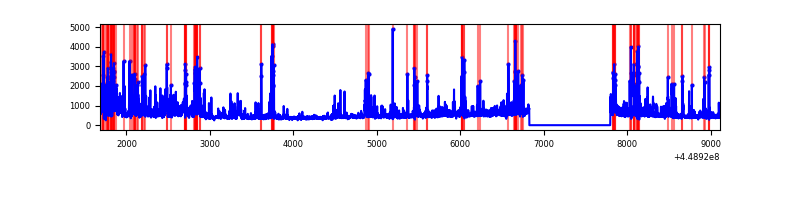 |
Top three noisy pixels from each quadrant. If the there are fewer than three noisy pixels in the level2.evt file, extra rows are filled as -1
| Pixel properties | Quadrant properties | ||||||
|---|---|---|---|---|---|---|---|
| Quadrant | DetID | PixID | Counts | Sigma | Mean | Median | Sigma |
| A | 10 | 83 | 2749160 | 18309.05 | 718 | 702 | 150.1 |
| A | 7 | 3 | 35435 | 231.38 | 718 | 702 | 150.1 |
| A | 4 | 0 | 26009 | 168.58 | 718 | 702 | 150.1 |
| B | 3 | 112 | 2789238 | 20105.56 | 702 | 682 | 138.7 |
| B | 4 | 171 | 91730 | 656.46 | 702 | 682 | 138.7 |
| B | 5 | 172 | 41751 | 296.11 | 702 | 682 | 138.7 |
| C | 2 | 14 | 50035 | 295.43 | 712 | 716 | 166.9 |
| C | 12 | 2 | 21604 | 125.12 | 712 | 716 | 166.9 |
| C | 3 | 233 | 5019 | 25.78 | 712 | 716 | 166.9 |
| D | 1 | 52 | 897047 | 5124.83 | 695 | 673 | 174.9 |
| D | 11 | 192 | 120756 | 686.55 | 695 | 673 | 174.9 |
| D | 5 | 171 | 97147 | 551.57 | 695 | 673 | 174.9 |
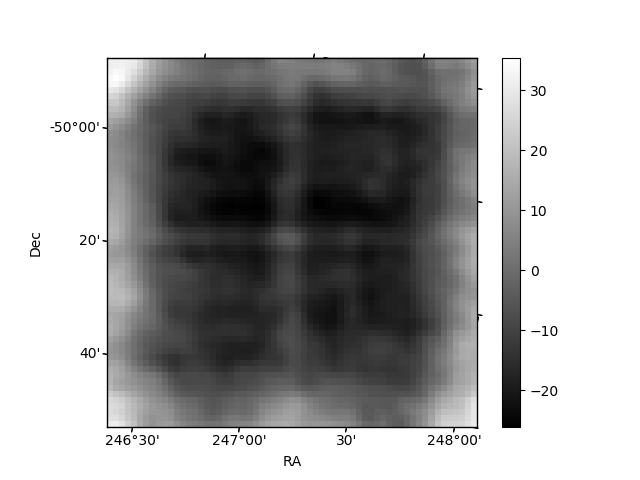
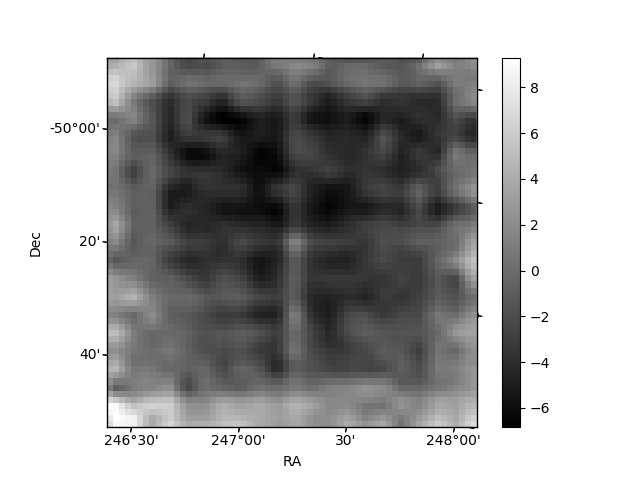
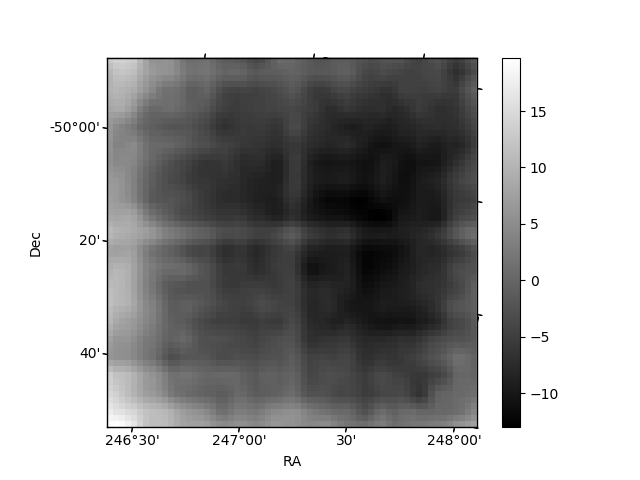
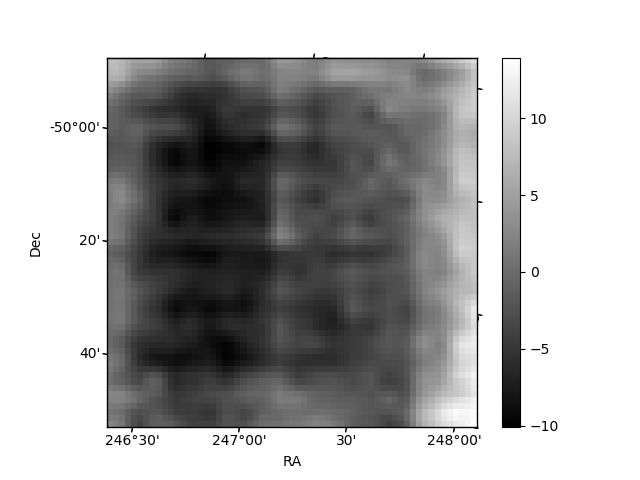
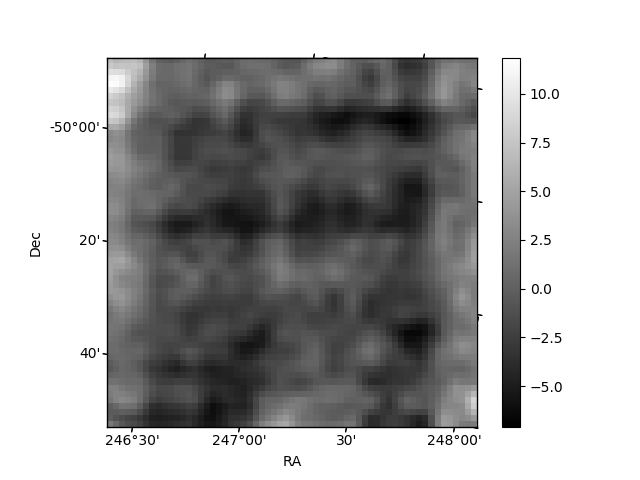
Histogram calculated using DETX and DETY for each event in the final _common_clean file
| Quadrant A | 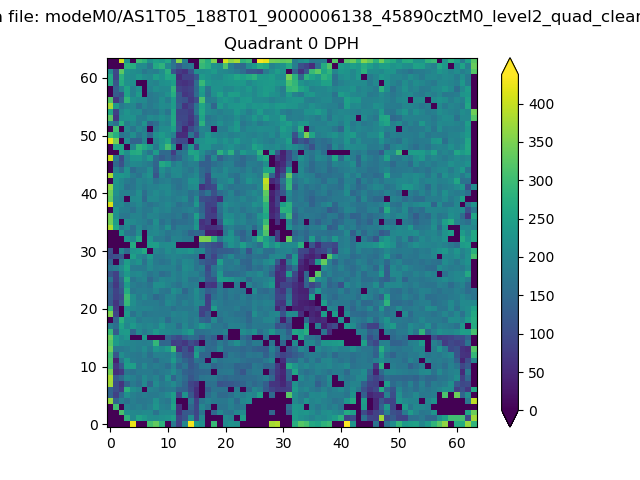 |
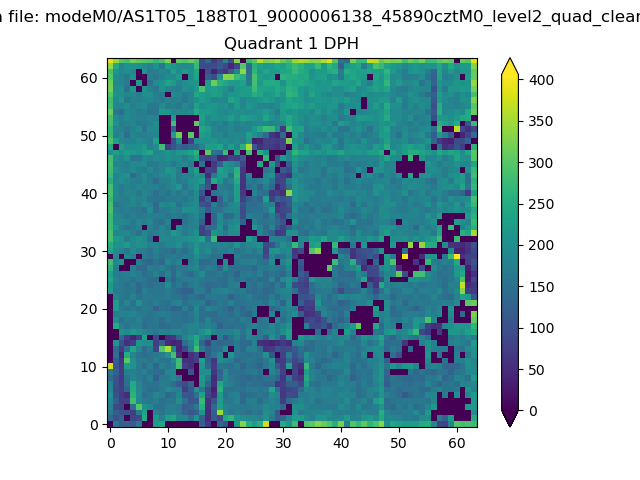 |
Quadrant B |
|---|---|---|---|
| Quadrant D | 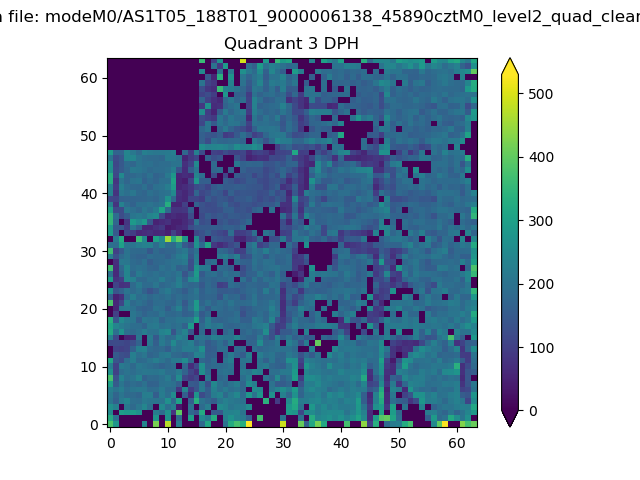 |
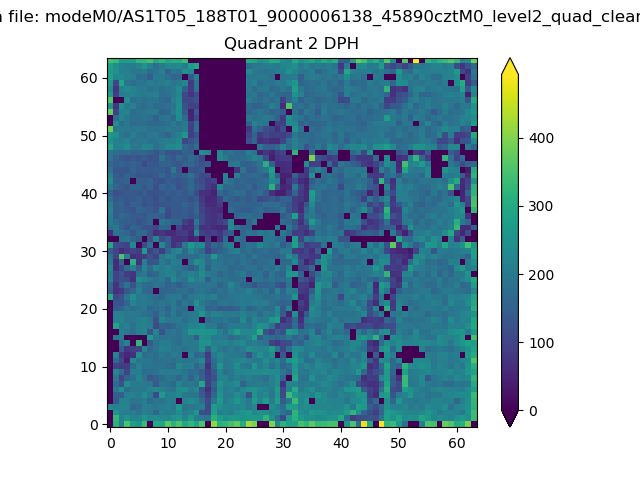 |
Quadrant C |
| Plot type | Count rate plots | Images |
|---|---|---|
| Comparison with Poisson distribution Blue bars denote a histogram of data divided into 1 sec bins. Red curve is a Poisson curve with rate = median count rate of data. |
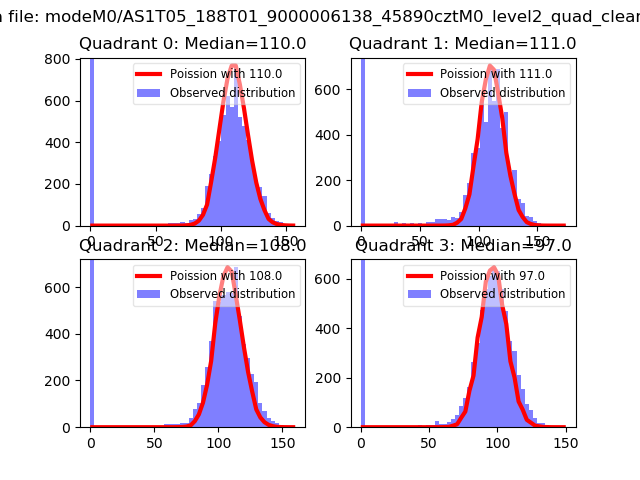 |
 |
| Quadrant-wise count rates Data is divided into 100 sec bins |
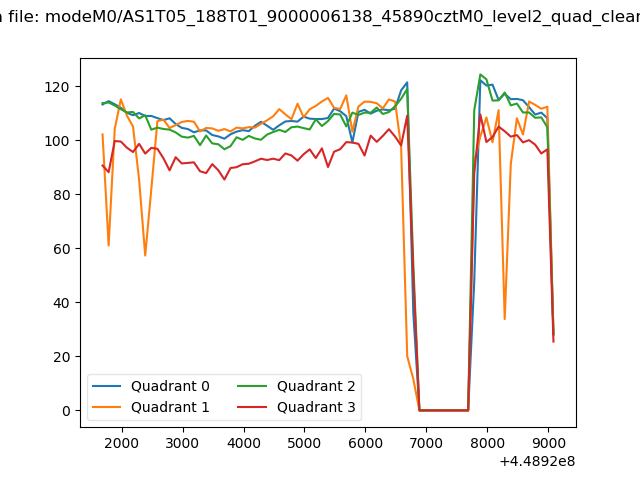 |
|
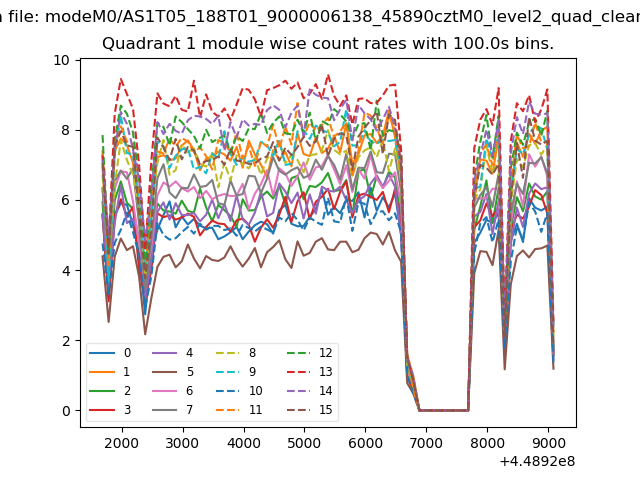
| Module-wise count rates for Quadrant A Data is divided into 100 sec bins |
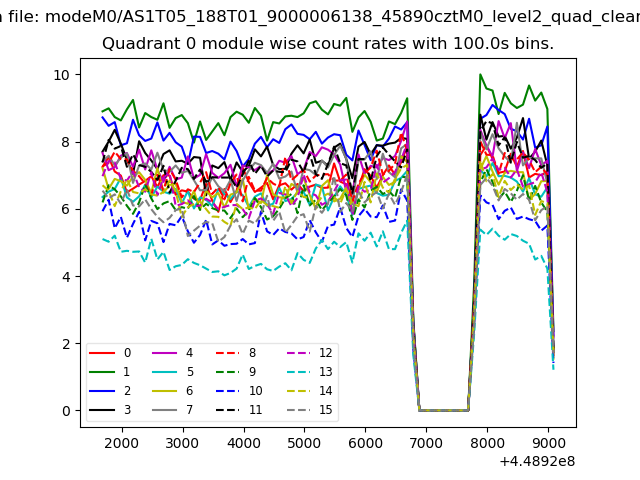 |
 |
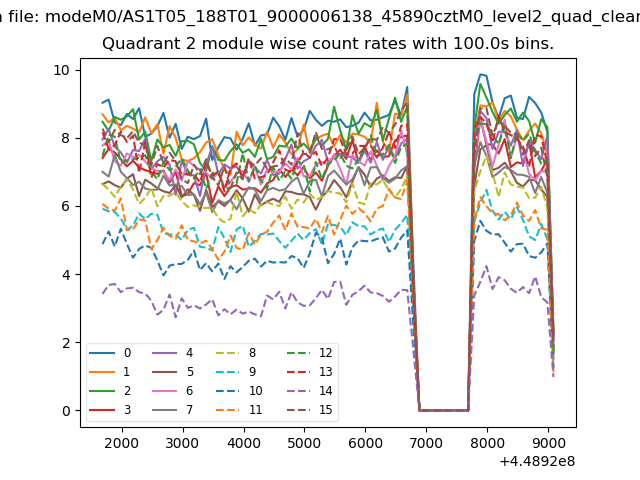
| Module-wise count rates for Quadrant B Data is divided into 100 sec bins |
 |
 |
| Module-wise count rates for Quadrant C Data is divided into 100 sec bins |
 |
 |
| Module-wise count rates for Quadrant D Data is divided into 100 sec bins |
 |
 |
| Parameter | Plot |
|---|---|
| CZT HV Monitor | 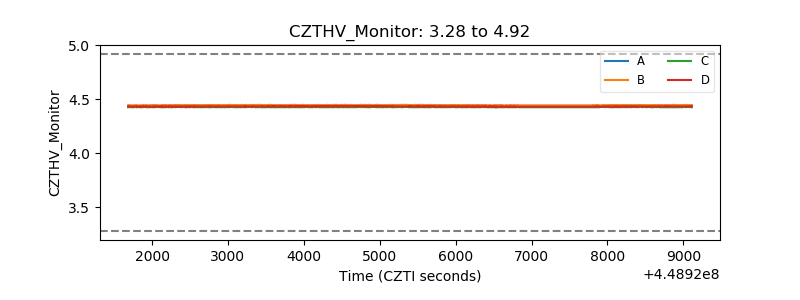 |
| D_VDD | 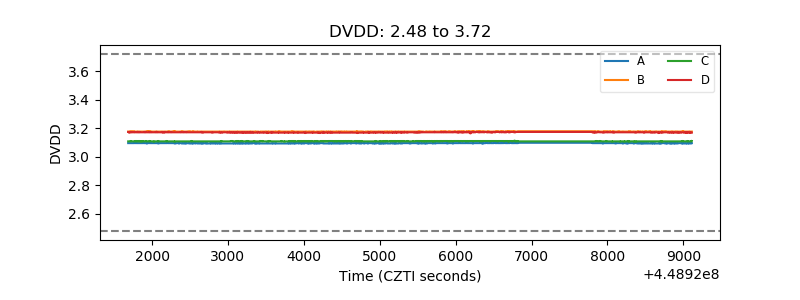 |
| Temperature 1 | 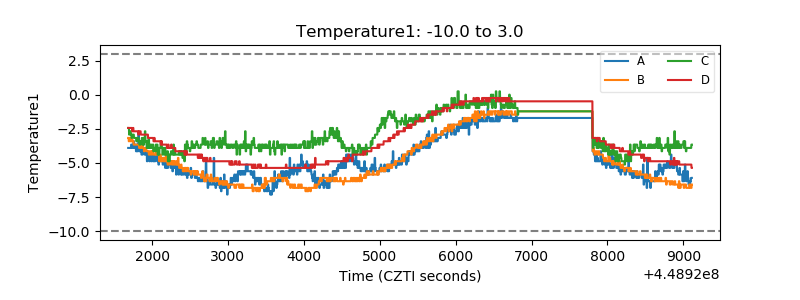 |
| Veto HV Monitor | 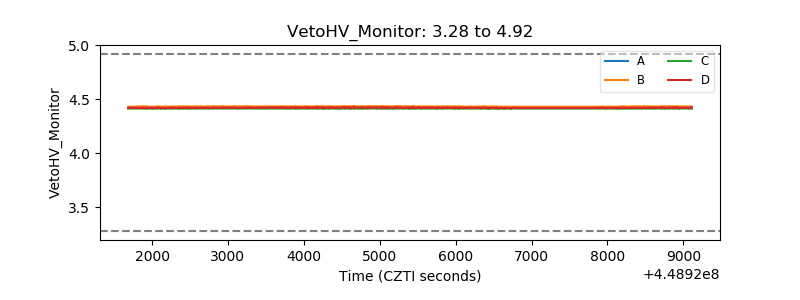 |
| Veto LLD | 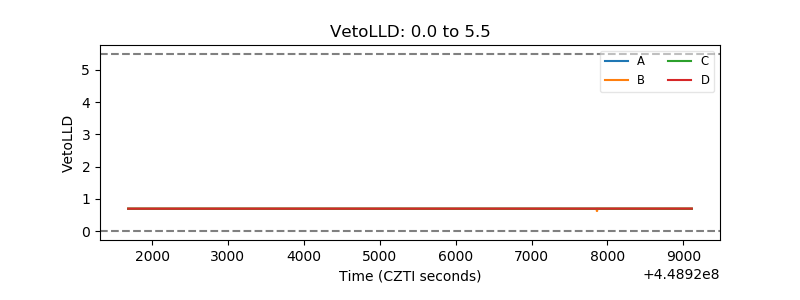 |
| Alpha Counter | 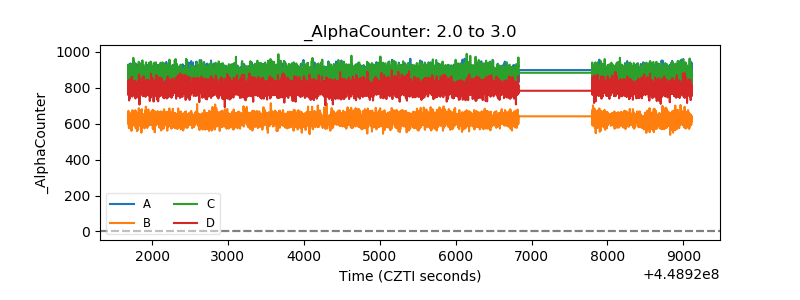 |
| _CPM_Rate | 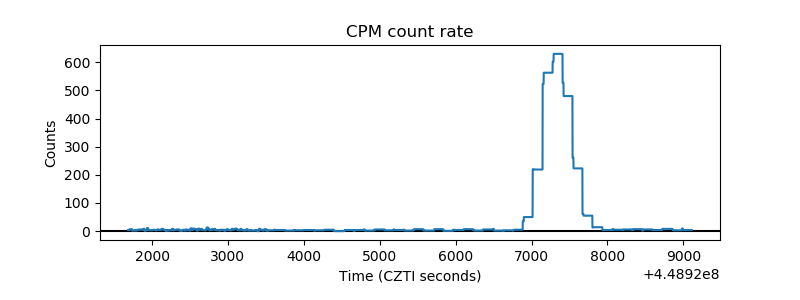 |
| CZT Counter | 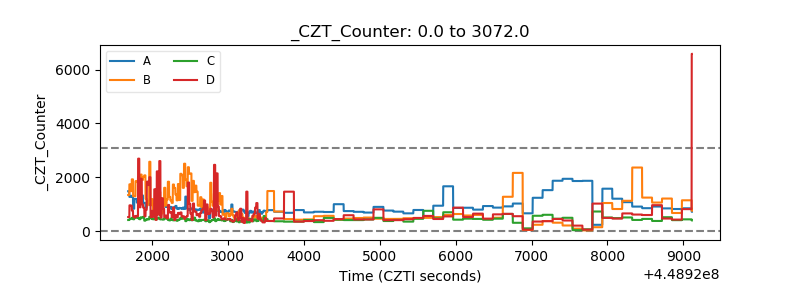 |
| +2.5 Volts monitor | 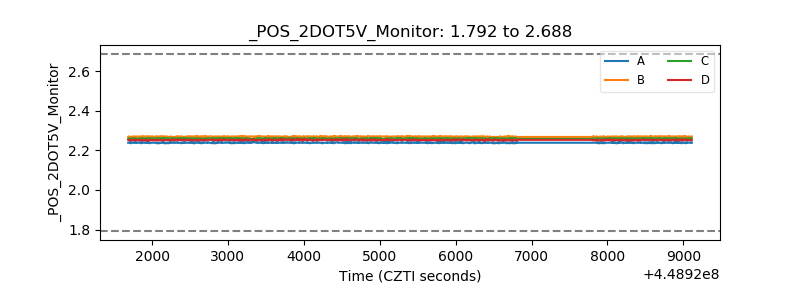 |
| +5 Volts monitor | 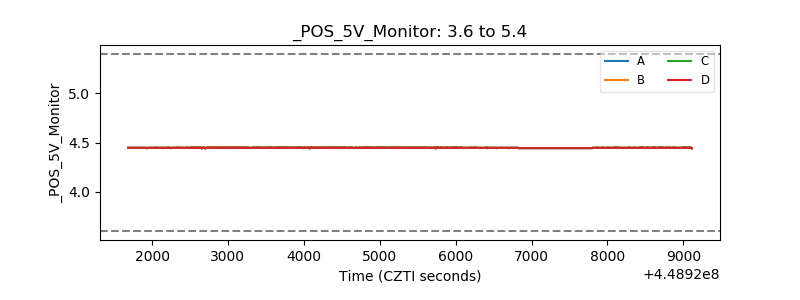 |
| _ROLL_ROT | 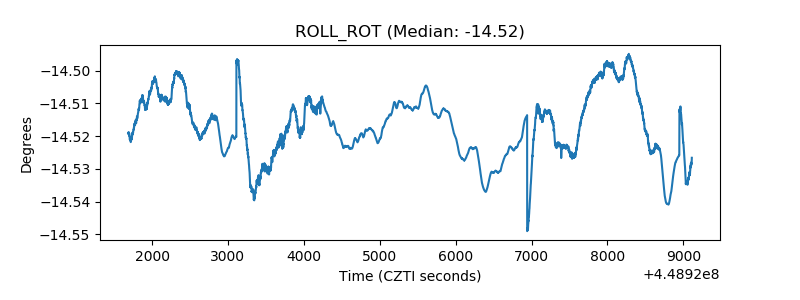 |
| _Roll_DEC | 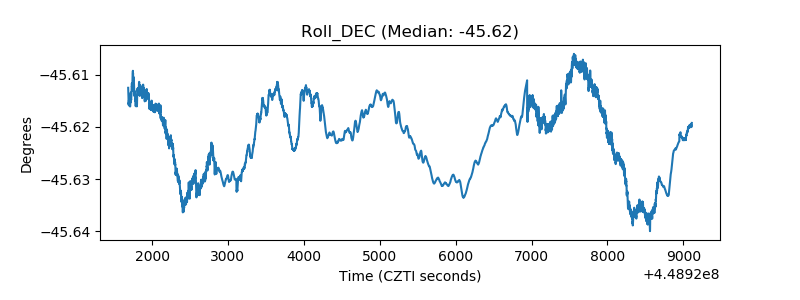 |
| _Roll_RA | 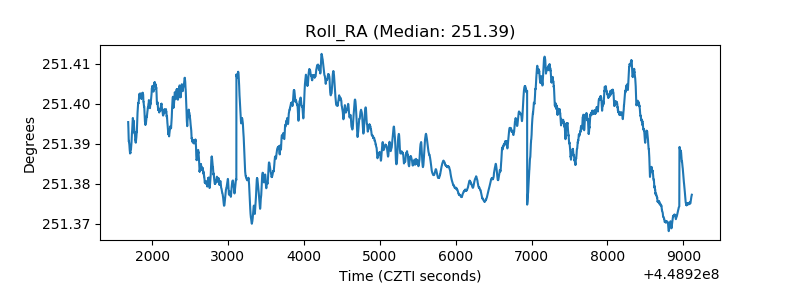 |
| Veto Counter |  |