| Param | Original file | Final file |
|---|---|---|
| Filename | modeM0/AS1T05_188T01_9000006138_45892cztM0_level2.fits | modeM0/AS1T05_188T01_9000006138_45892cztM0_level2_quad_clean.evt |
| Size (bytes) | 603,601,920 | 100,866,240 |
| Size | 575.6 MB | 96.2 MB |
| Events in quadrant A | 5,809,685 | 712,846 |
| Events in quadrant B | 8,571,303 | 528,751 |
| Events in quadrant C | 2,924,412 | 724,005 |
| Events in quadrant D | 4,533,235 | 634,304 |
| Mode SS | |||
|---|---|---|---|
| Quadrant | BADHDUFLAG | Total packets | Discarded packets |
| A | 0 | 132 | 0 |
| B | 0 | 132 | 0 |
| C | 0 | 132 | 0 |
| D | 0 | 132 | 0 |
| Mode M0 | |||
|---|---|---|---|
| Quadrant | BADHDUFLAG | Total packets | Discarded packets |
| A | 0 | 21757 | 2 |
| B | 0 | 30023 | 2 |
| C | 0 | 13312 | 2 |
| D | 0 | 18002 | 2 |
| Mode M9 | |||
|---|---|---|---|
| Quadrant | BADHDUFLAG | Total packets | Discarded packets |
| A | 0 | 18 | 0 |
| B | 0 | 19 | 0 |
| C | 0 | 19 | 0 |
| D | 0 | 19 | 0 |
| Quadrant | Total seconds | Saturated seconds | Saturation percentage |
|---|---|---|---|
| A | 6509 | 186 | 2.857582% |
| B | 6509 | 2214 | 34.014442% |
| C | 6509 | 23 | 0.353357% |
| D | 6509 | 276 | 4.240283% |
Noise dominated data is calculated using 1-second bins in cleaned event files. If a bin has >2000 counts, and if more than 50% of those come from <1% of pixels, then it is considered to be noise-dominated and hence unusable.
| Quadrant | # 1 sec bins | Bins with >0 counts | Bins with >2000 counts | High rate bins dominated by noise | Noise dominated (total time) | Noise dominated (detector-on time) | Marked lightcurve |
|---|---|---|---|---|---|---|---|
| A | 7554 | 6510 | 44 | 44 | 0.58% | 0.68% | 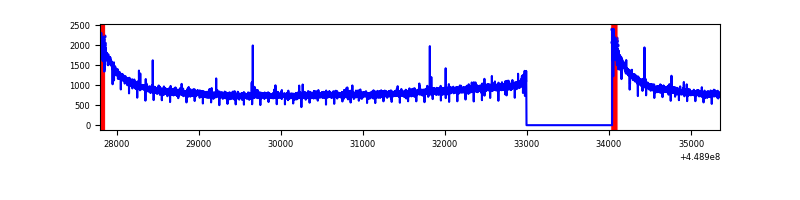 |
| B | 7554 | 6509 | 1426 | 1426 | 18.88% | 21.91% | 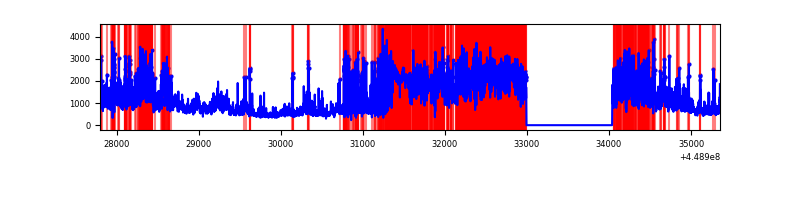 |
| C | 7554 | 6510 | 4 | 4 | 0.05% | 0.06% | 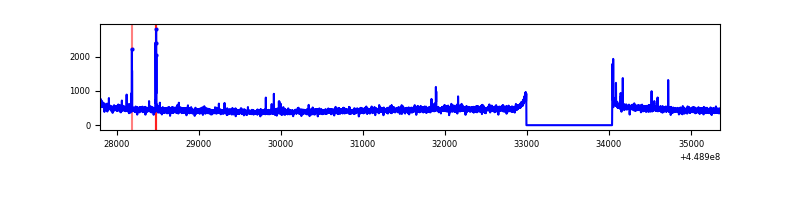 |
| D | 7554 | 6510 | 235 | 235 | 3.11% | 3.61% | 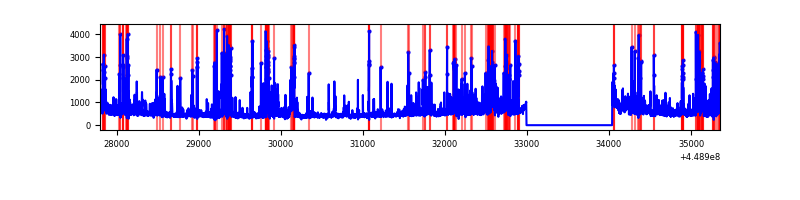 |
Top three noisy pixels from each quadrant. If the there are fewer than three noisy pixels in the level2.evt file, extra rows are filled as -1
| Pixel properties | Quadrant properties | ||||||
|---|---|---|---|---|---|---|---|
| Quadrant | DetID | PixID | Counts | Sigma | Mean | Median | Sigma |
| A | 10 | 83 | 2951112 | 19357.12 | 732 | 717 | 152.4 |
| A | 13 | 254 | 9038 | 54.59 | 732 | 717 | 152.4 |
| A | 3 | 137 | 8331 | 49.95 | 732 | 717 | 152.4 |
| B | 3 | 112 | 4709497 | 38638.63 | 625 | 606 | 121.9 |
| B | 4 | 171 | 1314320 | 10779.63 | 625 | 606 | 121.9 |
| B | 0 | 183 | 29158 | 234.28 | 625 | 606 | 121.9 |
| C | 12 | 2 | 44348 | 251.31 | 735 | 740 | 173.5 |
| C | 3 | 233 | 9588 | 50.99 | 735 | 740 | 173.5 |
| C | 13 | 61 | 4878 | 23.85 | 735 | 740 | 173.5 |
| D | 1 | 52 | 746612 | 4217.04 | 711 | 690 | 176.9 |
| D | 12 | 2 | 462601 | 2611.4 | 711 | 690 | 176.9 |
| D | 12 | 233 | 175359 | 987.48 | 711 | 690 | 176.9 |
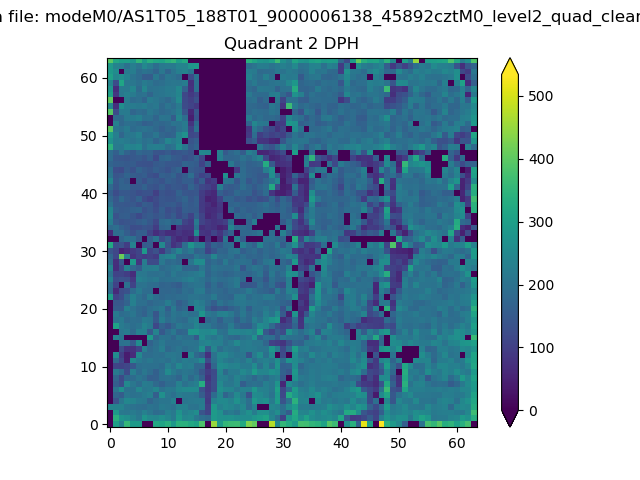
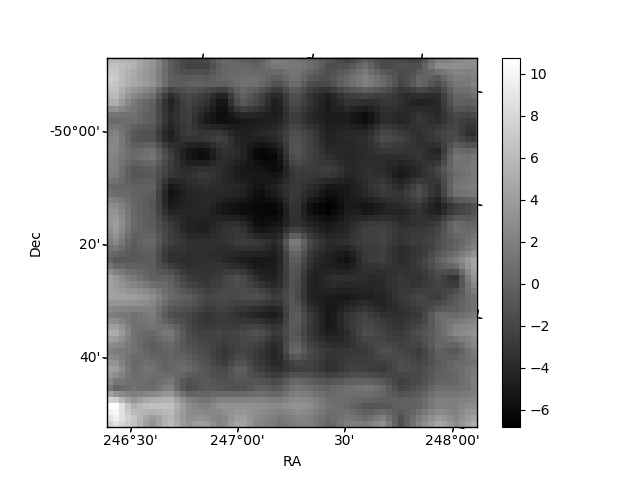
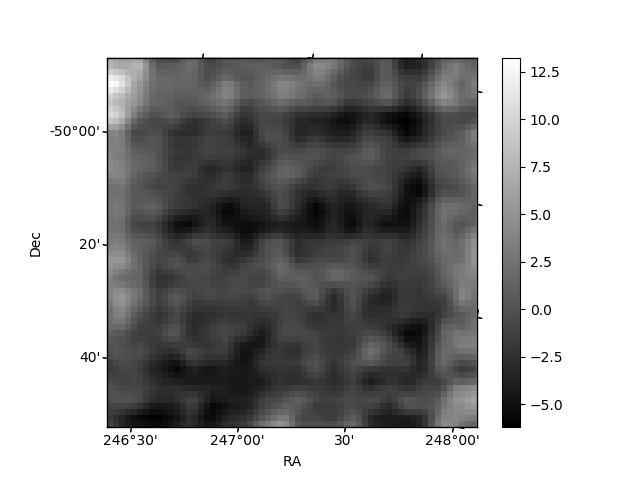
Histogram calculated using DETX and DETY for each event in the final _common_clean file
| Quadrant A |  |
 |
Quadrant B |
|---|---|---|---|
| Quadrant D | 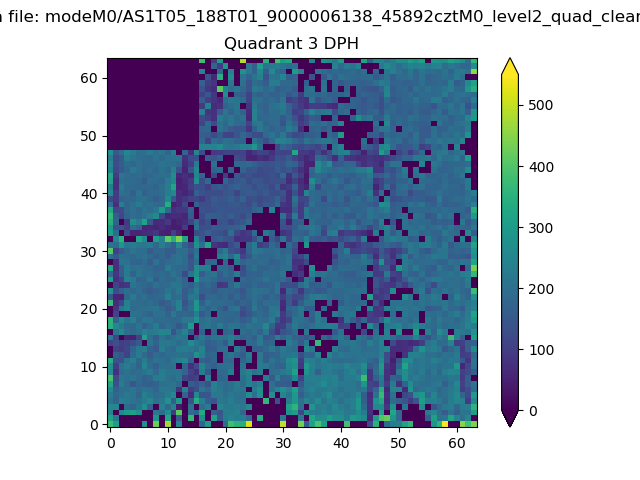 |
 |
Quadrant C |
| Plot type | Count rate plots | Images |
|---|---|---|
| Comparison with Poisson distribution Blue bars denote a histogram of data divided into 1 sec bins. Red curve is a Poisson curve with rate = median count rate of data. |
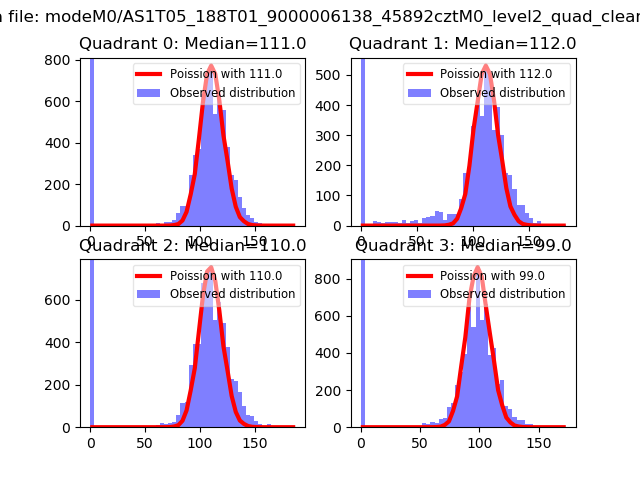 |
 |
| Quadrant-wise count rates Data is divided into 100 sec bins |
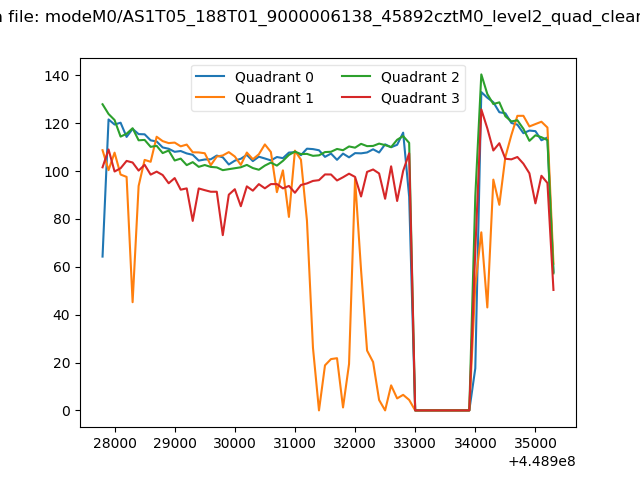 |
|
| Module-wise count rates for Quadrant A Data is divided into 100 sec bins |
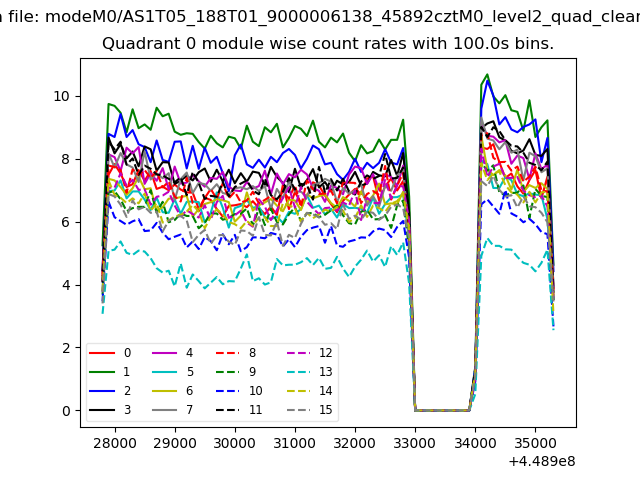 |
 |
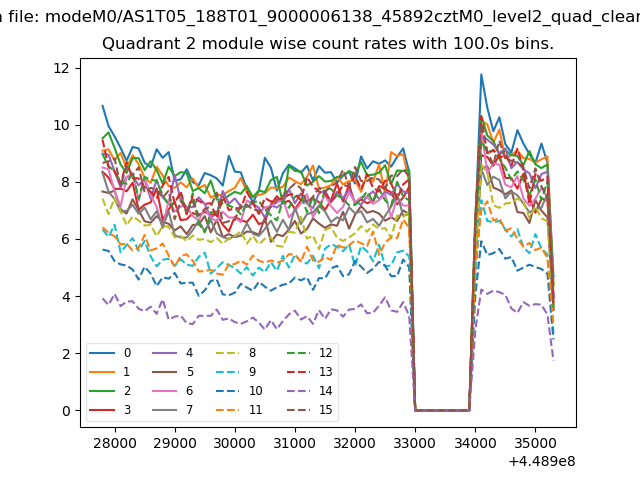
| Module-wise count rates for Quadrant B Data is divided into 100 sec bins |
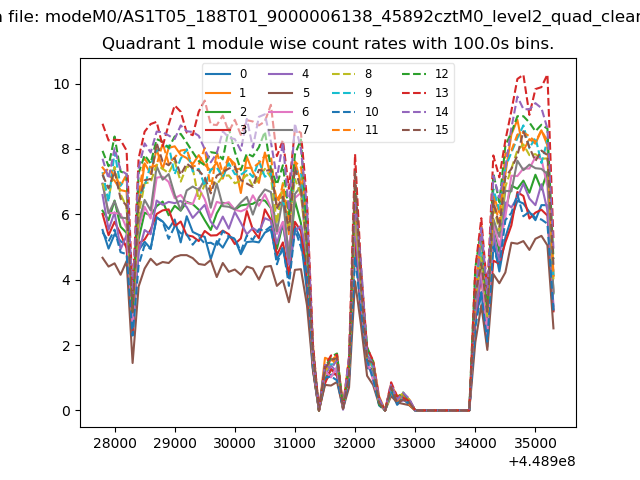 |
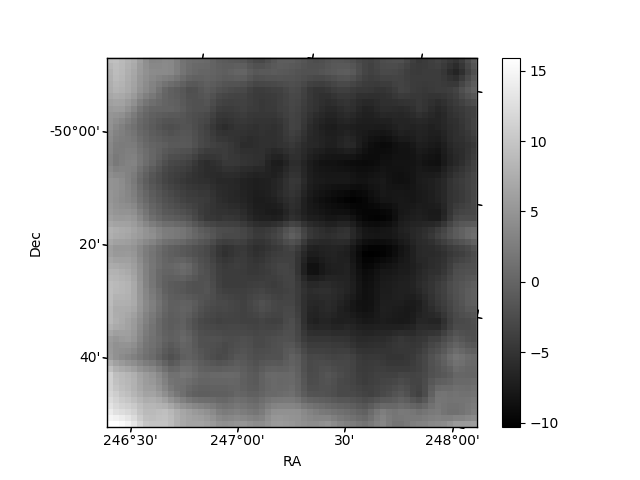 |
| Module-wise count rates for Quadrant C Data is divided into 100 sec bins |
 |
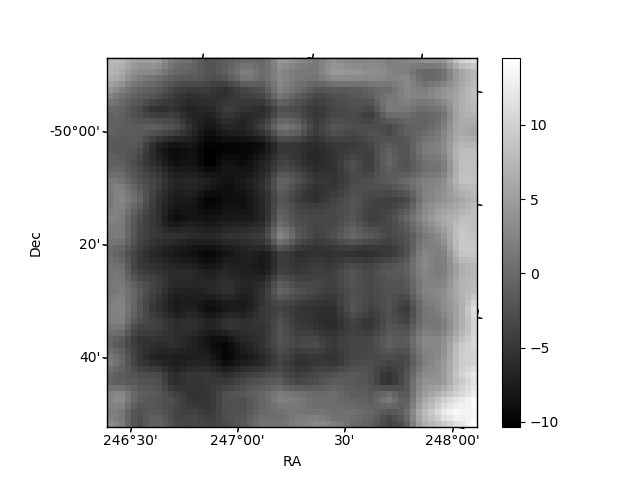 |
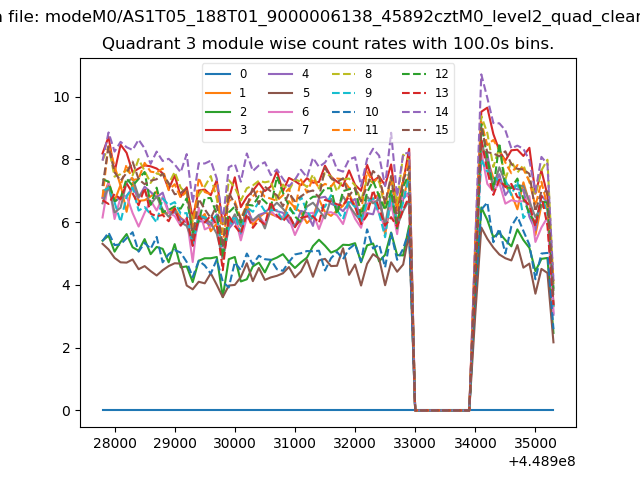
| Module-wise count rates for Quadrant D Data is divided into 100 sec bins |
 |
 |
| Parameter | Plot |
|---|---|
| CZT HV Monitor | 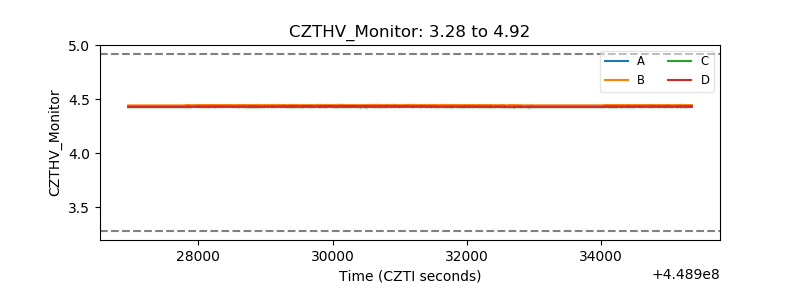 |
| D_VDD | 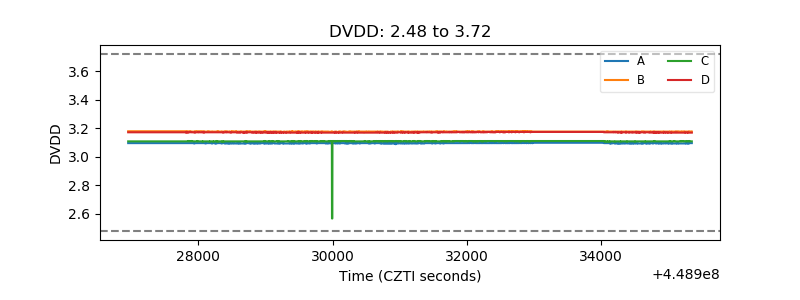 |
| Temperature 1 | 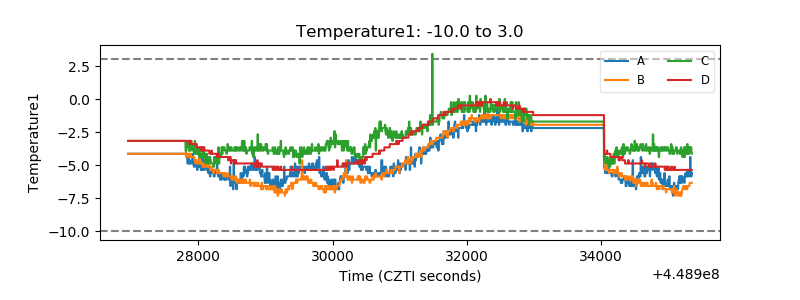 |
| Veto HV Monitor | 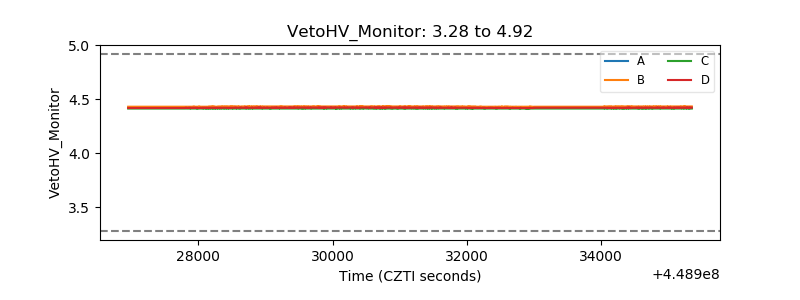 |
| Veto LLD | 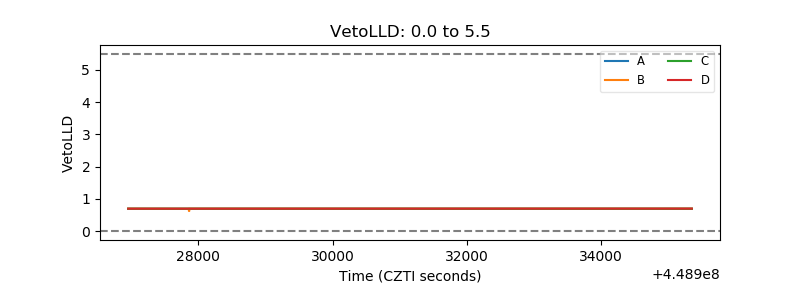 |
| Alpha Counter | 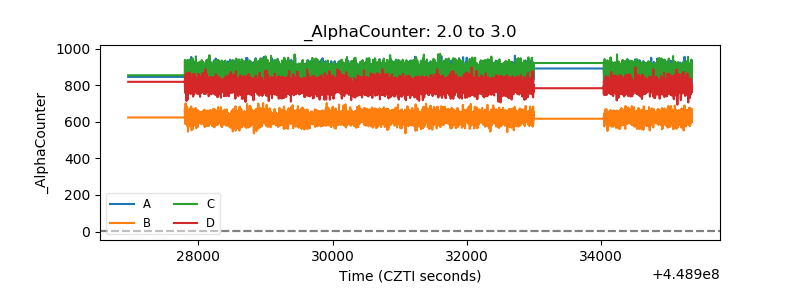 |
| _CPM_Rate |  |
| CZT Counter | 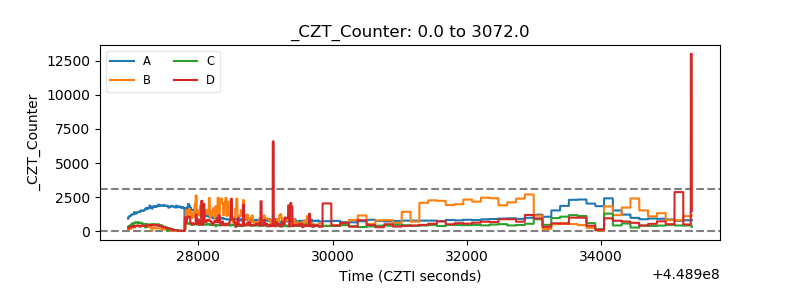 |
| +2.5 Volts monitor | 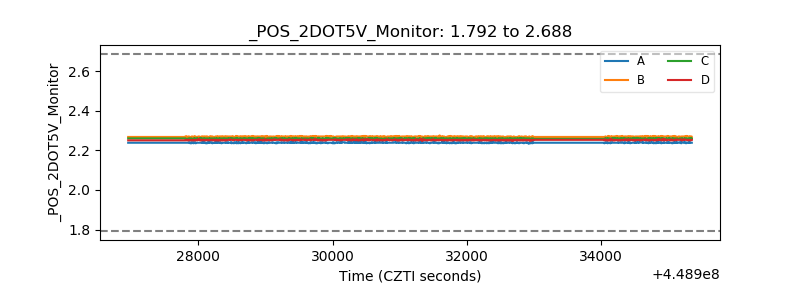 |
| +5 Volts monitor | 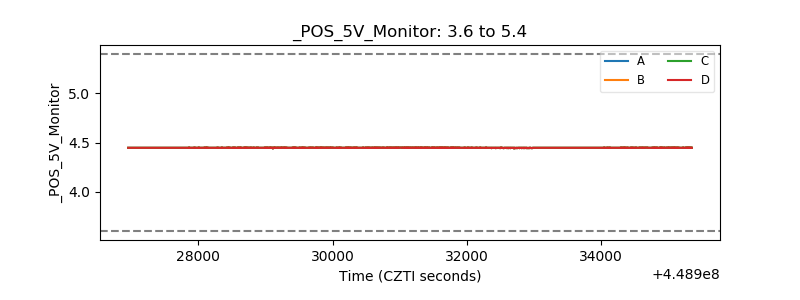 |
| _ROLL_ROT | 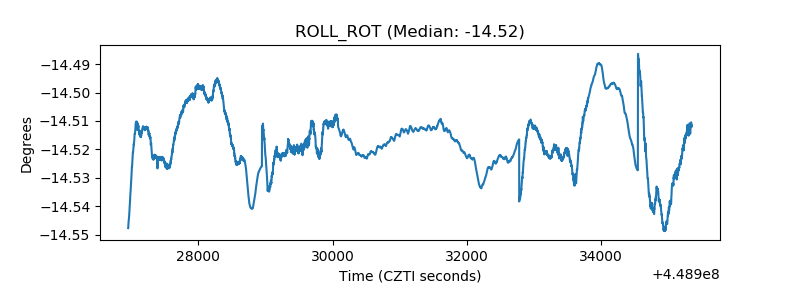 |
| _Roll_DEC | 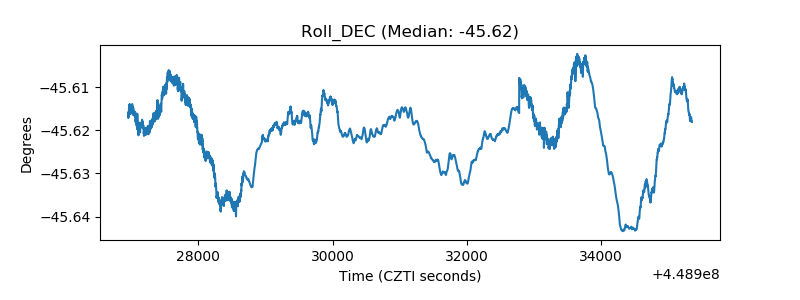 |
| _Roll_RA | 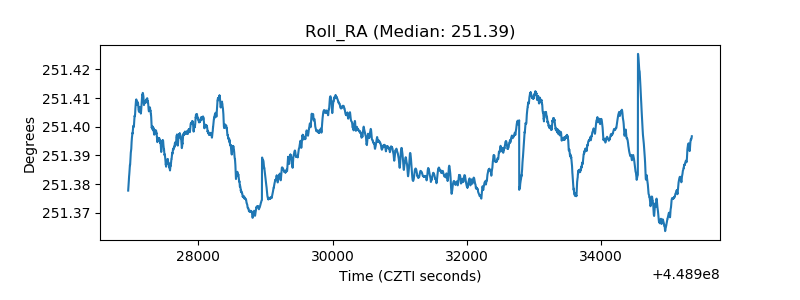 |
| Veto Counter | 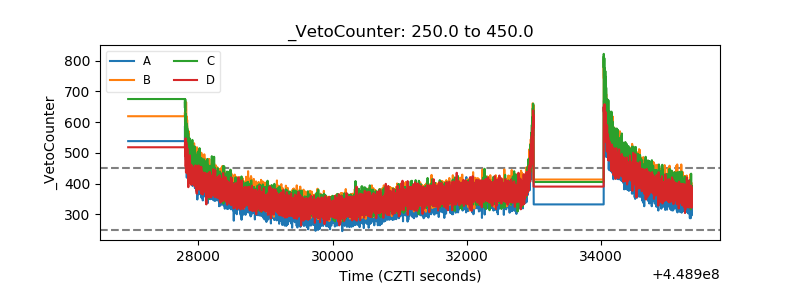 |