| Param | Original file | Final file |
|---|---|---|
| Filename | modeM0/AS1A13_033T02_9000006140_45893cztM0_level2.fits | modeM0/AS1A13_033T02_9000006140_45893cztM0_level2_quad_clean.evt |
| Size (bytes) | 226,998,720 | 43,525,440 |
| Size | 216.5 MB | 41.5 MB |
| Events in quadrant A | 2,420,903 | 292,938 |
| Events in quadrant B | 2,321,998 | 285,619 |
| Events in quadrant C | 1,205,141 | 301,430 |
| Events in quadrant D | 2,256,612 | 256,605 |
| Mode M9 | |||
|---|---|---|---|
| Quadrant | BADHDUFLAG | Total packets | Discarded packets |
| A | 0 | 11 | 0 |
| B | 0 | 11 | 0 |
| C | 0 | 11 | 0 |
| D | 0 | 11 | 0 |
| Mode SS | |||
|---|---|---|---|
| Quadrant | BADHDUFLAG | Total packets | Discarded packets |
| A | 0 | 52 | 0 |
| B | 0 | 52 | 0 |
| C | 0 | 52 | 0 |
| D | 0 | 52 | 0 |
| Mode M0 | |||
|---|---|---|---|
| Quadrant | BADHDUFLAG | Total packets | Discarded packets |
| A | 0 | 8959 | 1 |
| B | 0 | 8621 | 1 |
| C | 0 | 5289 | 1 |
| D | 0 | 8470 | 1 |
| Quadrant | Total seconds | Saturated seconds | Saturation percentage |
|---|---|---|---|
| A | 2529 | 133 | 5.258996% |
| B | 2529 | 341 | 13.483590% |
| C | 2529 | 19 | 0.751285% |
| D | 2529 | 215 | 8.501384% |
Noise dominated data is calculated using 1-second bins in cleaned event files. If a bin has >2000 counts, and if more than 50% of those come from <1% of pixels, then it is considered to be noise-dominated and hence unusable.
| Quadrant | # 1 sec bins | Bins with >0 counts | Bins with >2000 counts | High rate bins dominated by noise | Noise dominated (total time) | Noise dominated (detector-on time) | Marked lightcurve |
|---|---|---|---|---|---|---|---|
| A | 3649 | 2530 | 14 | 14 | 0.38% | 0.55% | 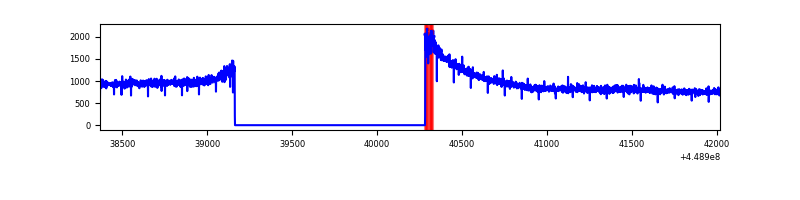 |
| B | 3649 | 2529 | 167 | 167 | 4.58% | 6.60% | 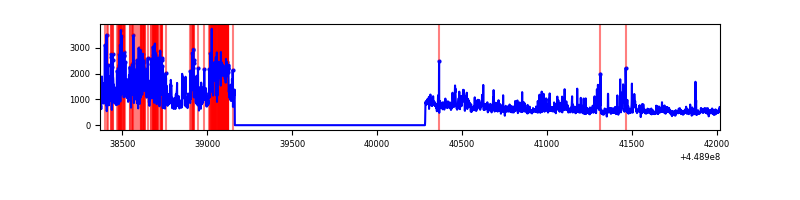 |
| C | 3649 | 2530 | 0 | 0 | 0.00% | 0.00% | 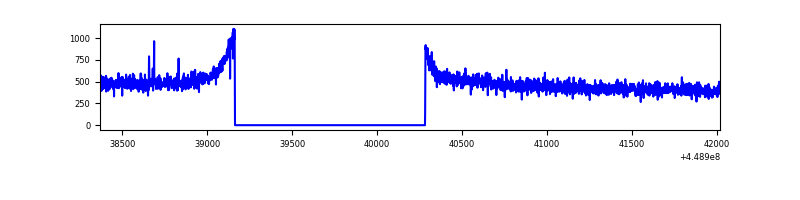 |
| D | 3649 | 2529 | 136 | 136 | 3.73% | 5.38% | 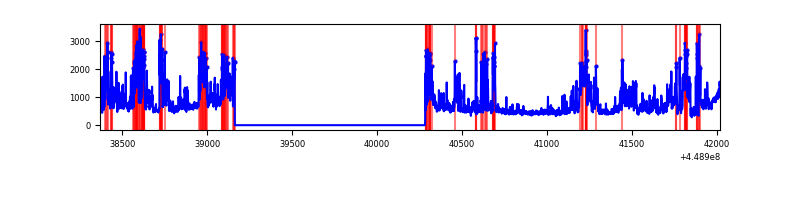 |
Top three noisy pixels from each quadrant. If the there are fewer than three noisy pixels in the level2.evt file, extra rows are filled as -1
| Pixel properties | Quadrant properties | ||||||
|---|---|---|---|---|---|---|---|
| Quadrant | DetID | PixID | Counts | Sigma | Mean | Median | Sigma |
| A | 10 | 83 | 1234897 | 19027.6 | 305 | 298 | 64.9 |
| A | 3 | 137 | 3362 | 47.22 | 305 | 298 | 64.9 |
| A | 13 | 254 | 3357 | 47.15 | 305 | 298 | 64.9 |
| B | 3 | 112 | 905645 | 15355.26 | 296 | 288 | 59.0 |
| B | 5 | 172 | 164358 | 2782.7 | 296 | 288 | 59.0 |
| B | 4 | 171 | 39929 | 672.33 | 296 | 288 | 59.0 |
| C | 3 | 233 | 2519 | 30.06 | 307 | 308 | 73.5 |
| C | 14 | 254 | 2215 | 25.93 | 307 | 308 | 73.5 |
| C | 13 | 61 | 2124 | 24.69 | 307 | 308 | 73.5 |
| D | 12 | 2 | 677268 | 8984.14 | 293 | 283 | 75.4 |
| D | 13 | 249 | 187530 | 2484.92 | 293 | 283 | 75.4 |
| D | 1 | 52 | 105444 | 1395.57 | 293 | 283 | 75.4 |
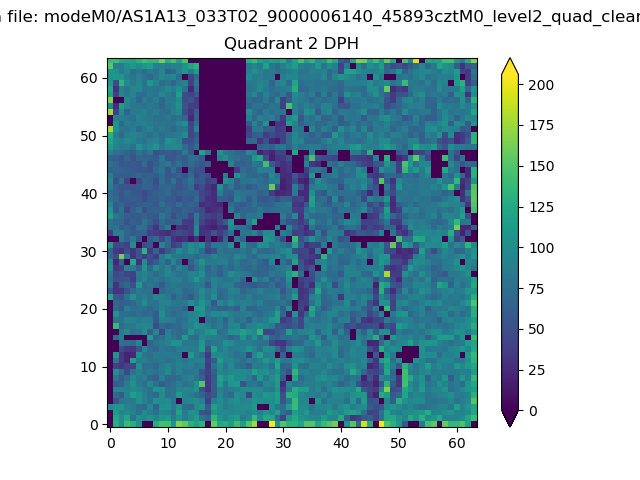
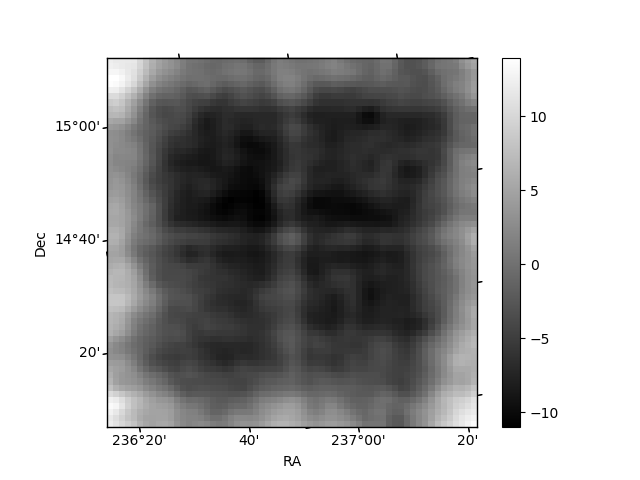
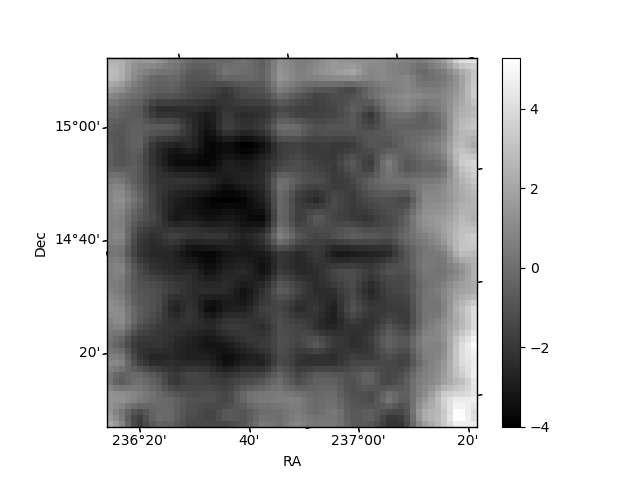
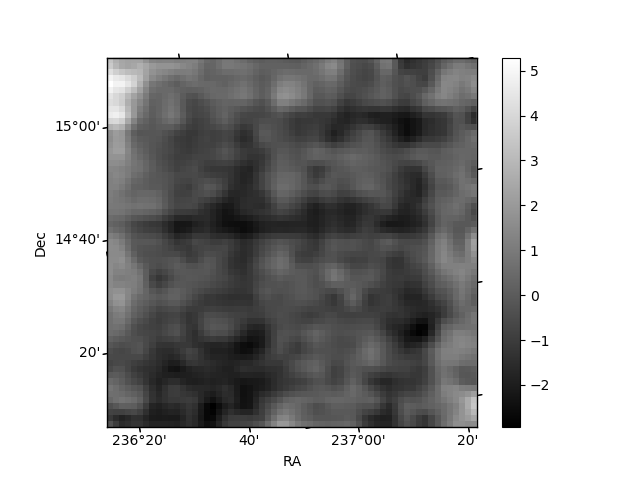
Histogram calculated using DETX and DETY for each event in the final _common_clean file
| Quadrant A | 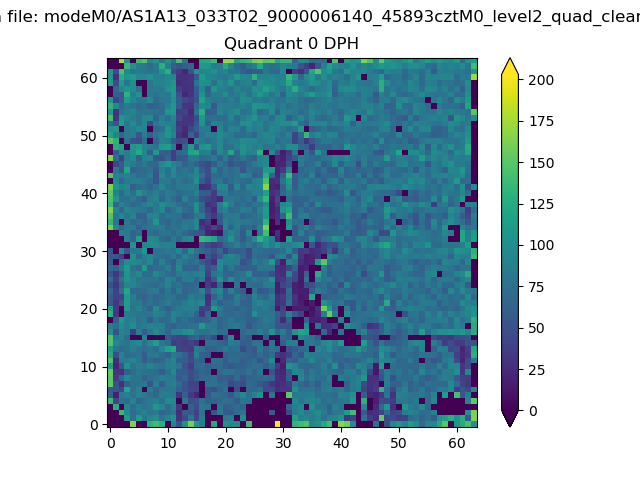 |
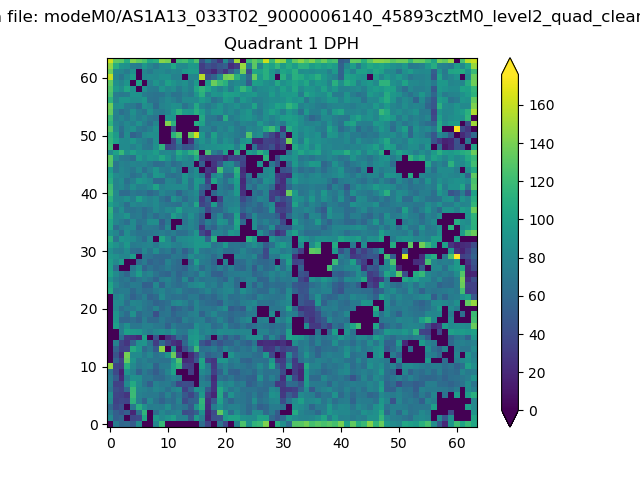 |
Quadrant B |
|---|---|---|---|
| Quadrant D | 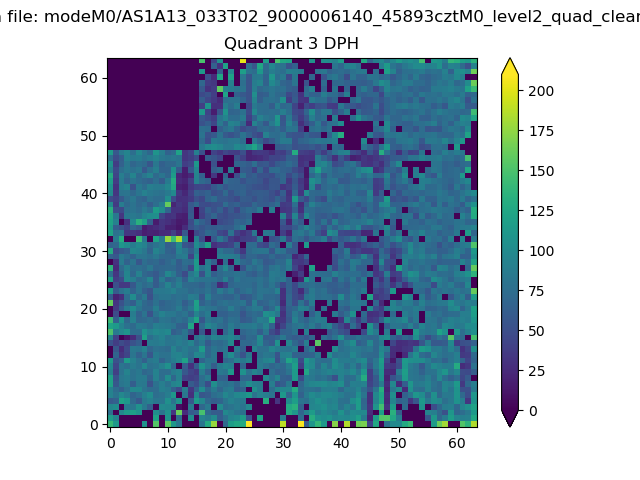 |
 |
Quadrant C |
| Plot type | Count rate plots | Images |
|---|---|---|
| Comparison with Poisson distribution Blue bars denote a histogram of data divided into 1 sec bins. Red curve is a Poisson curve with rate = median count rate of data. |
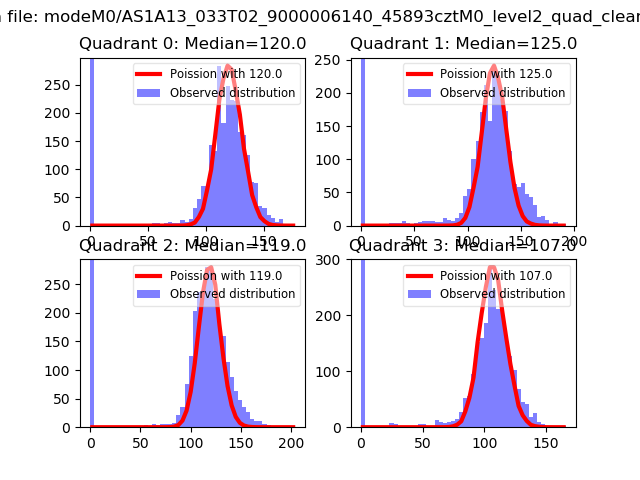 |
 |
| Quadrant-wise count rates Data is divided into 100 sec bins |
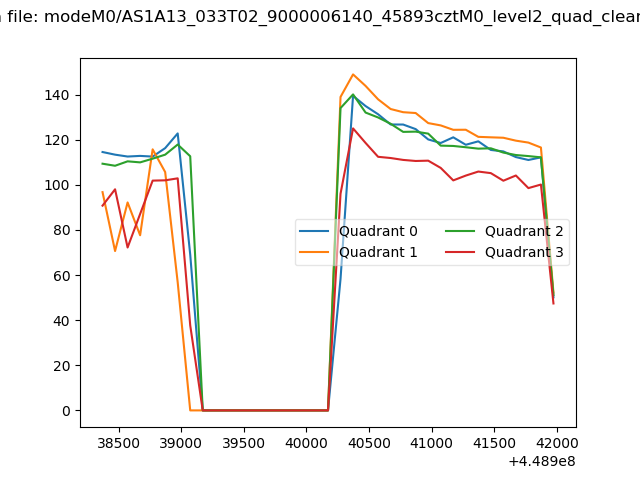 |
|
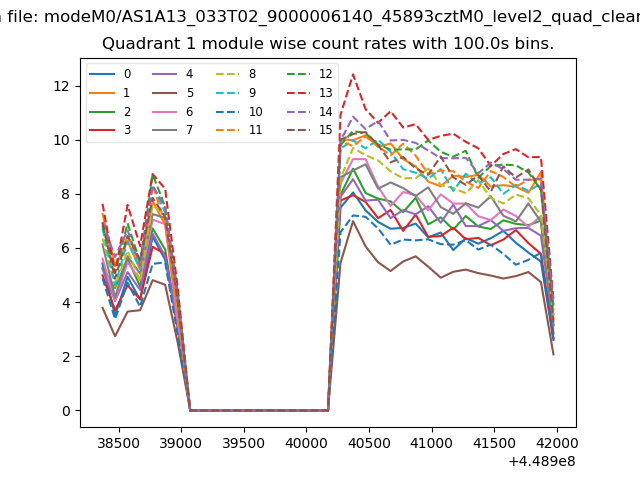
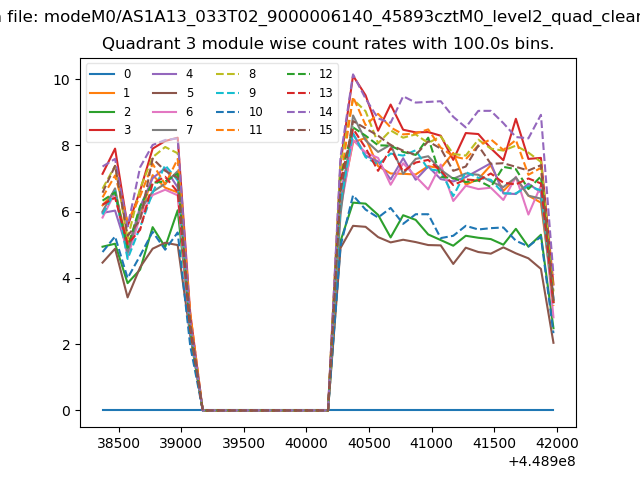
| Module-wise count rates for Quadrant A Data is divided into 100 sec bins |
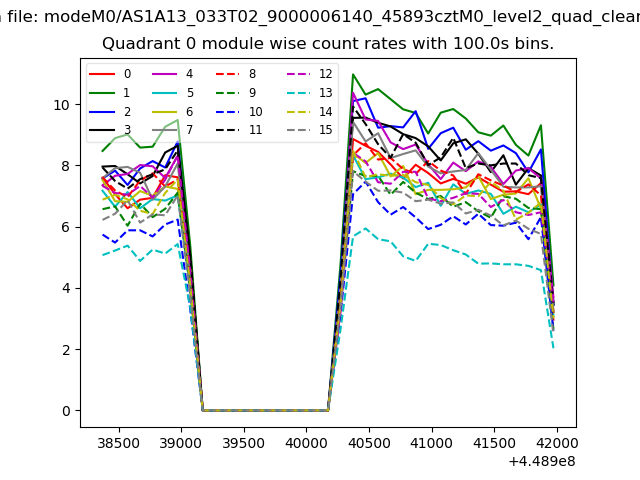 |
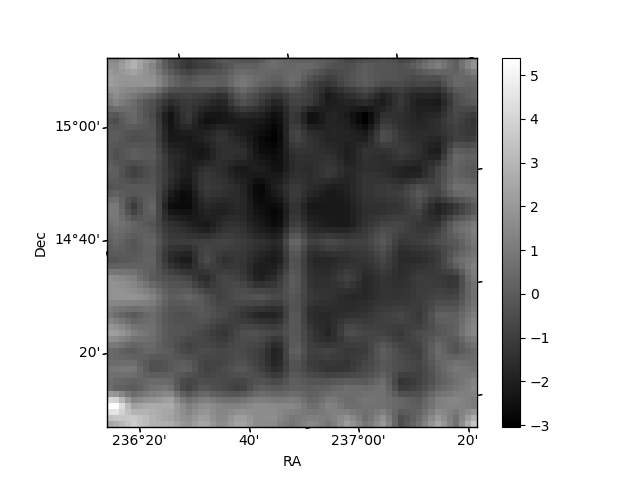 |
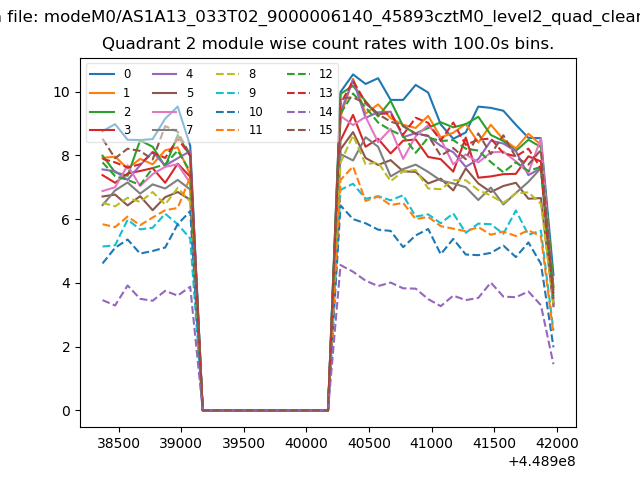
| Module-wise count rates for Quadrant B Data is divided into 100 sec bins |
 |
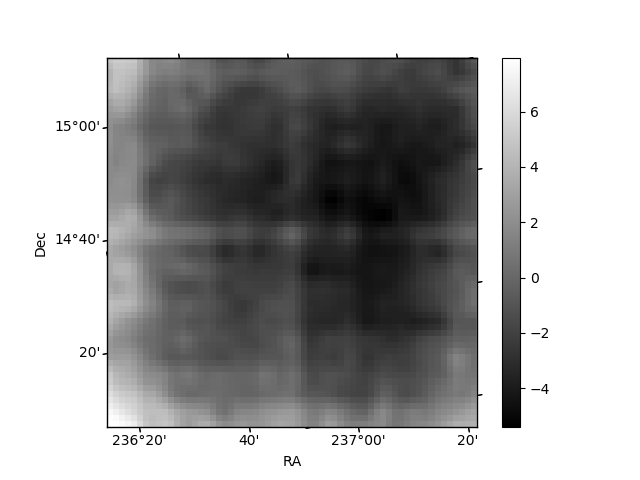 |
| Module-wise count rates for Quadrant C Data is divided into 100 sec bins |
 |
 |
| Module-wise count rates for Quadrant D Data is divided into 100 sec bins |
 |
 |
| Parameter | Plot |
|---|---|
| CZT HV Monitor | 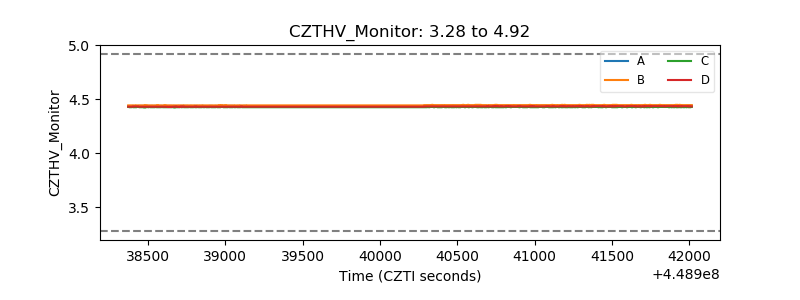 |
| D_VDD | 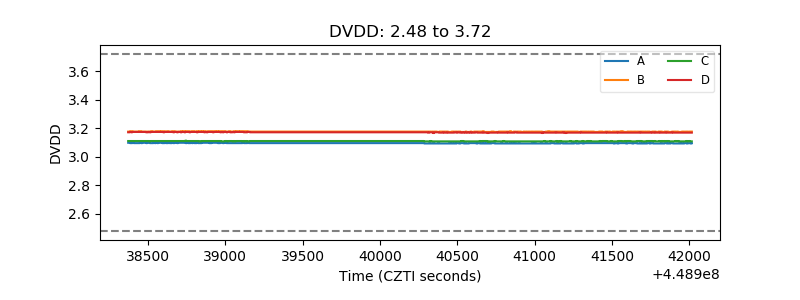 |
| Temperature 1 |  |
| Veto HV Monitor | 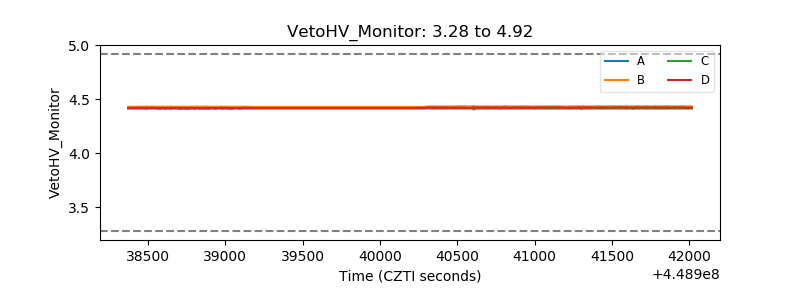 |
| Veto LLD | 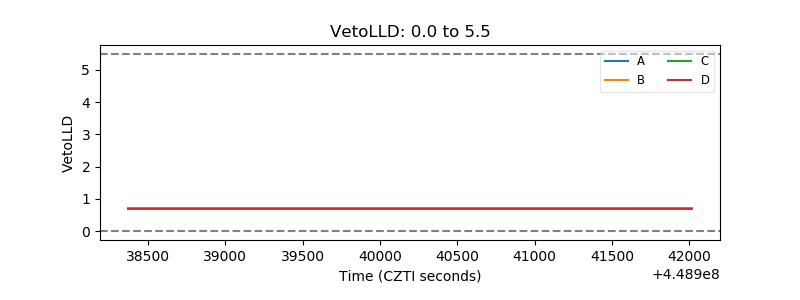 |
| Alpha Counter | 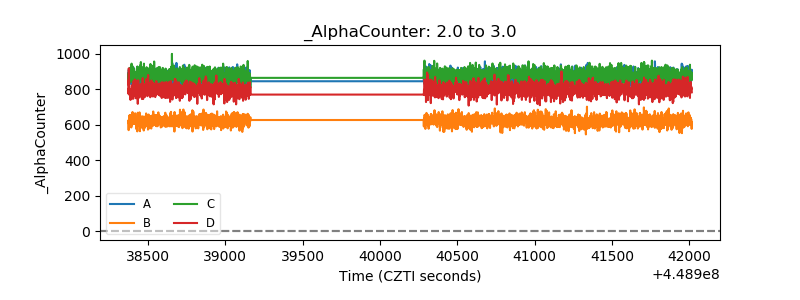 |
| _CPM_Rate | 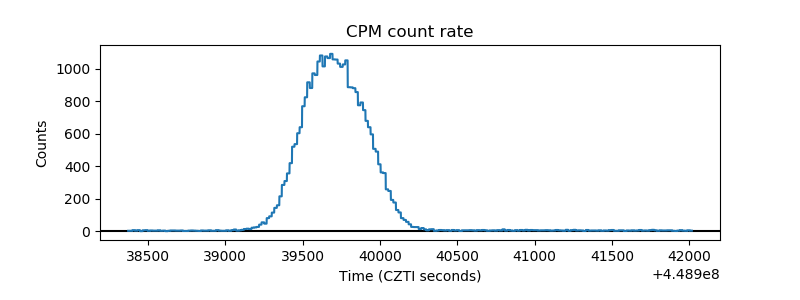 |
| CZT Counter | 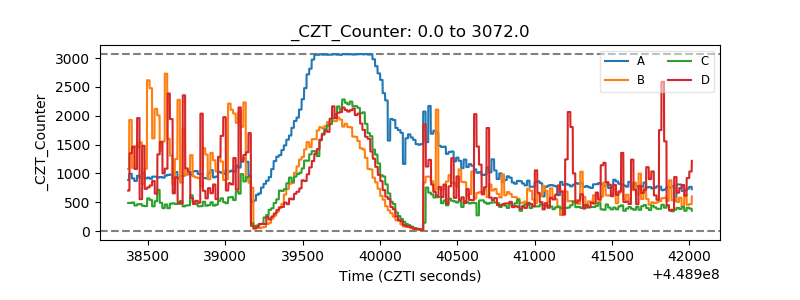 |
| +2.5 Volts monitor | 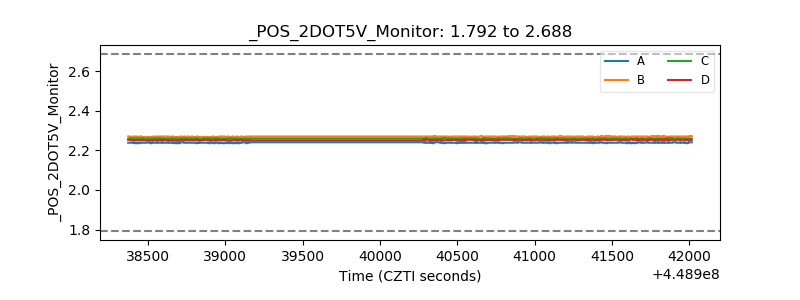 |
| +5 Volts monitor |  |
| _ROLL_ROT | 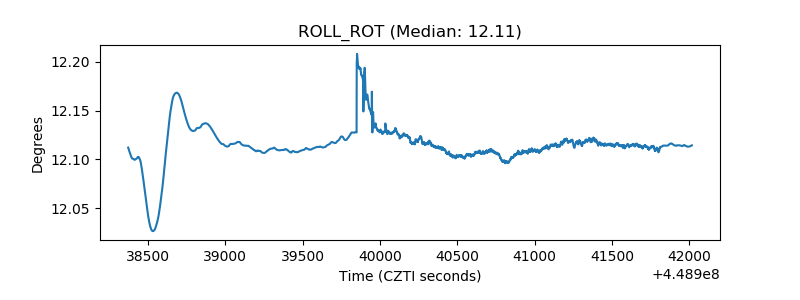 |
| _Roll_DEC | 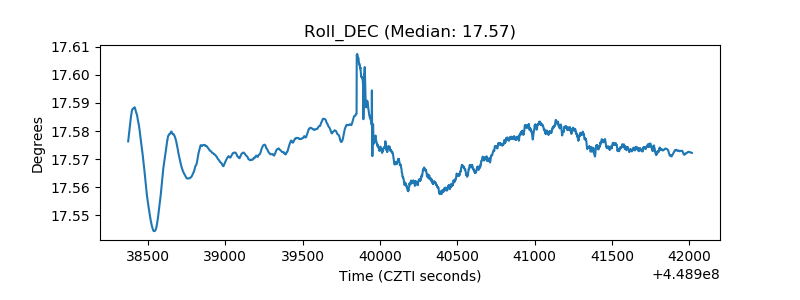 |
| _Roll_RA | 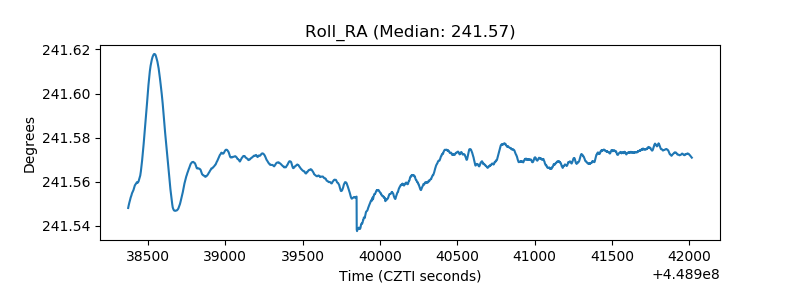 |
| Veto Counter | 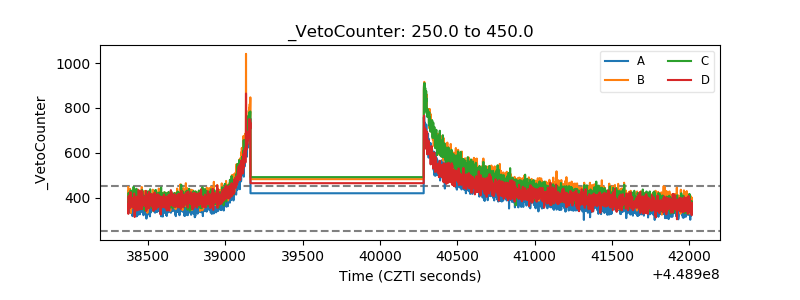 |