| Param | Original file | Final file |
|---|---|---|
| Filename | modeM0/AS1A13_033T02_9000006140_45895cztM0_level2.fits | modeM0/AS1A13_033T02_9000006140_45895cztM0_level2_quad_clean.evt |
| Size (bytes) | 596,695,680 | 104,909,760 |
| Size | 569.1 MB | 100.0 MB |
| Events in quadrant A | 5,862,420 | 742,737 |
| Events in quadrant B | 5,908,121 | 695,984 |
| Events in quadrant C | 3,014,438 | 747,966 |
| Events in quadrant D | 6,794,187 | 532,167 |
| Mode M9 | |||
|---|---|---|---|
| Quadrant | BADHDUFLAG | Total packets | Discarded packets |
| A | 0 | 11 | 0 |
| B | 0 | 11 | 0 |
| C | 0 | 11 | 0 |
| D | 0 | 11 | 0 |
| Mode SS | |||
|---|---|---|---|
| Quadrant | BADHDUFLAG | Total packets | Discarded packets |
| A | 0 | 134 | 0 |
| B | 0 | 134 | 0 |
| C | 0 | 134 | 0 |
| D | 0 | 134 | 0 |
| Mode M0 | |||
|---|---|---|---|
| Quadrant | BADHDUFLAG | Total packets | Discarded packets |
| A | 0 | 21779 | 1 |
| B | 0 | 21844 | 1 |
| C | 0 | 13615 | 1 |
| D | 0 | 24784 | 1 |
| Quadrant | Total seconds | Saturated seconds | Saturation percentage |
|---|---|---|---|
| A | 6560 | 154 | 2.347561% |
| B | 6559 | 960 | 14.636377% |
| C | 6559 | 33 | 0.503125% |
| D | 6560 | 1510 | 23.018293% |
Noise dominated data is calculated using 1-second bins in cleaned event files. If a bin has >2000 counts, and if more than 50% of those come from <1% of pixels, then it is considered to be noise-dominated and hence unusable.
| Quadrant | # 1 sec bins | Bins with >0 counts | Bins with >2000 counts | High rate bins dominated by noise | Noise dominated (total time) | Noise dominated (detector-on time) | Marked lightcurve |
|---|---|---|---|---|---|---|---|
| A | 7685 | 6560 | 4 | 4 | 0.05% | 0.06% | 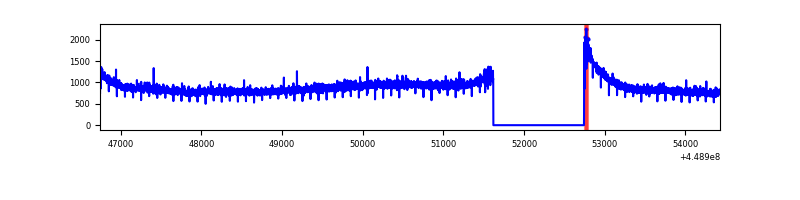 |
| B | 7684 | 6559 | 472 | 472 | 6.14% | 7.20% | 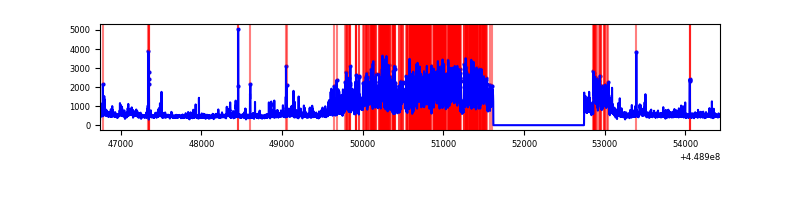 |
| C | 7684 | 6560 | 3 | 3 | 0.04% | 0.05% |  |
| D | 7685 | 6561 | 1305 | 1305 | 16.98% | 19.89% | 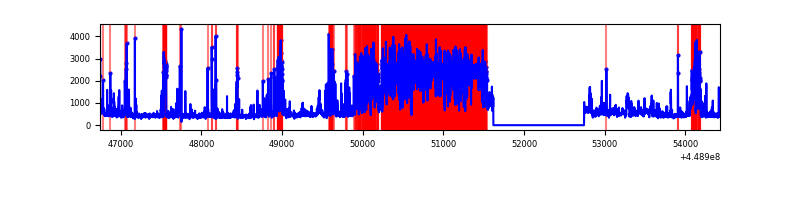 |
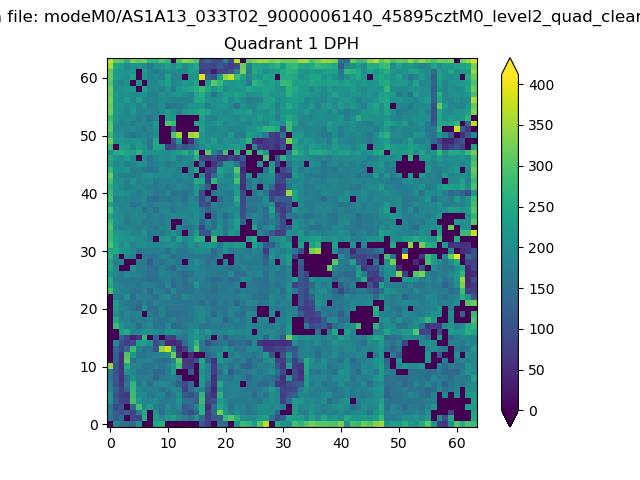
Top three noisy pixels from each quadrant. If the there are fewer than three noisy pixels in the level2.evt file, extra rows are filled as -1
| Pixel properties | Quadrant properties | ||||||
|---|---|---|---|---|---|---|---|
| Quadrant | DetID | PixID | Counts | Sigma | Mean | Median | Sigma |
| A | 10 | 83 | 2887778 | 18110.02 | 765 | 748 | 159.4 |
| A | 13 | 254 | 8957 | 51.49 | 765 | 748 | 159.4 |
| A | 3 | 137 | 8614 | 49.34 | 765 | 748 | 159.4 |
| B | 3 | 112 | 2836445 | 19678.25 | 731 | 710 | 144.1 |
| B | 4 | 171 | 79440 | 546.34 | 731 | 710 | 144.1 |
| B | 5 | 172 | 55872 | 382.79 | 731 | 710 | 144.1 |
| C | 0 | 239 | 33300 | 184.24 | 751 | 756 | 176.6 |
| C | 12 | 2 | 16287 | 87.93 | 751 | 756 | 176.6 |
| C | 12 | 250 | 16087 | 86.79 | 751 | 756 | 176.6 |
| D | 12 | 233 | 2984404 | 17844.51 | 664 | 644 | 167.2 |
| D | 12 | 2 | 534789 | 3194.48 | 664 | 644 | 167.2 |
| D | 13 | 249 | 301491 | 1799.23 | 664 | 644 | 167.2 |
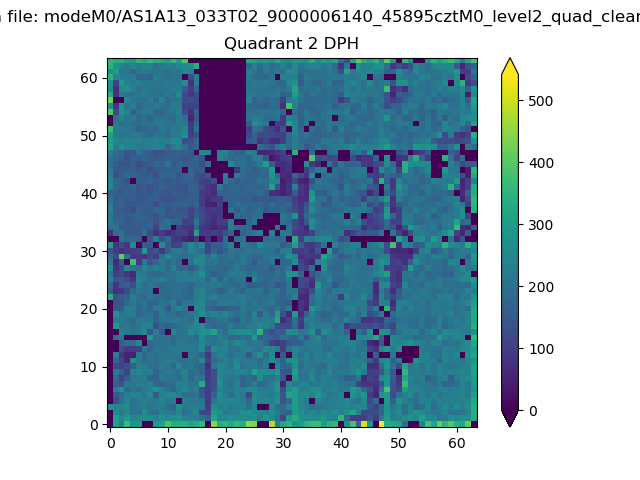
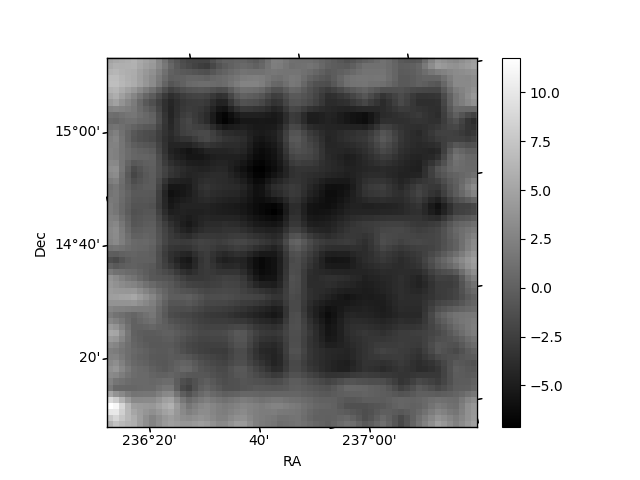
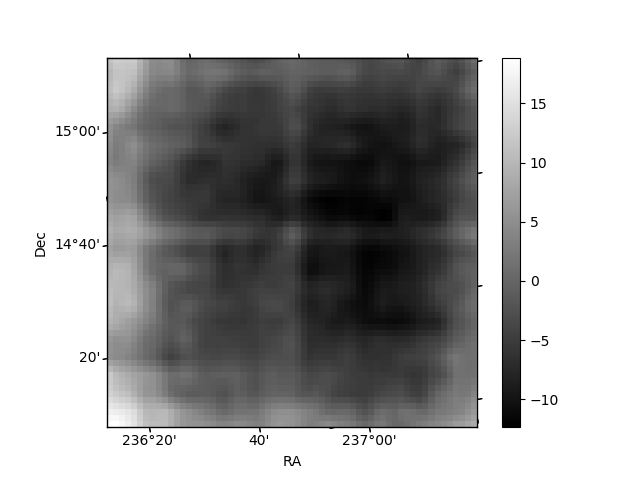
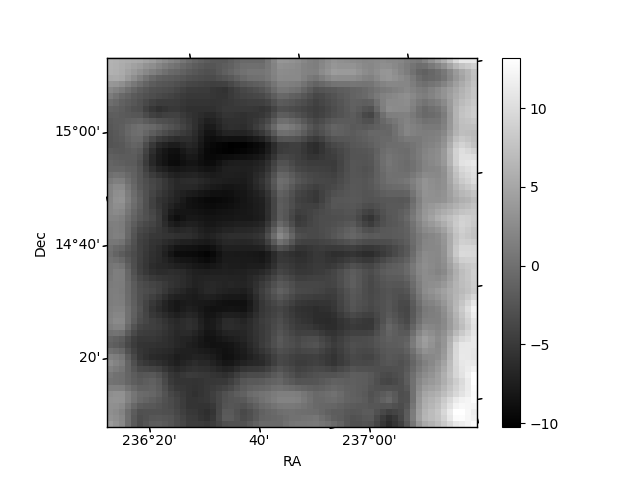
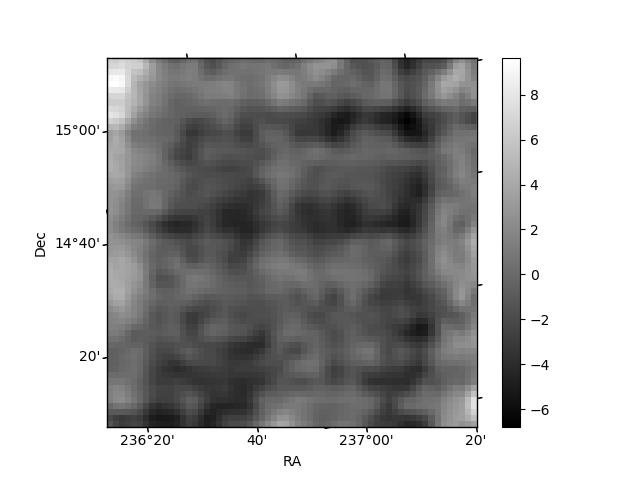
Histogram calculated using DETX and DETY for each event in the final _common_clean file
| Quadrant A |  |
 |
Quadrant B |
|---|---|---|---|
| Quadrant D | 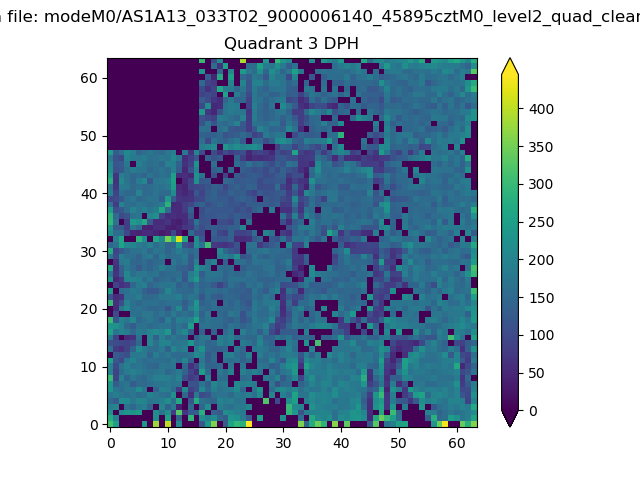 |
 |
Quadrant C |
| Plot type | Count rate plots | Images |
|---|---|---|
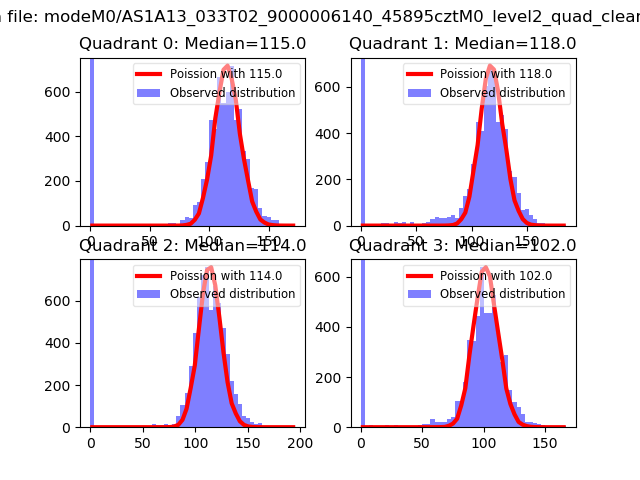
| Comparison with Poisson distribution Blue bars denote a histogram of data divided into 1 sec bins. Red curve is a Poisson curve with rate = median count rate of data. |
 |
 |
| Quadrant-wise count rates Data is divided into 100 sec bins |
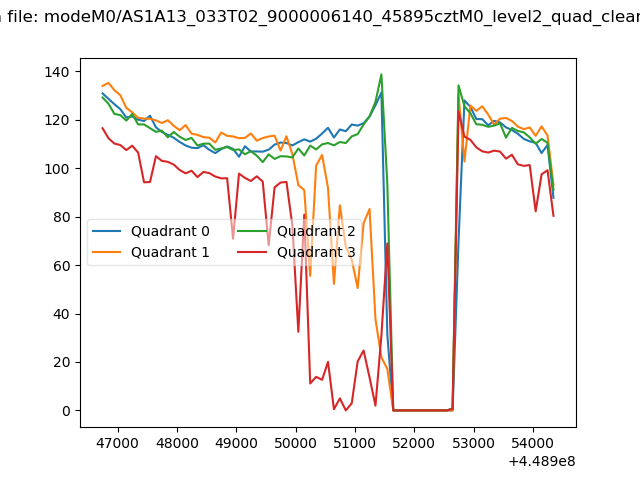 |
|
| Module-wise count rates for Quadrant A Data is divided into 100 sec bins |
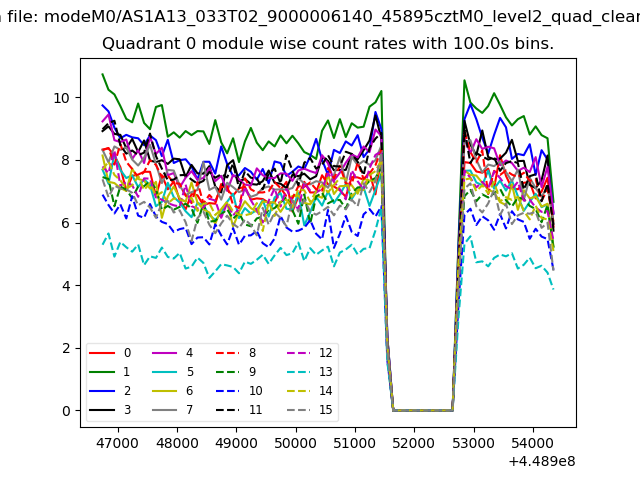 |
 |
| Module-wise count rates for Quadrant B Data is divided into 100 sec bins |
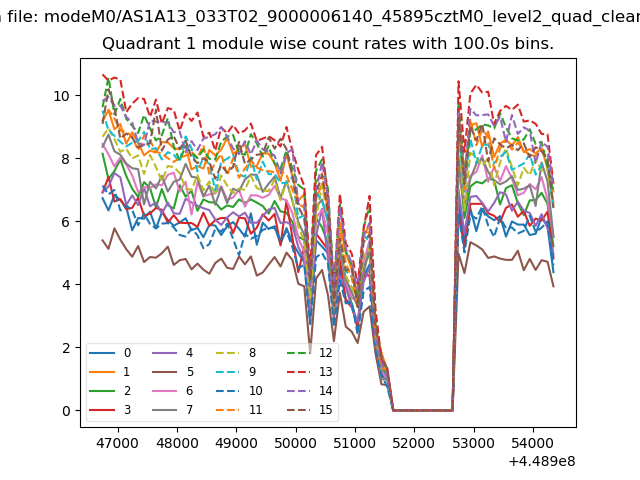 |
 |
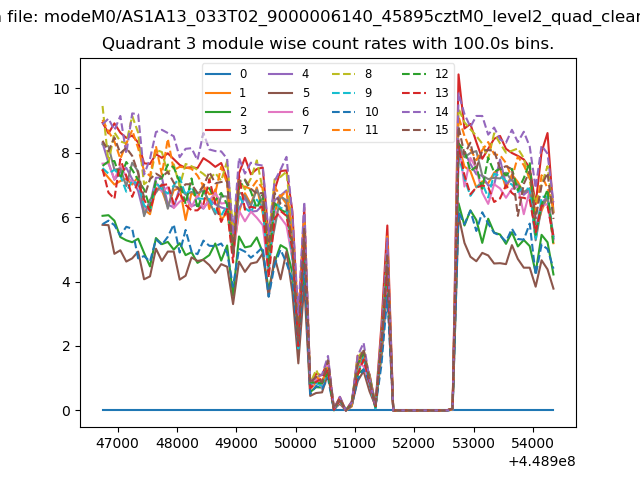
| Module-wise count rates for Quadrant C Data is divided into 100 sec bins |
 |
 |
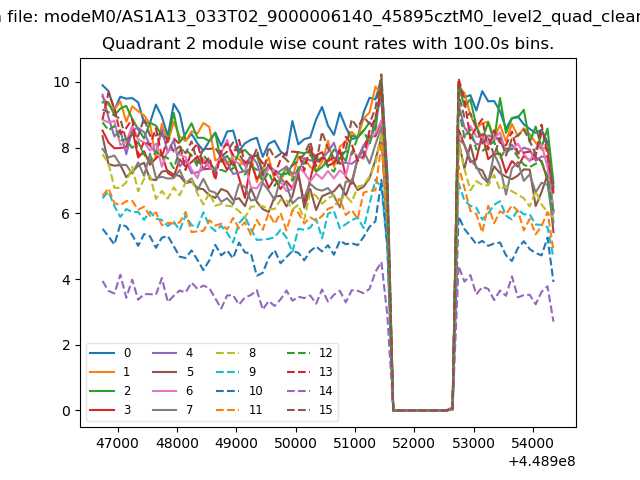
| Module-wise count rates for Quadrant D Data is divided into 100 sec bins |
 |
 |
| Parameter | Plot |
|---|---|
| CZT HV Monitor | 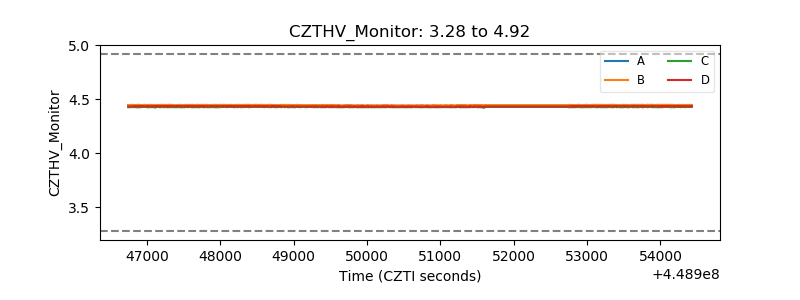 |
| D_VDD | 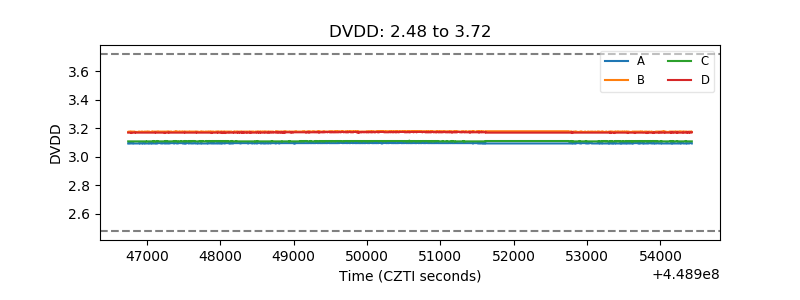 |
| Temperature 1 | 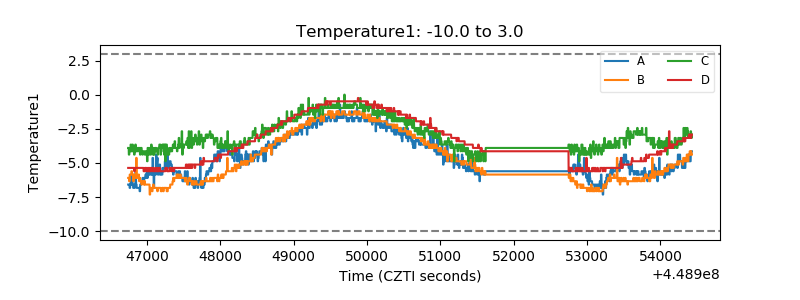 |
| Veto HV Monitor | 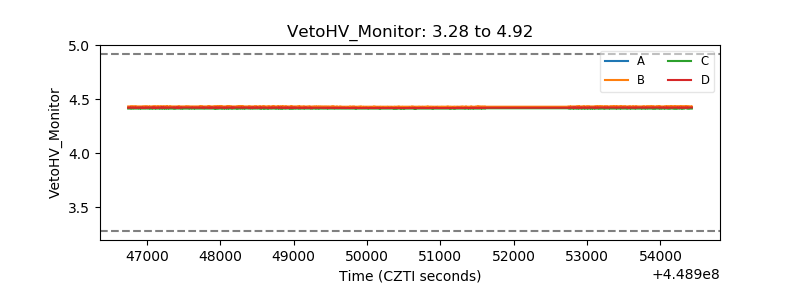 |
| Veto LLD | 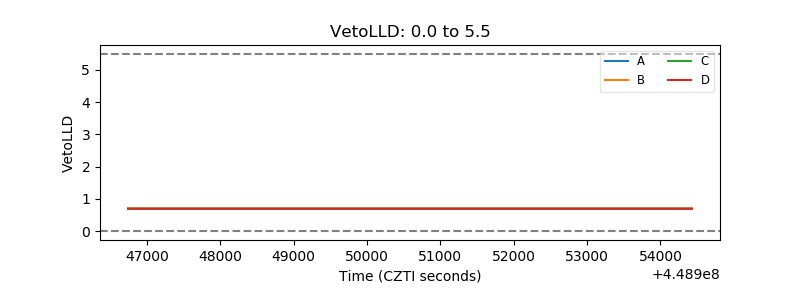 |
| Alpha Counter | 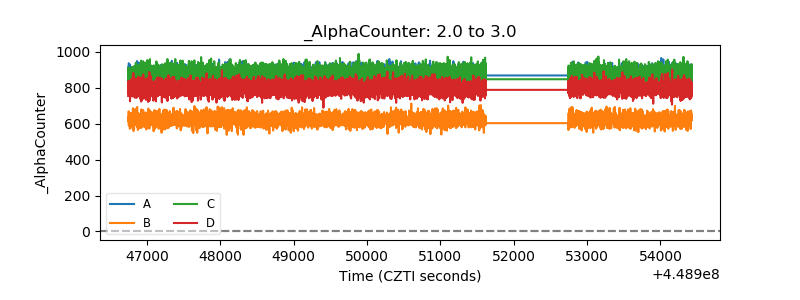 |
| _CPM_Rate | 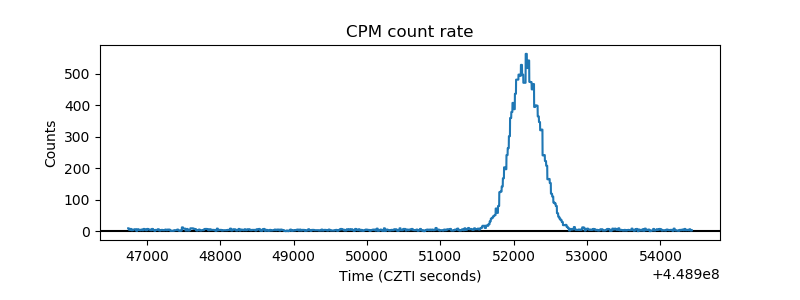 |
| CZT Counter | 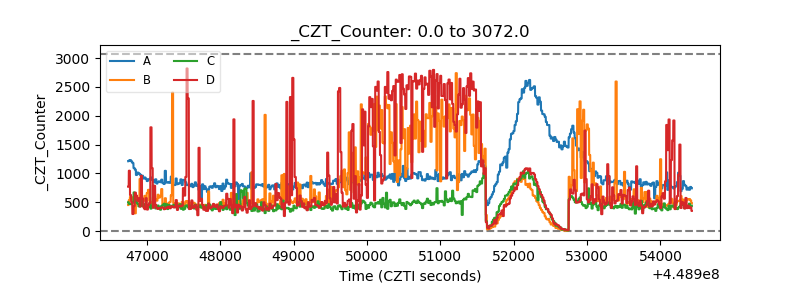 |
| +2.5 Volts monitor | 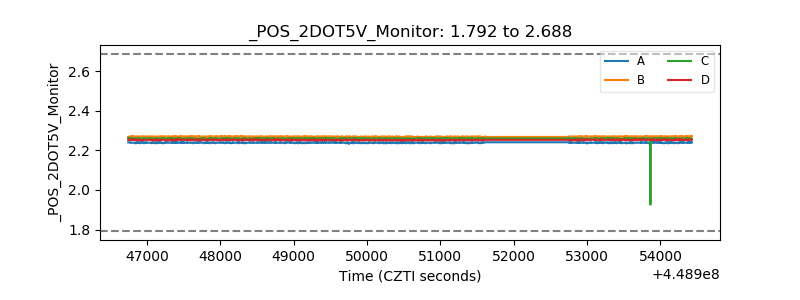 |
| +5 Volts monitor | 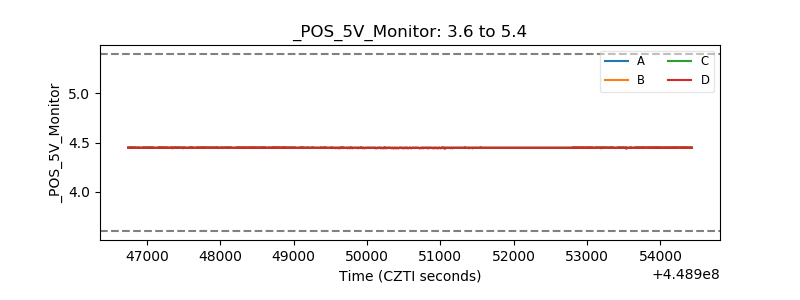 |
| _ROLL_ROT | 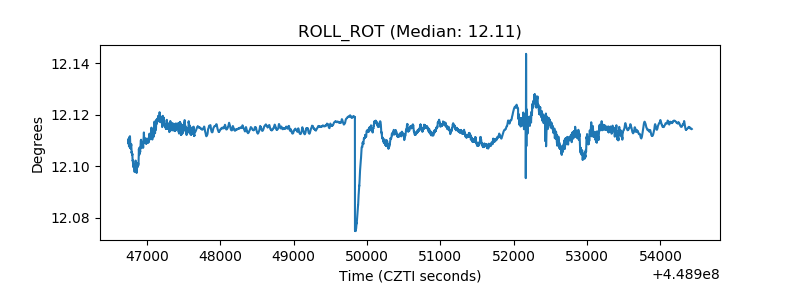 |
| _Roll_DEC | 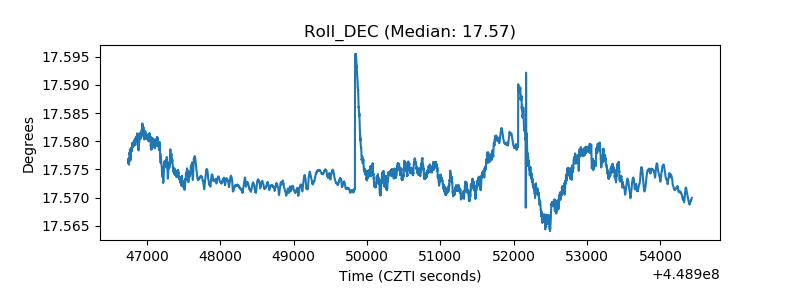 |
| _Roll_RA | 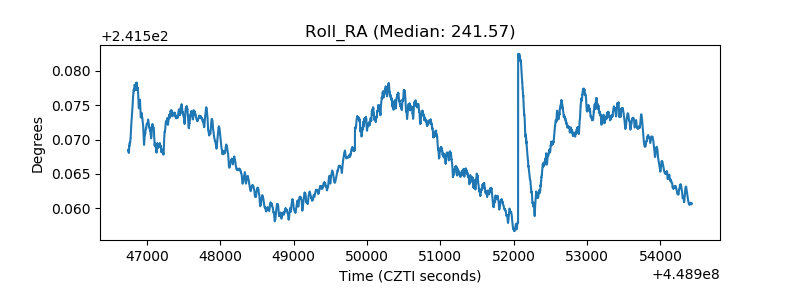 |
| Veto Counter | 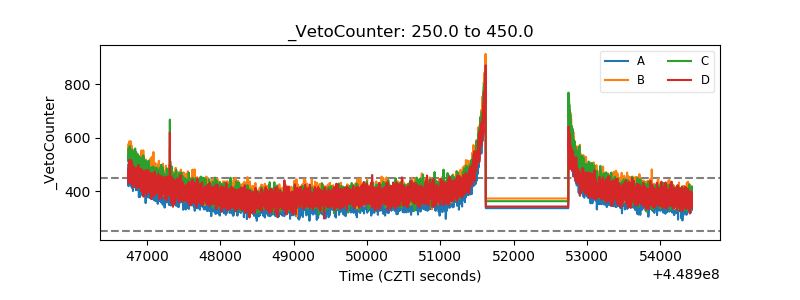 |