| Param | Original file | Final file |
|---|---|---|
| Filename | modeM0/AS1A13_033T02_9000006140_45898cztM0_level2.fits | modeM0/AS1A13_033T02_9000006140_45898cztM0_level2_quad_clean.evt |
| Size (bytes) | 641,822,400 | 118,382,400 |
| Size | 612.1 MB | 112.9 MB |
| Events in quadrant A | 6,580,021 | 789,352 |
| Events in quadrant B | 7,992,647 | 737,779 |
| Events in quadrant C | 3,565,755 | 806,846 |
| Events in quadrant D | 5,023,830 | 714,764 |
| Mode SS | |||
|---|---|---|---|
| Quadrant | BADHDUFLAG | Total packets | Discarded packets |
| A | 0 | 156 | 0 |
| B | 0 | 156 | 0 |
| C | 0 | 156 | 0 |
| D | 0 | 156 | 0 |
| Mode M0 | |||
|---|---|---|---|
| Quadrant | BADHDUFLAG | Total packets | Discarded packets |
| A | 0 | 24059 | 1 |
| B | 0 | 29192 | 1 |
| C | 0 | 16180 | 1 |
| D | 0 | 20154 | 1 |
| Quadrant | Total seconds | Saturated seconds | Saturation percentage |
|---|---|---|---|
| A | 7690 | 393 | 5.110533% |
| B | 7691 | 1337 | 17.383955% |
| C | 7691 | 197 | 2.561435% |
| D | 7691 | 458 | 5.955012% |
Noise dominated data is calculated using 1-second bins in cleaned event files. If a bin has >2000 counts, and if more than 50% of those come from <1% of pixels, then it is considered to be noise-dominated and hence unusable.
| Quadrant | # 1 sec bins | Bins with >0 counts | Bins with >2000 counts | High rate bins dominated by noise | Noise dominated (total time) | Noise dominated (detector-on time) | Marked lightcurve |
|---|---|---|---|---|---|---|---|
| A | 7740 | 7691 | 0 | 0 | 0.00% | 0.00% | 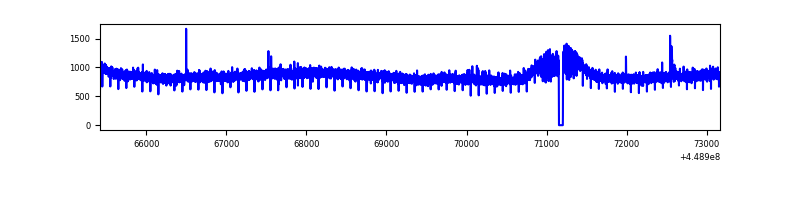 |
| B | 7741 | 7692 | 677 | 677 | 8.75% | 8.80% | 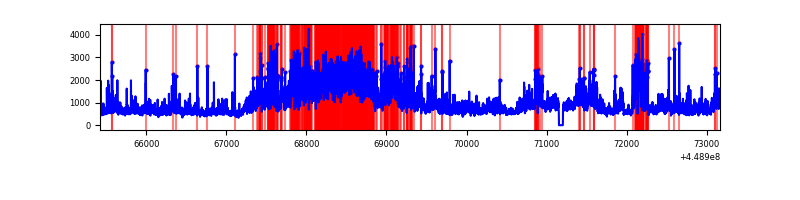 |
| C | 7741 | 7692 | 2 | 2 | 0.03% | 0.03% | 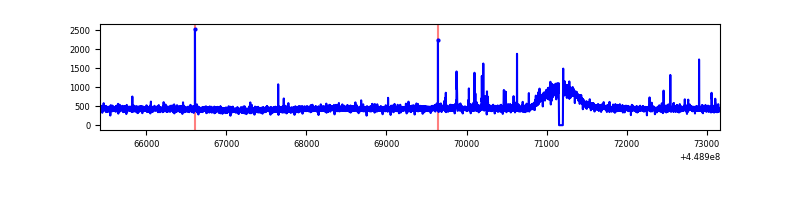 |
| D | 7741 | 7692 | 196 | 196 | 2.53% | 2.55% | 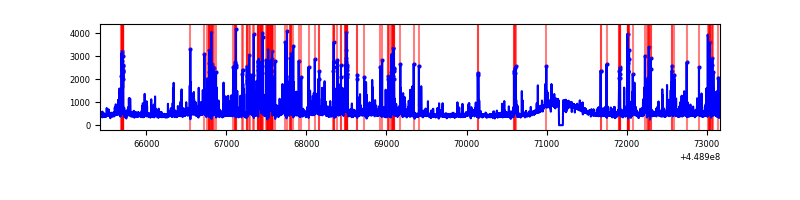 |
Top three noisy pixels from each quadrant. If the there are fewer than three noisy pixels in the level2.evt file, extra rows are filled as -1
| Pixel properties | Quadrant properties | ||||||
|---|---|---|---|---|---|---|---|
| Quadrant | DetID | PixID | Counts | Sigma | Mean | Median | Sigma |
| A | 10 | 83 | 3055022 | 16119.45 | 902 | 882 | 189.5 |
| A | 14 | 235 | 14326 | 70.96 | 902 | 882 | 189.5 |
| A | 13 | 6 | 13629 | 67.28 | 902 | 882 | 189.5 |
| B | 3 | 112 | 4375373 | 25033.75 | 864 | 836 | 174.7 |
| B | 0 | 245 | 61904 | 349.47 | 864 | 836 | 174.7 |
| B | 0 | 183 | 58308 | 328.89 | 864 | 836 | 174.7 |
| C | 12 | 249 | 54628 | 252.33 | 895 | 897 | 212.9 |
| C | 12 | 2 | 10308 | 44.2 | 895 | 897 | 212.9 |
| C | 2 | 14 | 6136 | 24.6 | 895 | 897 | 212.9 |
| D | 1 | 52 | 659767 | 2905.93 | 890 | 861 | 226.7 |
| D | 2 | 249 | 326630 | 1436.72 | 890 | 861 | 226.7 |
| D | 12 | 2 | 221972 | 975.15 | 890 | 861 | 226.7 |
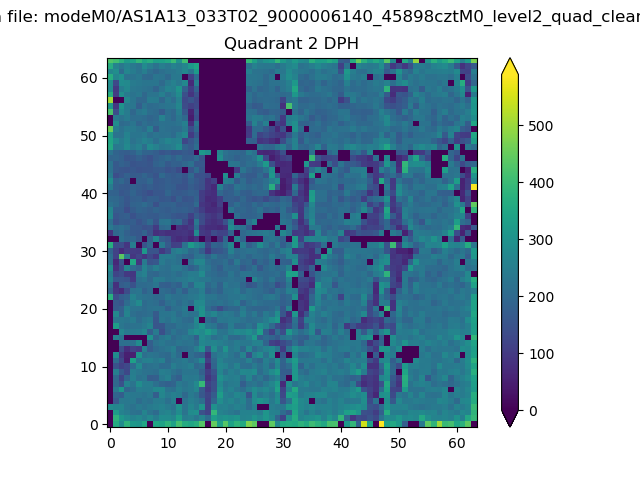
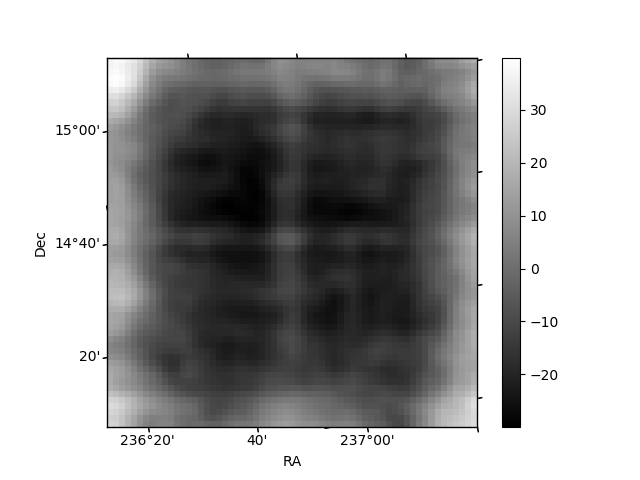
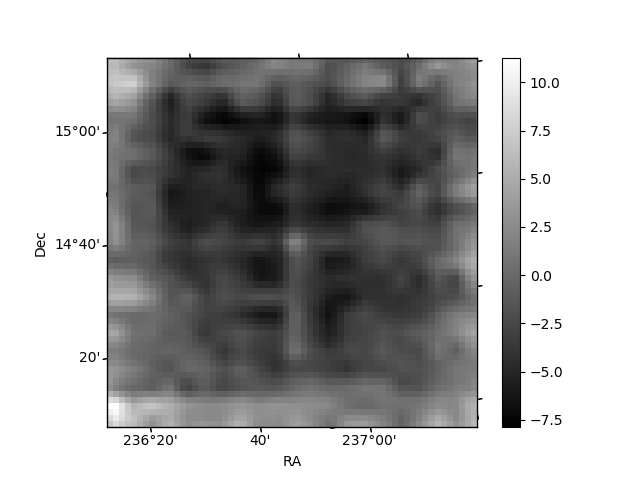
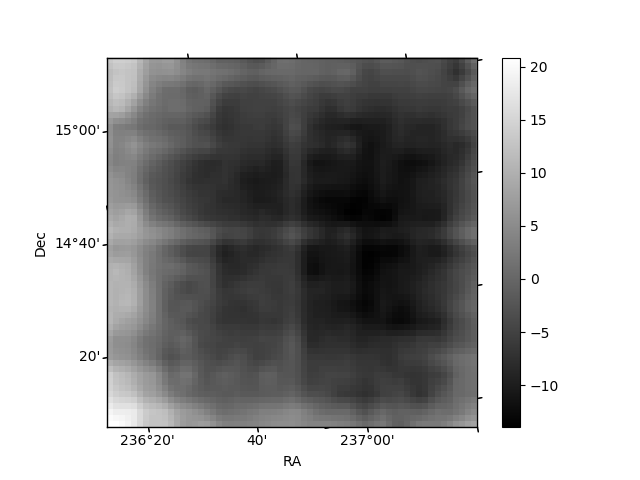
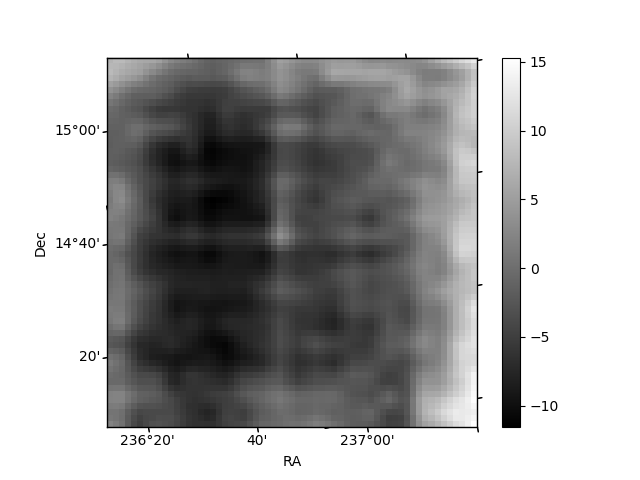
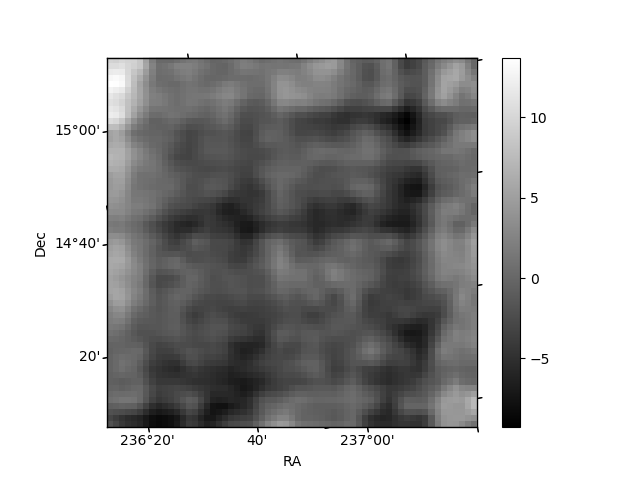
Histogram calculated using DETX and DETY for each event in the final _common_clean file
| Quadrant A | 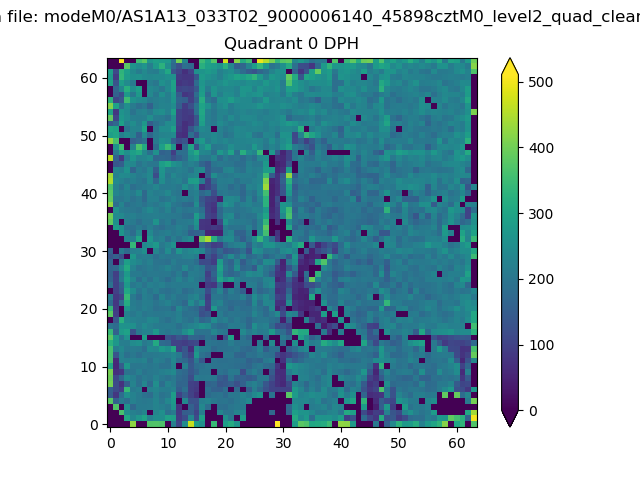 |
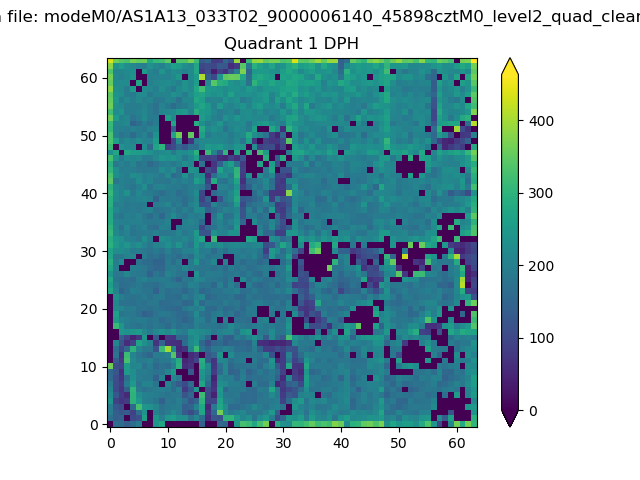 |
Quadrant B |
|---|---|---|---|
| Quadrant D | 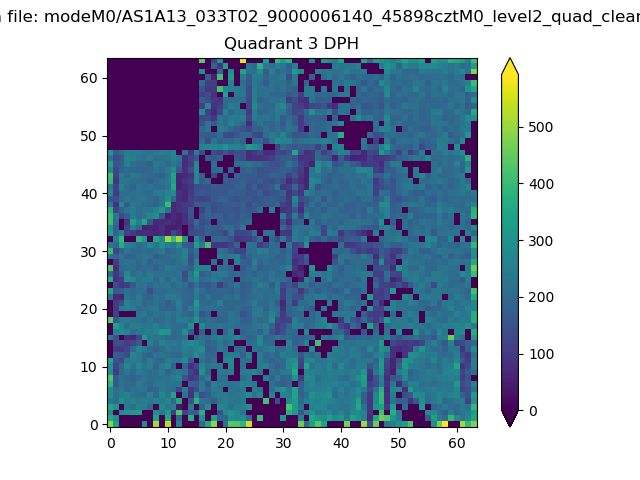 |
 |
Quadrant C |
| Plot type | Count rate plots | Images |
|---|---|---|
| Comparison with Poisson distribution Blue bars denote a histogram of data divided into 1 sec bins. Red curve is a Poisson curve with rate = median count rate of data. |
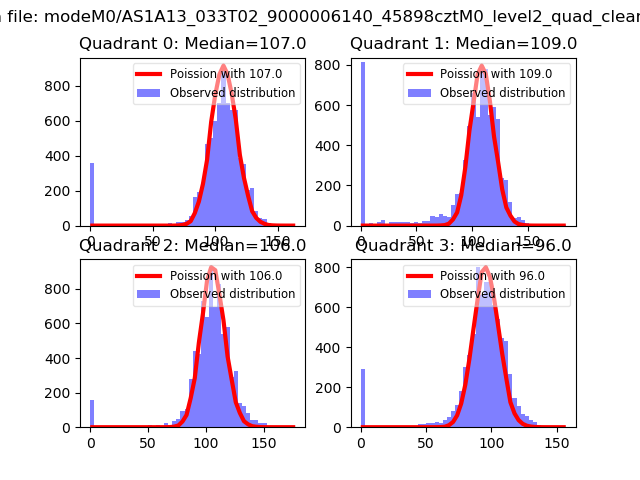 |
 |
| Quadrant-wise count rates Data is divided into 100 sec bins |
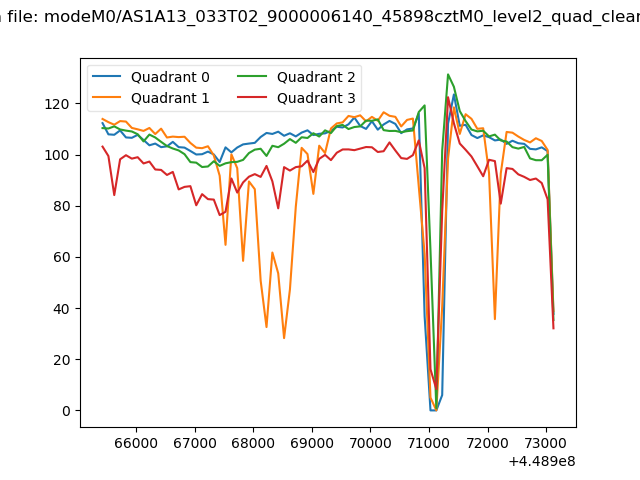 |
|
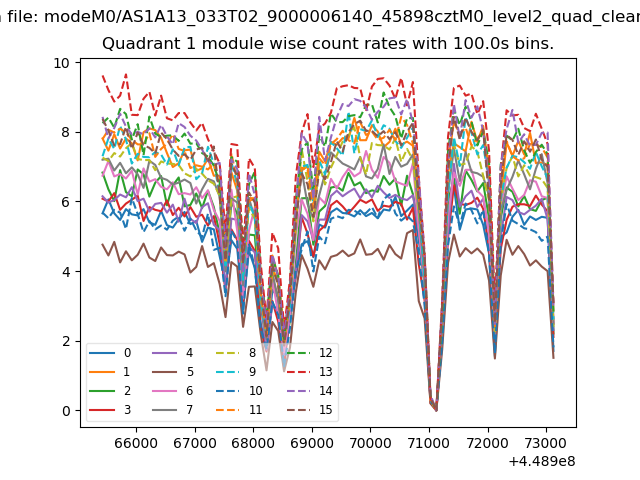
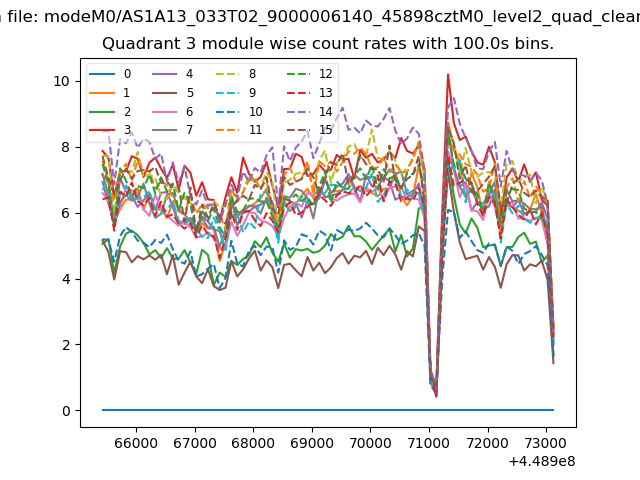
| Module-wise count rates for Quadrant A Data is divided into 100 sec bins |
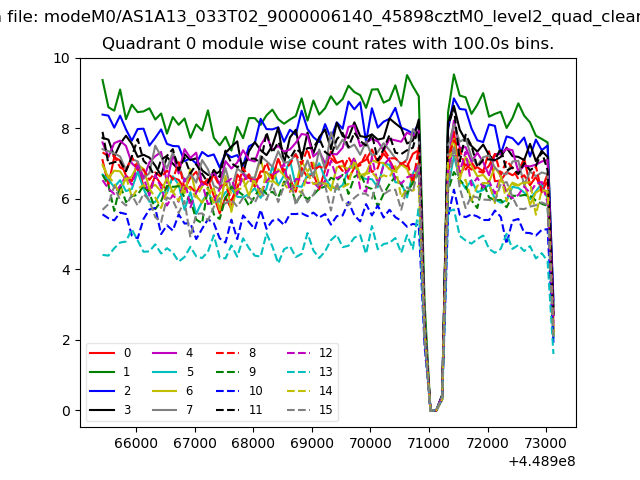 |
 |
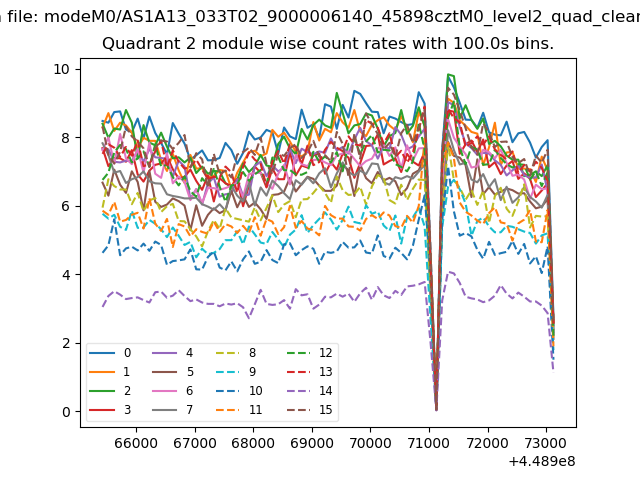
| Module-wise count rates for Quadrant B Data is divided into 100 sec bins |
 |
 |
| Module-wise count rates for Quadrant C Data is divided into 100 sec bins |
 |
 |
| Module-wise count rates for Quadrant D Data is divided into 100 sec bins |
 |
 |
| Parameter | Plot |
|---|---|
| CZT HV Monitor | 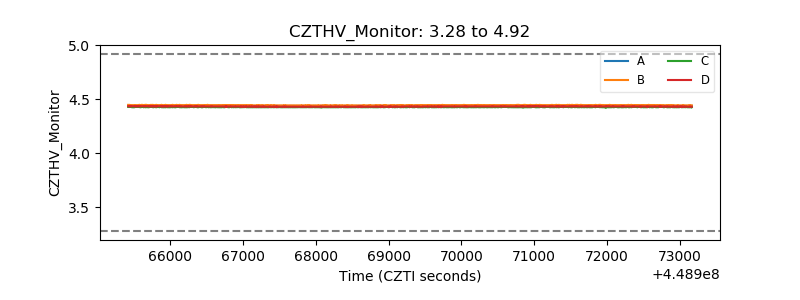 |
| D_VDD | 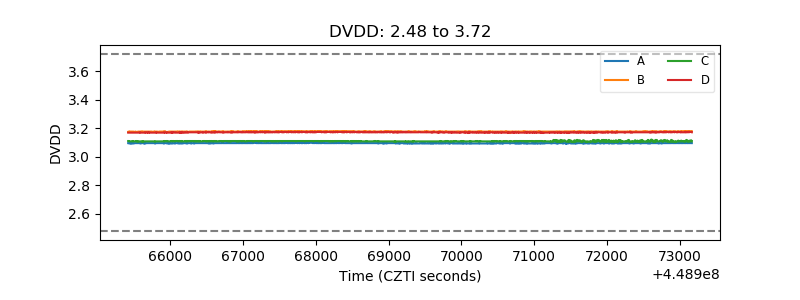 |
| Temperature 1 | 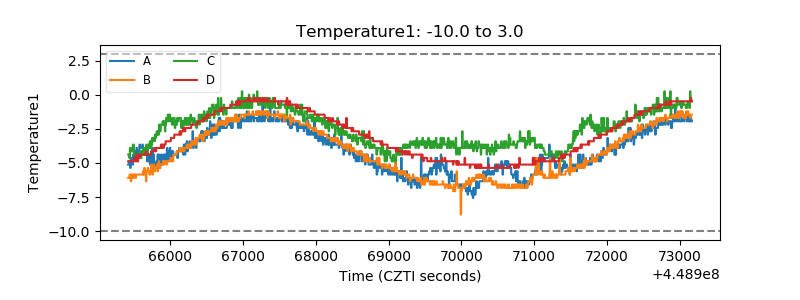 |
| Veto HV Monitor | 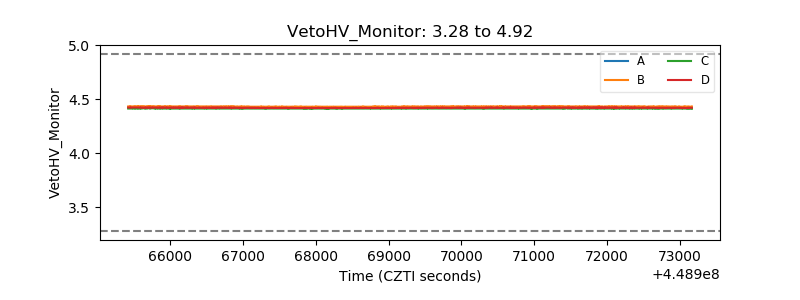 |
| Veto LLD | 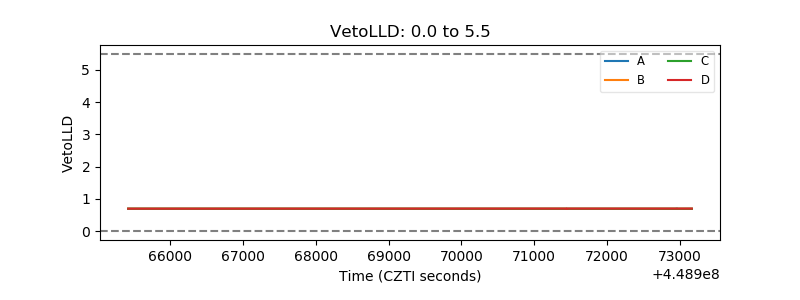 |
| Alpha Counter | 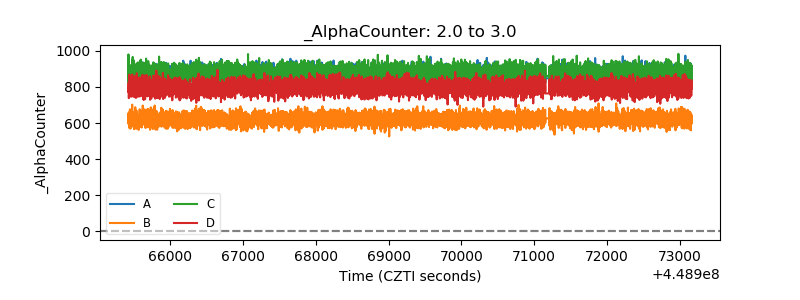 |
| _CPM_Rate | 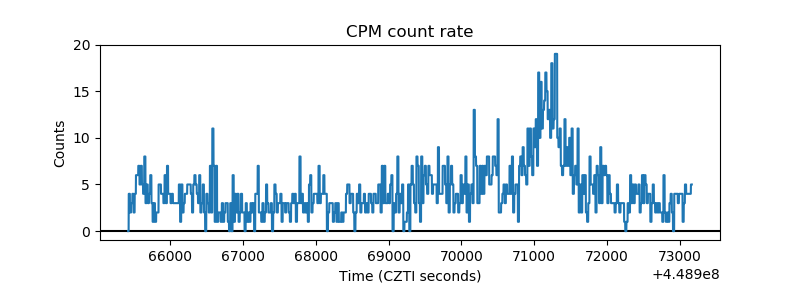 |
| CZT Counter | 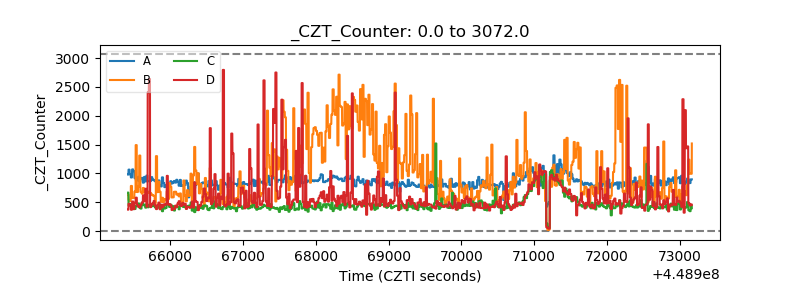 |
| +2.5 Volts monitor | 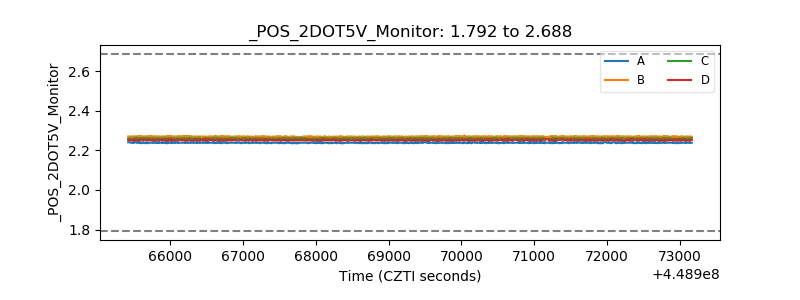 |
| +5 Volts monitor | 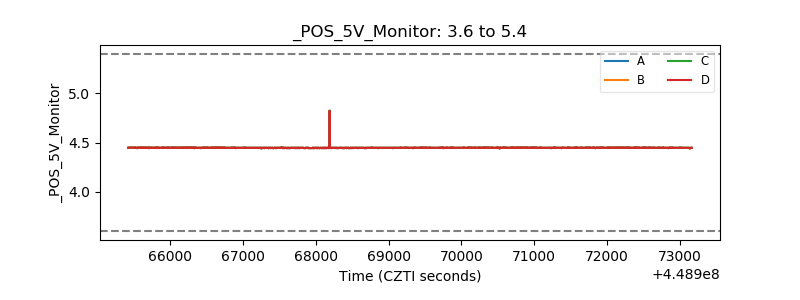 |
| _ROLL_ROT | 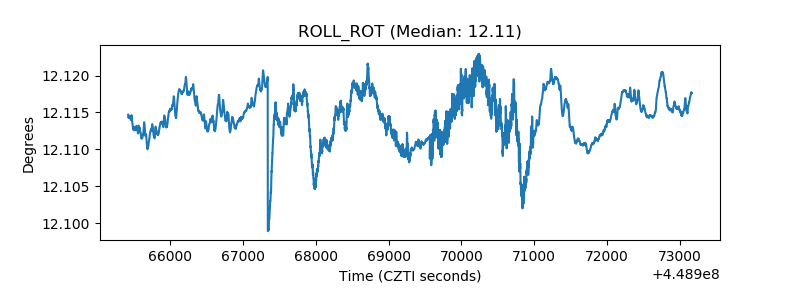 |
| _Roll_DEC | 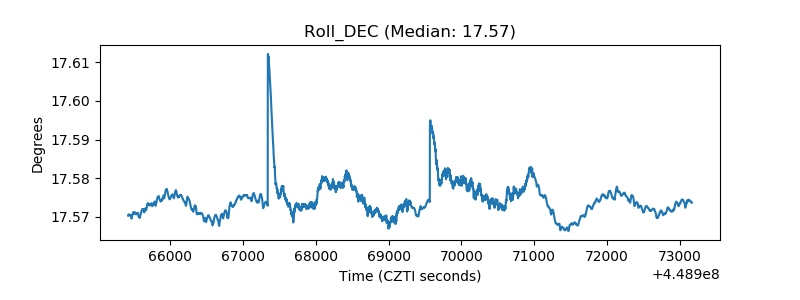 |
| _Roll_RA | 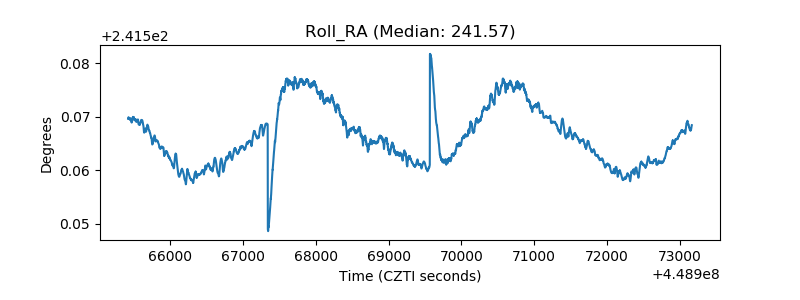 |
| Veto Counter | 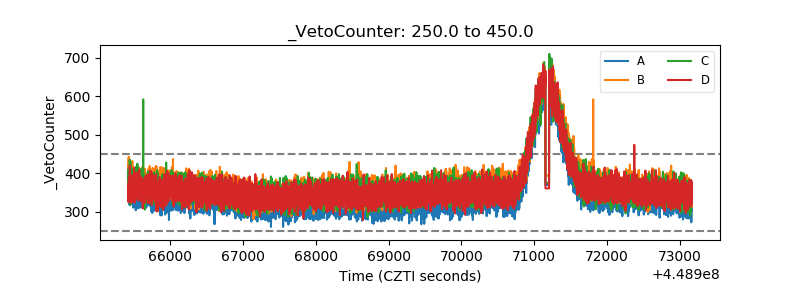 |