| Param | Original file | Final file |
|---|---|---|
| Filename | modeM0/AS1A13_033T02_9000006140_45899cztM0_level2.fits | modeM0/AS1A13_033T02_9000006140_45899cztM0_level2_quad_clean.evt |
| Size (bytes) | 677,977,920 | 118,578,240 |
| Size | 646.6 MB | 113.1 MB |
| Events in quadrant A | 6,564,958 | 818,951 |
| Events in quadrant B | 9,574,286 | 704,203 |
| Events in quadrant C | 3,436,222 | 808,600 |
| Events in quadrant D | 4,927,851 | 724,815 |
| Mode SS | |||
|---|---|---|---|
| Quadrant | BADHDUFLAG | Total packets | Discarded packets |
| A | 0 | 154 | 0 |
| B | 0 | 154 | 0 |
| C | 0 | 154 | 0 |
| D | 0 | 154 | 0 |
| Mode M0 | |||
|---|---|---|---|
| Quadrant | BADHDUFLAG | Total packets | Discarded packets |
| A | 0 | 23997 | 0 |
| B | 0 | 33870 | 0 |
| C | 0 | 15841 | 0 |
| D | 0 | 19898 | 0 |
| Quadrant | Total seconds | Saturated seconds | Saturation percentage |
|---|---|---|---|
| A | 7667 | 82 | 1.069519% |
| B | 7668 | 1650 | 21.517997% |
| C | 7668 | 8 | 0.104330% |
| D | 7668 | 224 | 2.921231% |
Noise dominated data is calculated using 1-second bins in cleaned event files. If a bin has >2000 counts, and if more than 50% of those come from <1% of pixels, then it is considered to be noise-dominated and hence unusable.
| Quadrant | # 1 sec bins | Bins with >0 counts | Bins with >2000 counts | High rate bins dominated by noise | Noise dominated (total time) | Noise dominated (detector-on time) | Marked lightcurve |
|---|---|---|---|---|---|---|---|
| A | 7667 | 7667 | 2 | 2 | 0.03% | 0.03% | 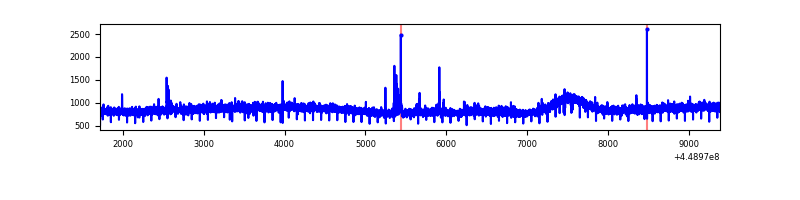 |
| B | 7667 | 7667 | 1140 | 1140 | 14.87% | 14.87% | 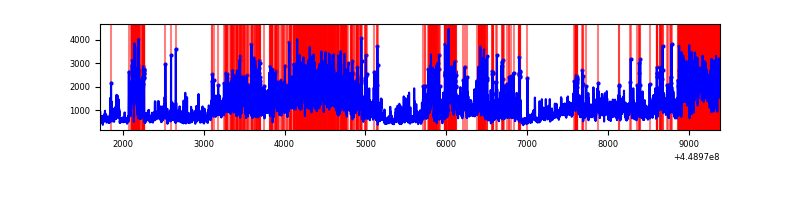 |
| C | 7668 | 7668 | 3 | 3 | 0.04% | 0.04% | 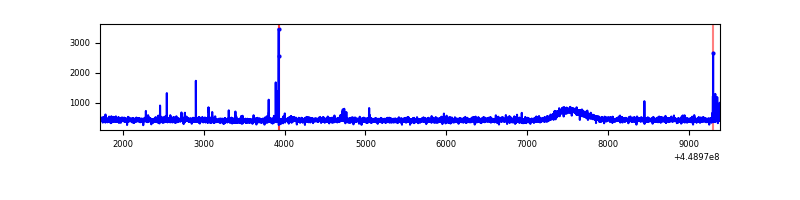 |
| D | 7668 | 7668 | 189 | 189 | 2.46% | 2.46% | 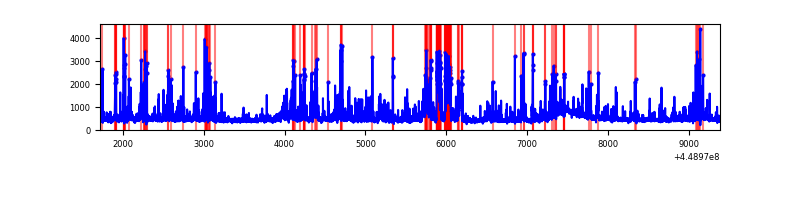 |
Top three noisy pixels from each quadrant. If the there are fewer than three noisy pixels in the level2.evt file, extra rows are filled as -1
| Pixel properties | Quadrant properties | ||||||
|---|---|---|---|---|---|---|---|
| Quadrant | DetID | PixID | Counts | Sigma | Mean | Median | Sigma |
| A | 10 | 83 | 3071318 | 16368.94 | 885 | 864 | 187.6 |
| A | 14 | 235 | 51975 | 272.48 | 885 | 864 | 187.6 |
| A | 3 | 137 | 10462 | 51.17 | 885 | 864 | 187.6 |
| B | 3 | 112 | 5038651 | 30804.29 | 815 | 788 | 163.5 |
| B | 0 | 183 | 1062219 | 6490.18 | 815 | 788 | 163.5 |
| B | 0 | 245 | 74011 | 447.73 | 815 | 788 | 163.5 |
| C | 2 | 14 | 20605 | 95.74 | 865 | 869 | 206.1 |
| C | 12 | 2 | 20117 | 93.37 | 865 | 869 | 206.1 |
| C | 12 | 249 | 9394 | 41.35 | 865 | 869 | 206.1 |
| D | 12 | 2 | 579506 | 2599.88 | 861 | 832 | 222.6 |
| D | 1 | 52 | 462798 | 2075.53 | 861 | 832 | 222.6 |
| D | 12 | 233 | 189859 | 849.26 | 861 | 832 | 222.6 |
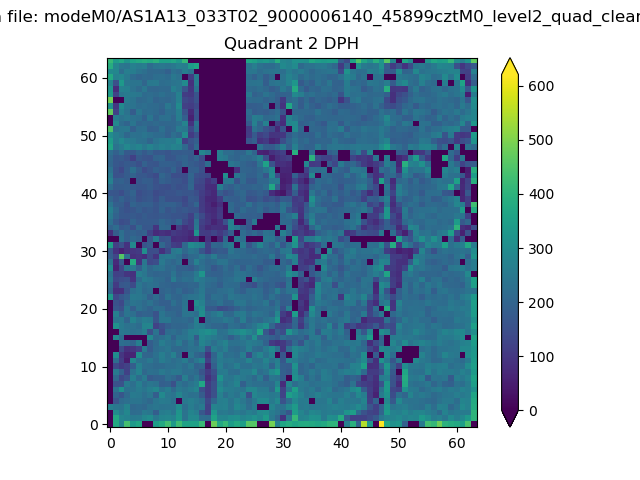
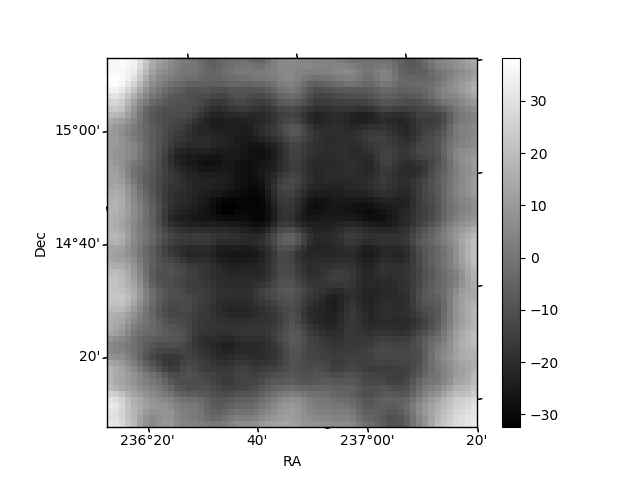
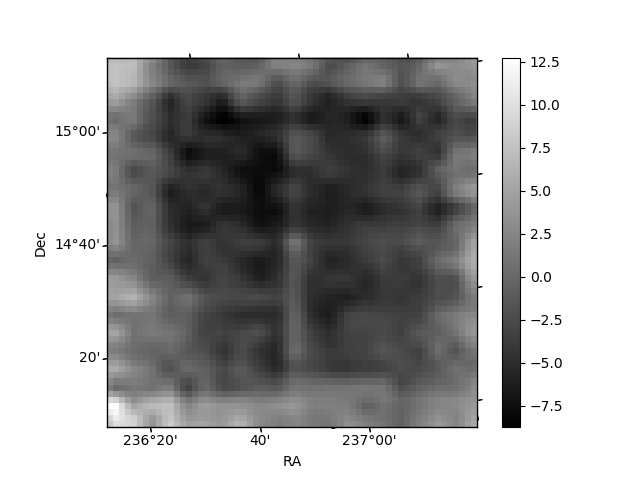
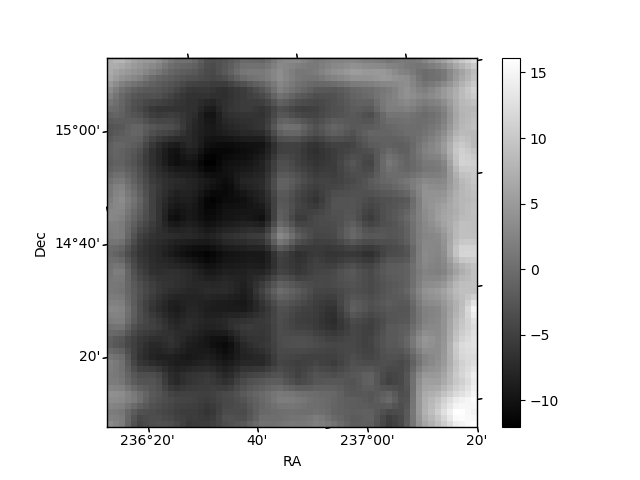
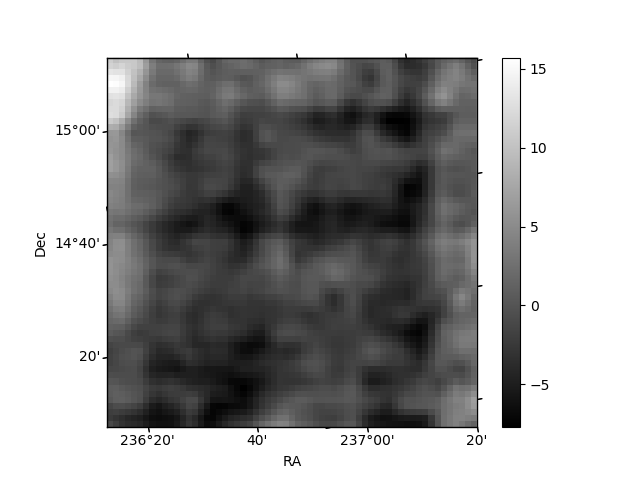
Histogram calculated using DETX and DETY for each event in the final _common_clean file
| Quadrant A | 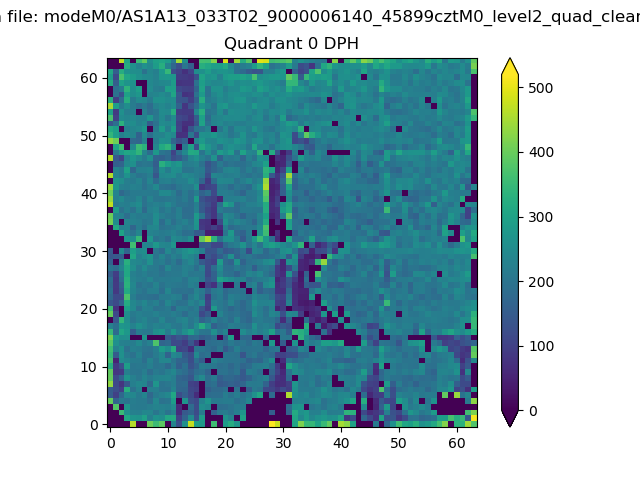 |
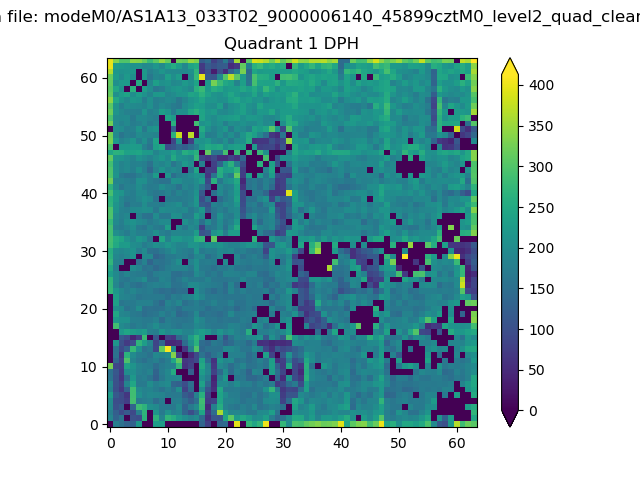 |
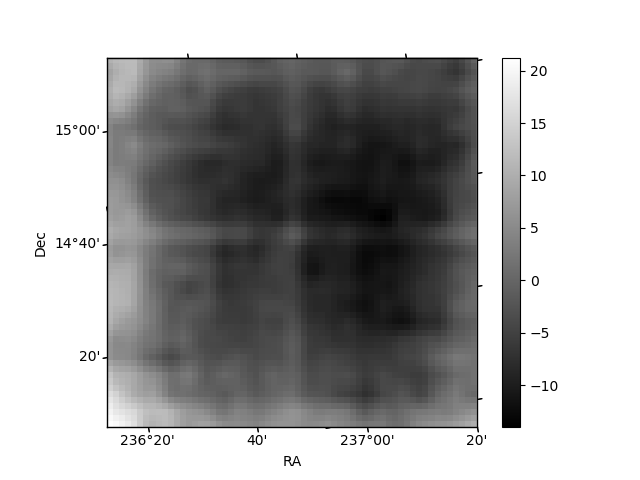
Quadrant B |
|---|---|---|---|
| Quadrant D | 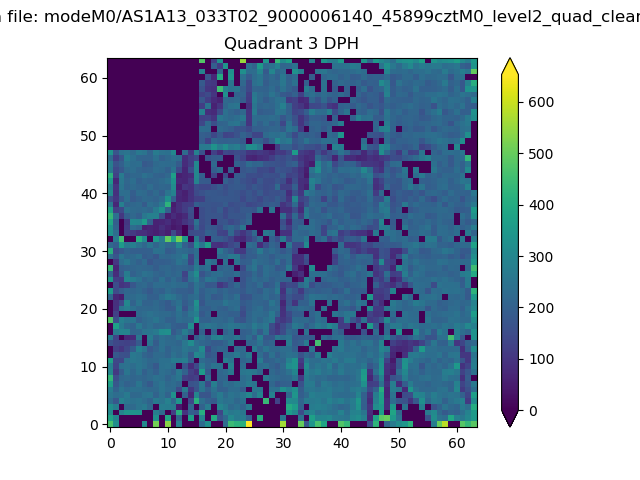 |
 |
Quadrant C |
| Plot type | Count rate plots | Images |
|---|---|---|
| Comparison with Poisson distribution Blue bars denote a histogram of data divided into 1 sec bins. Red curve is a Poisson curve with rate = median count rate of data. |
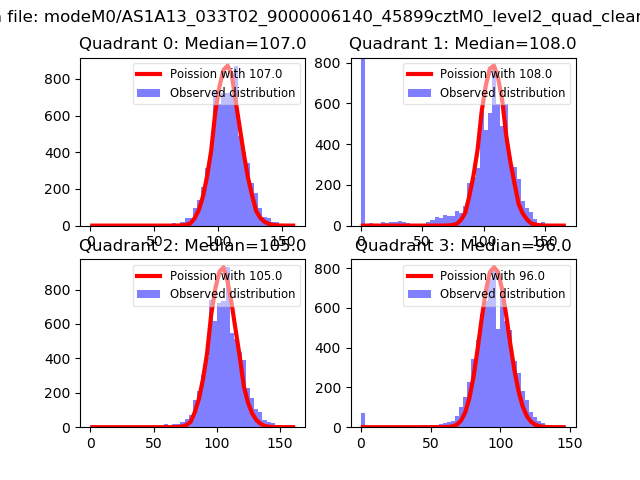 |
 |
| Quadrant-wise count rates Data is divided into 100 sec bins |
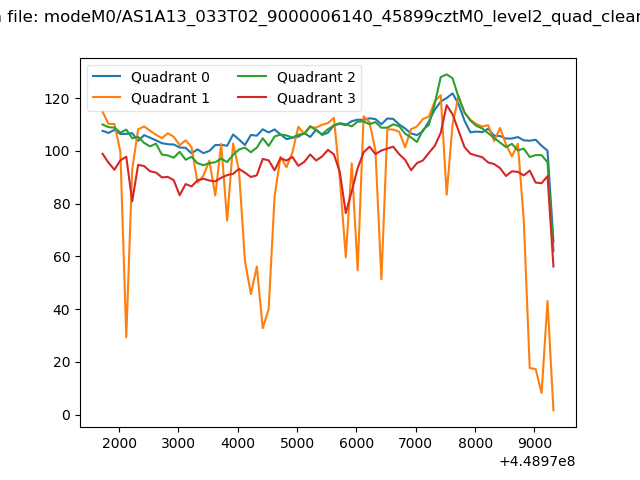 |
|
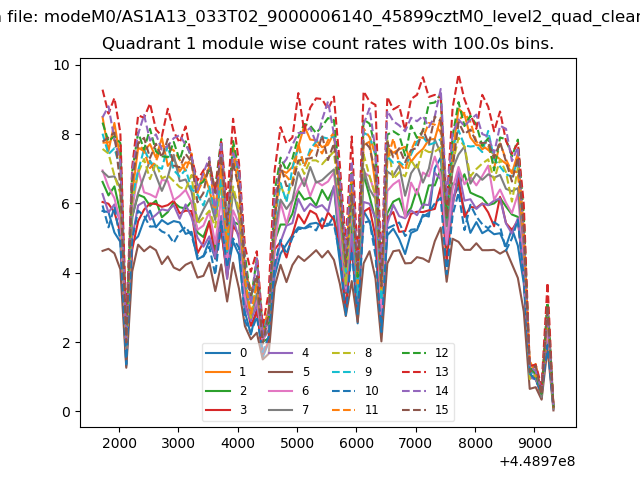
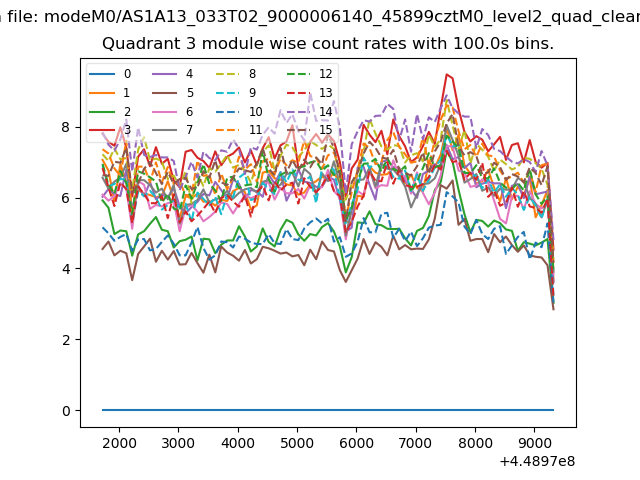
| Module-wise count rates for Quadrant A Data is divided into 100 sec bins |
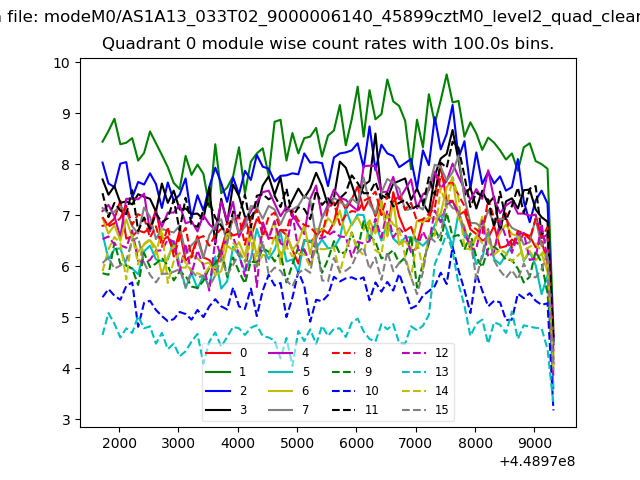 |
 |
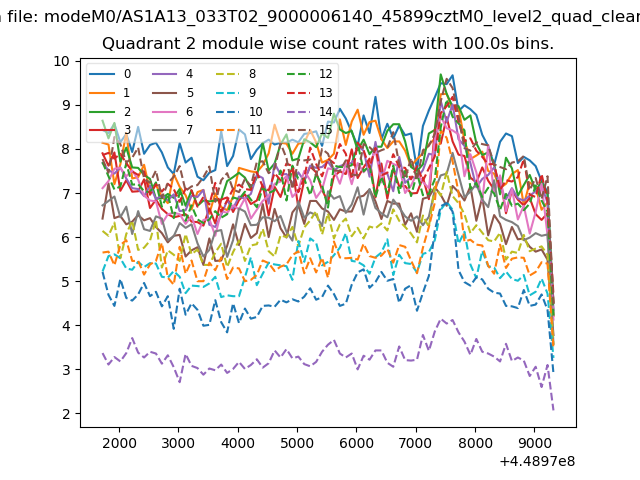
| Module-wise count rates for Quadrant B Data is divided into 100 sec bins |
 |
 |
| Module-wise count rates for Quadrant C Data is divided into 100 sec bins |
 |
 |
| Module-wise count rates for Quadrant D Data is divided into 100 sec bins |
 |
 |
| Parameter | Plot |
|---|---|
| CZT HV Monitor | 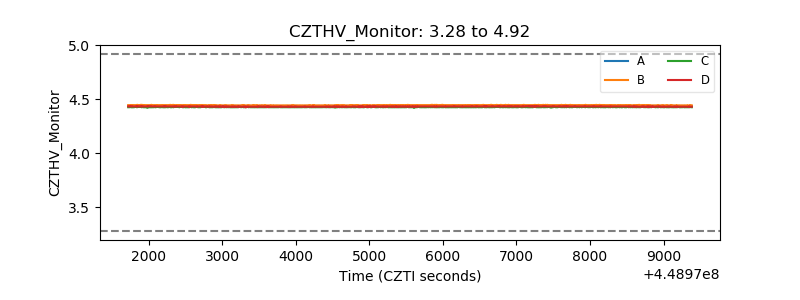 |
| D_VDD | 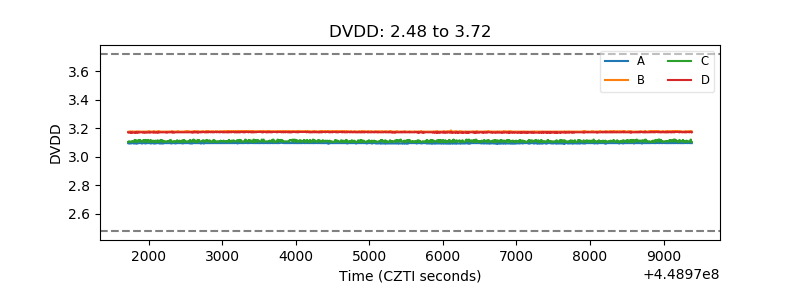 |
| Temperature 1 | 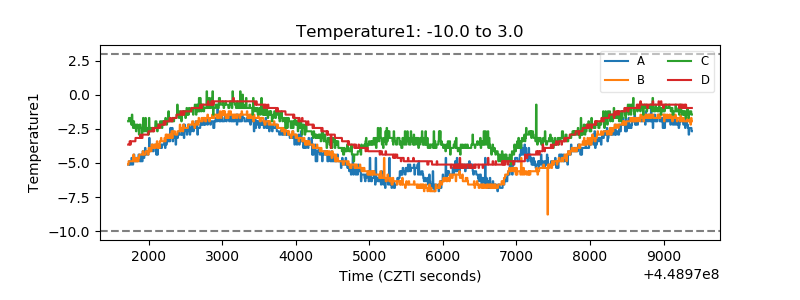 |
| Veto HV Monitor | 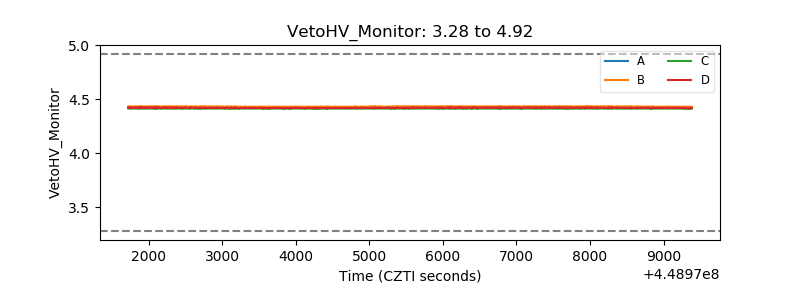 |
| Veto LLD | 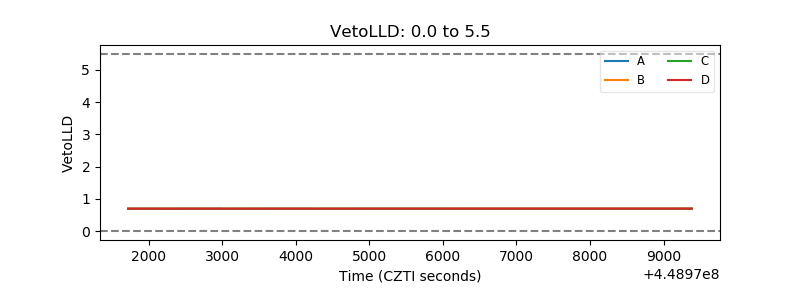 |
| Alpha Counter | 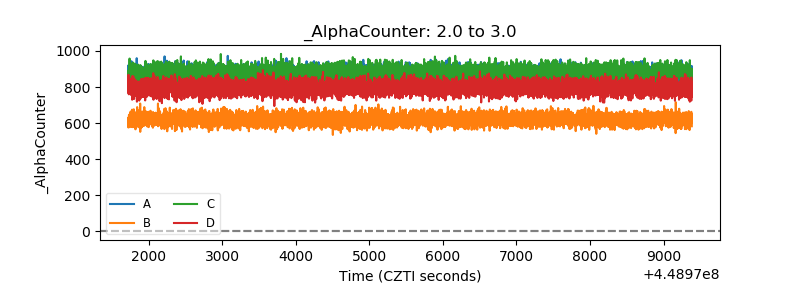 |
| _CPM_Rate | 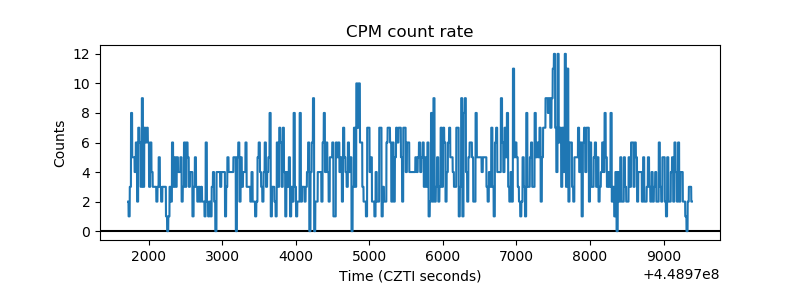 |
| CZT Counter | 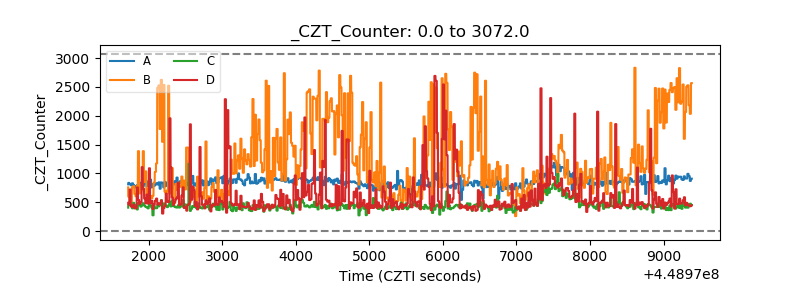 |
| +2.5 Volts monitor | 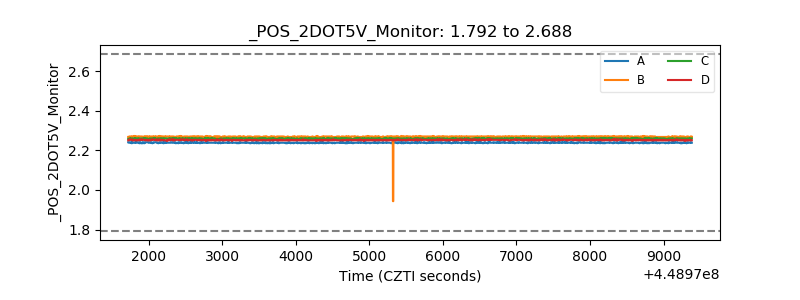 |
| +5 Volts monitor | 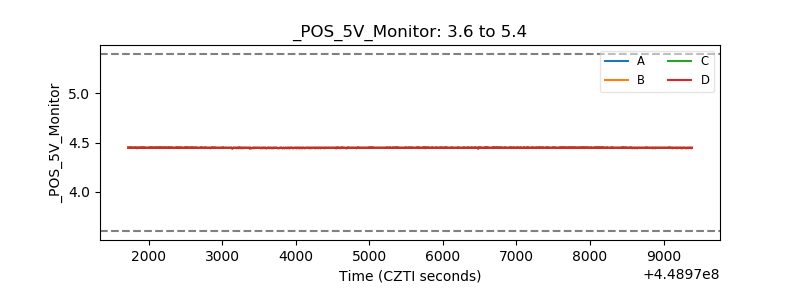 |
| _ROLL_ROT | 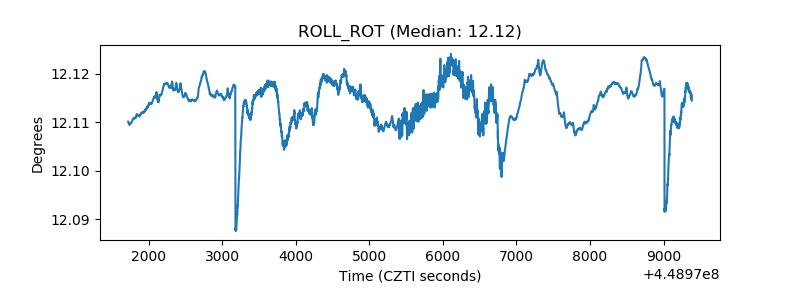 |
| _Roll_DEC |  |
| _Roll_RA | 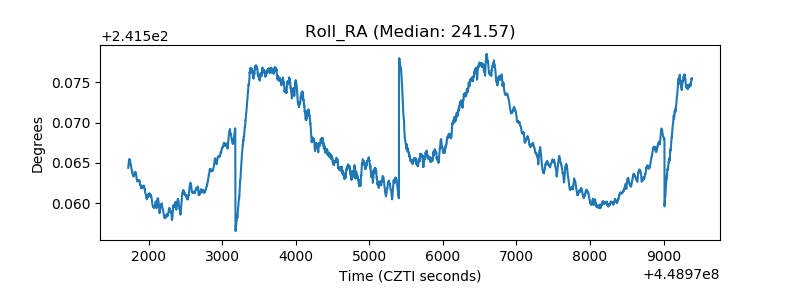 |
| Veto Counter | 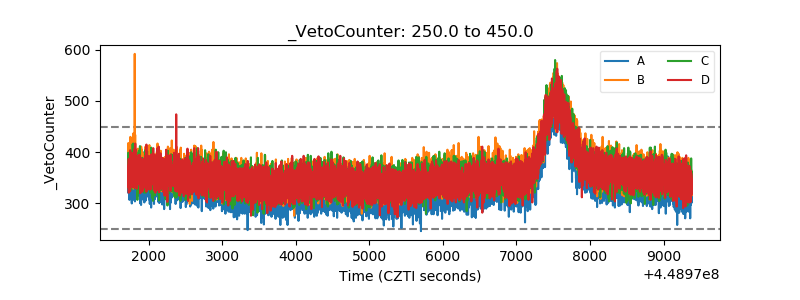 |