| Param | Original file | Final file |
|---|---|---|
| Filename | modeM0/AS1A13_033T02_9000006140_45900cztM0_level2.fits | modeM0/AS1A13_033T02_9000006140_45900cztM0_level2_quad_clean.evt |
| Size (bytes) | 706,351,680 | 117,976,320 |
| Size | 673.6 MB | 112.5 MB |
| Events in quadrant A | 6,737,387 | 821,701 |
| Events in quadrant B | 11,119,555 | 656,555 |
| Events in quadrant C | 3,489,015 | 814,413 |
| Events in quadrant D | 4,201,378 | 740,640 |
| Mode SS | |||
|---|---|---|---|
| Quadrant | BADHDUFLAG | Total packets | Discarded packets |
| A | 0 | 154 | 0 |
| B | 0 | 154 | 0 |
| C | 0 | 154 | 0 |
| D | 0 | 154 | 0 |
| Mode M0 | |||
|---|---|---|---|
| Quadrant | BADHDUFLAG | Total packets | Discarded packets |
| A | 0 | 24716 | 0 |
| B | 0 | 38497 | 1 |
| C | 0 | 16007 | 0 |
| D | 0 | 17820 | 0 |
| Quadrant | Total seconds | Saturated seconds | Saturation percentage |
|---|---|---|---|
| A | 7745 | 153 | 1.975468% |
| B | 7745 | 2281 | 29.451259% |
| C | 7745 | 19 | 0.245320% |
| D | 7745 | 111 | 1.433183% |
Noise dominated data is calculated using 1-second bins in cleaned event files. If a bin has >2000 counts, and if more than 50% of those come from <1% of pixels, then it is considered to be noise-dominated and hence unusable.
| Quadrant | # 1 sec bins | Bins with >0 counts | Bins with >2000 counts | High rate bins dominated by noise | Noise dominated (total time) | Noise dominated (detector-on time) | Marked lightcurve |
|---|---|---|---|---|---|---|---|
| A | 7745 | 7745 | 7 | 7 | 0.09% | 0.09% | 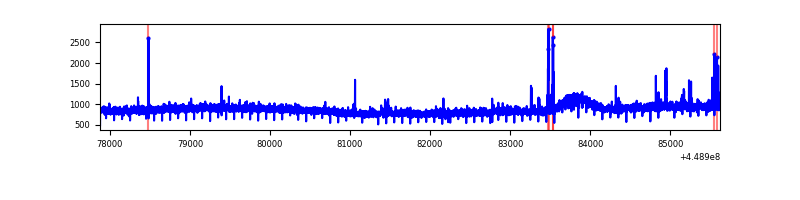 |
| B | 7745 | 7745 | 1393 | 1393 | 17.99% | 17.99% | 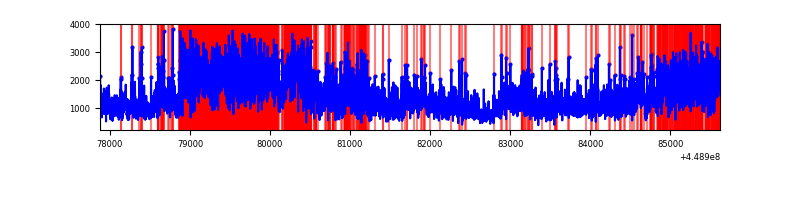 |
| C | 7745 | 7745 | 2 | 2 | 0.03% | 0.03% | 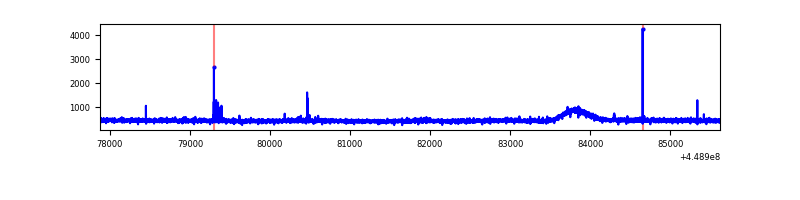 |
| D | 7745 | 7745 | 76 | 76 | 0.98% | 0.98% | 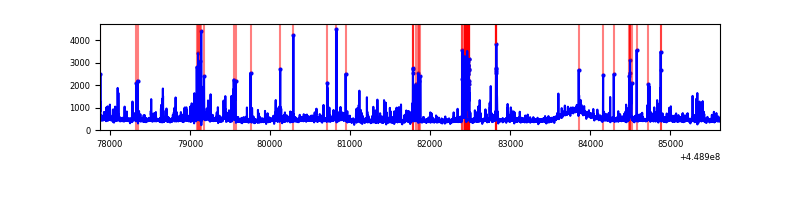 |
Top three noisy pixels from each quadrant. If the there are fewer than three noisy pixels in the level2.evt file, extra rows are filled as -1
| Pixel properties | Quadrant properties | ||||||
|---|---|---|---|---|---|---|---|
| Quadrant | DetID | PixID | Counts | Sigma | Mean | Median | Sigma |
| A | 10 | 83 | 3149893 | 16563.36 | 901 | 880 | 190.1 |
| A | 14 | 235 | 86899 | 452.45 | 901 | 880 | 190.1 |
| A | 9 | 191 | 16251 | 80.85 | 901 | 880 | 190.1 |
| B | 3 | 112 | 7158200 | 43244.68 | 821 | 793 | 165.5 |
| B | 0 | 183 | 461047 | 2780.83 | 821 | 793 | 165.5 |
| B | 4 | 171 | 135230 | 812.26 | 821 | 793 | 165.5 |
| C | 2 | 14 | 30019 | 138.74 | 882 | 887 | 210.0 |
| C | 3 | 9 | 6921 | 28.74 | 882 | 887 | 210.0 |
| C | 8 | 128 | 6100 | 24.83 | 882 | 887 | 210.0 |
| D | 1 | 52 | 156207 | 688.55 | 881 | 851 | 225.6 |
| D | 13 | 249 | 133849 | 589.46 | 881 | 851 | 225.6 |
| D | 2 | 120 | 127346 | 560.64 | 881 | 851 | 225.6 |
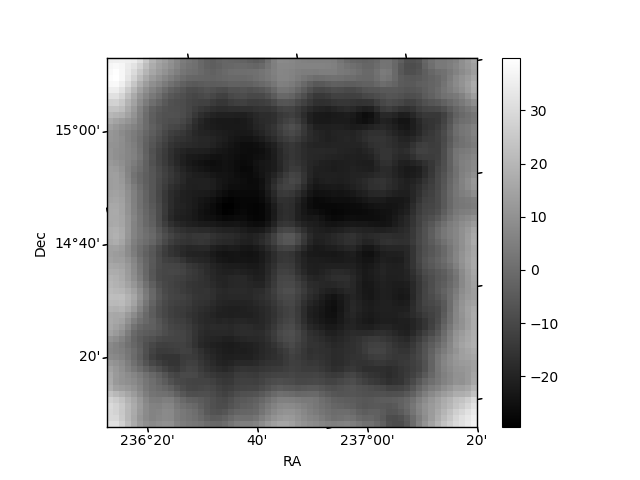
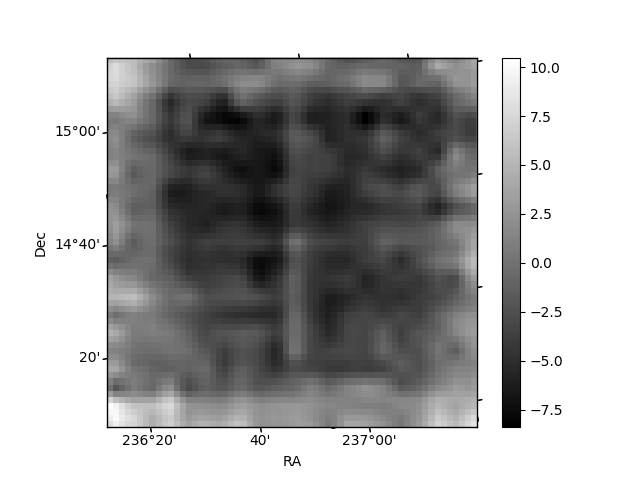
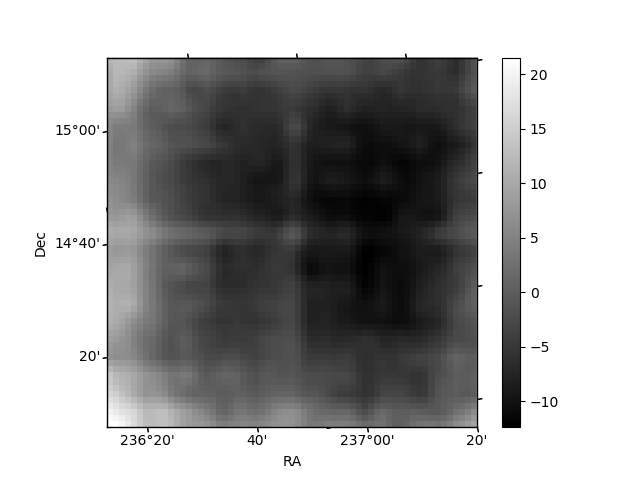
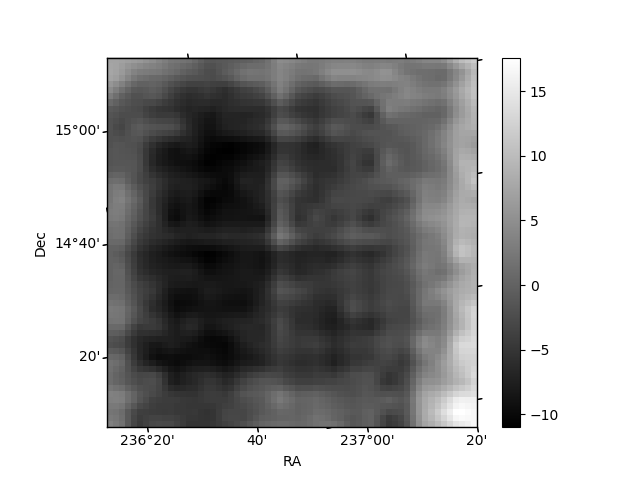
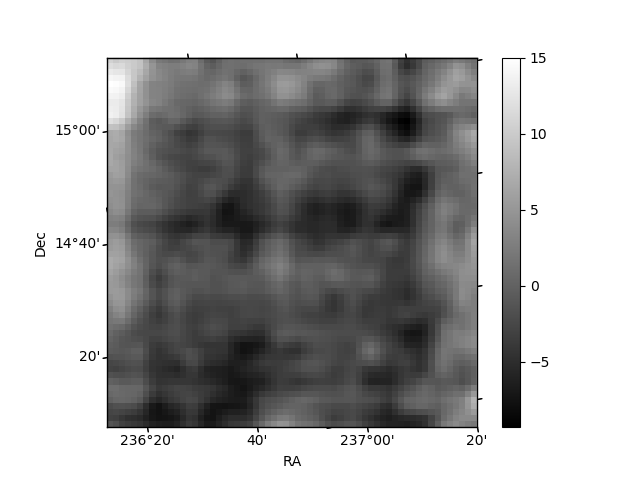
Histogram calculated using DETX and DETY for each event in the final _common_clean file
| Quadrant A | 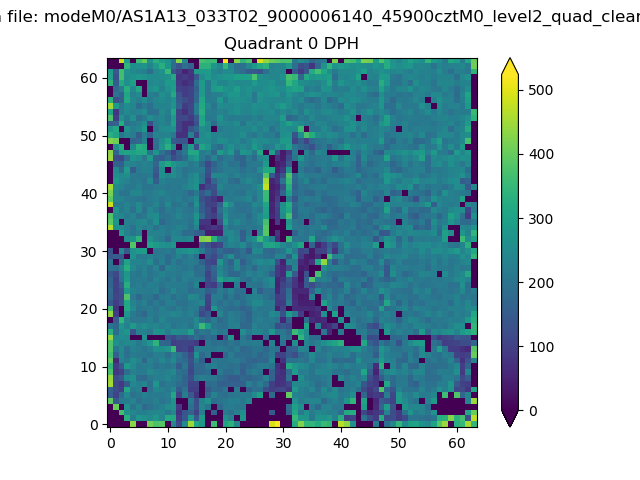 |
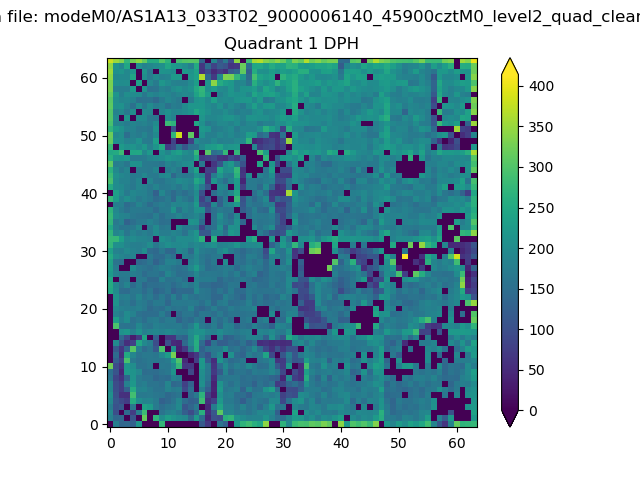 |
Quadrant B |
|---|---|---|---|
| Quadrant D | 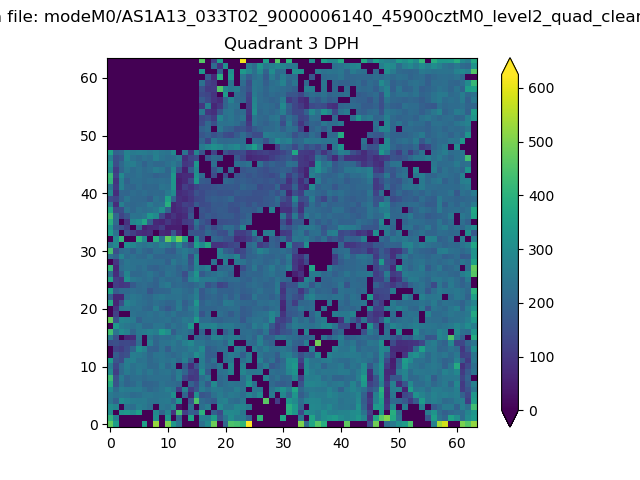 |
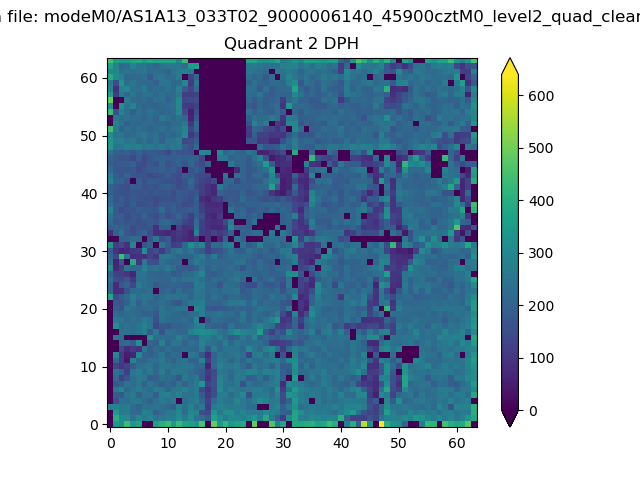 |
Quadrant C |
| Plot type | Count rate plots | Images |
|---|---|---|
| Comparison with Poisson distribution Blue bars denote a histogram of data divided into 1 sec bins. Red curve is a Poisson curve with rate = median count rate of data. |
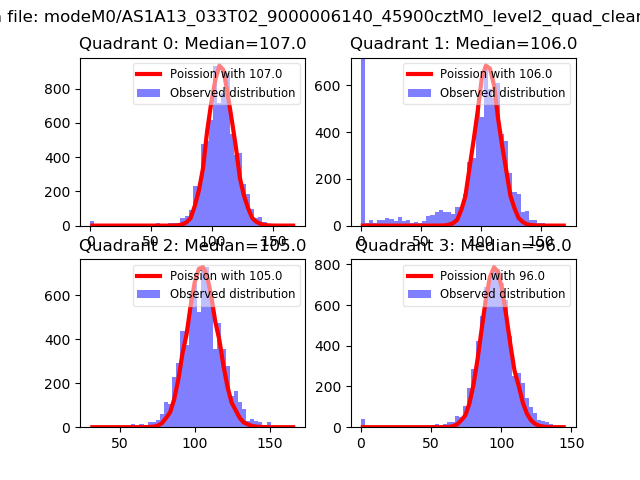 |
 |
| Quadrant-wise count rates Data is divided into 100 sec bins |
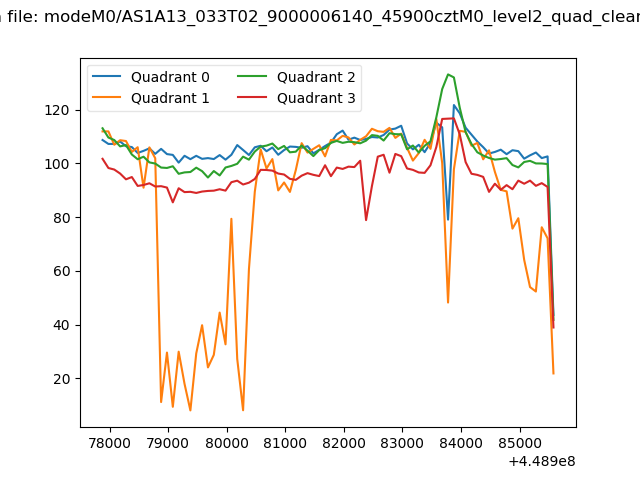 |
|
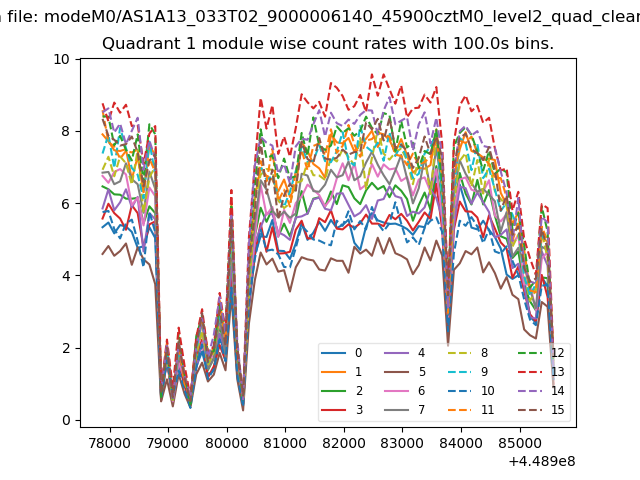
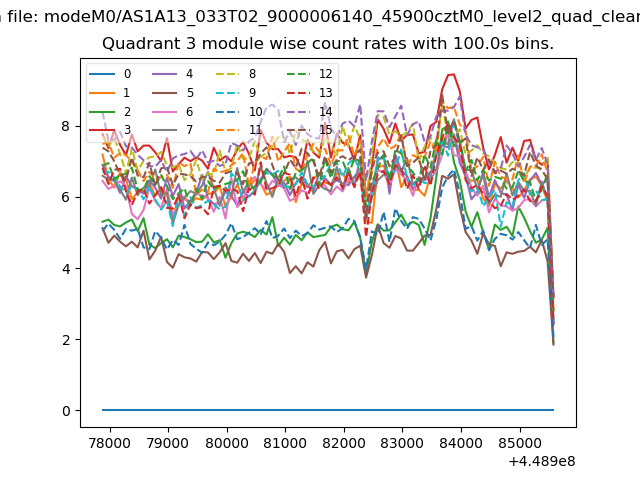
| Module-wise count rates for Quadrant A Data is divided into 100 sec bins |
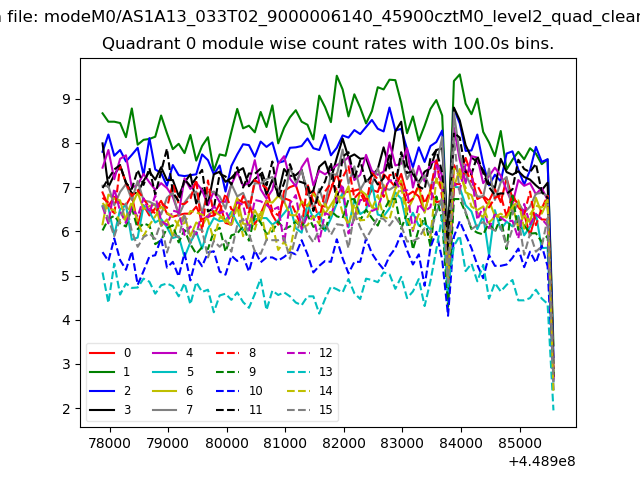 |
 |
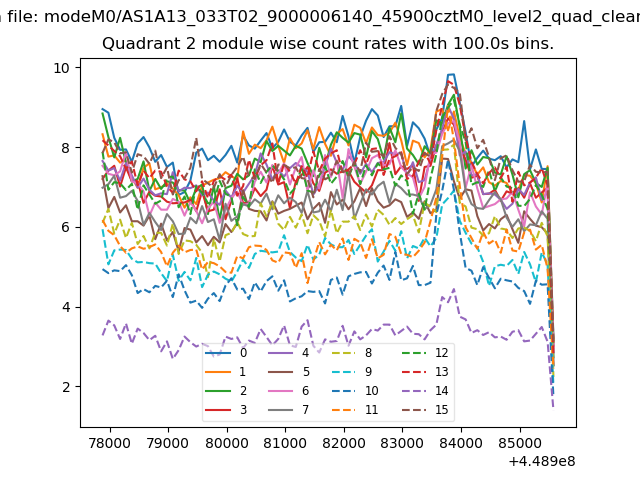
| Module-wise count rates for Quadrant B Data is divided into 100 sec bins |
 |
 |
| Module-wise count rates for Quadrant C Data is divided into 100 sec bins |
 |
 |
| Module-wise count rates for Quadrant D Data is divided into 100 sec bins |
 |
 |
| Parameter | Plot |
|---|---|
| CZT HV Monitor | 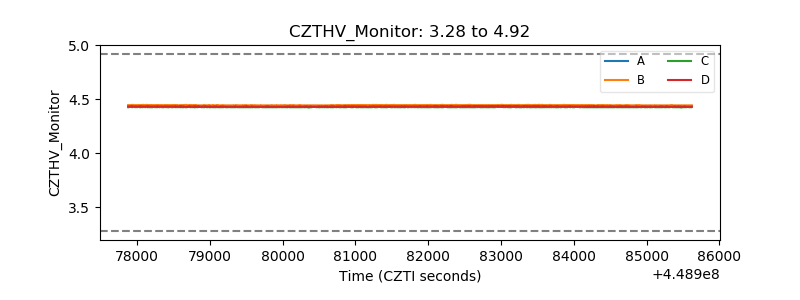 |
| D_VDD | 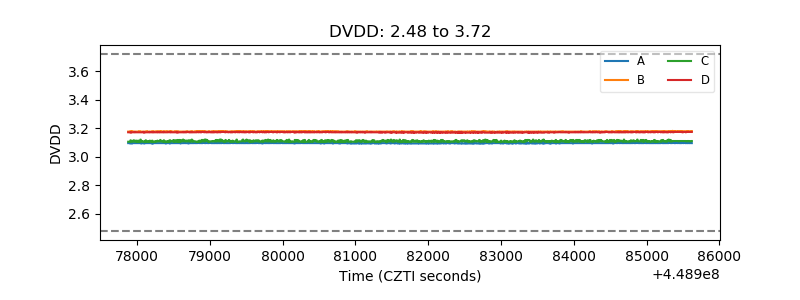 |
| Temperature 1 | 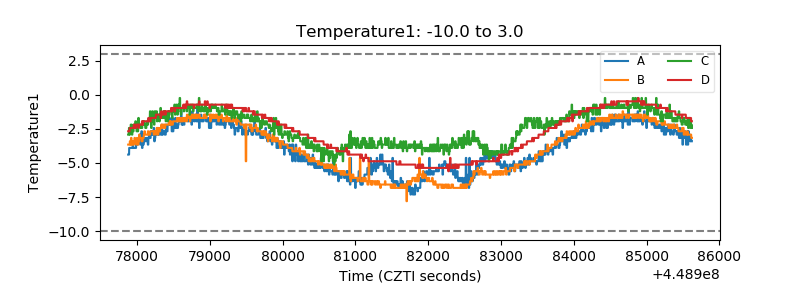 |
| Veto HV Monitor | 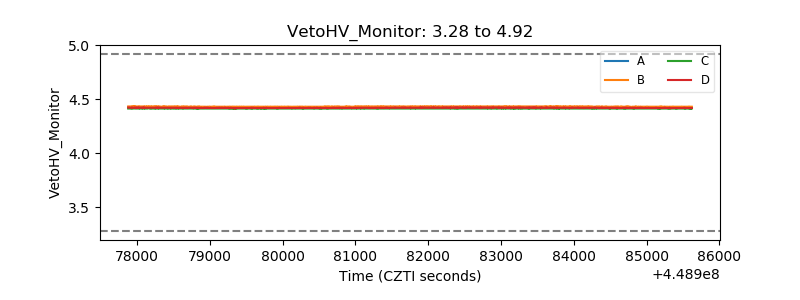 |
| Veto LLD | 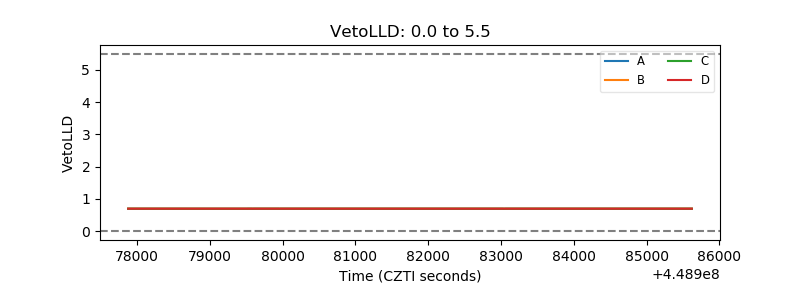 |
| Alpha Counter | 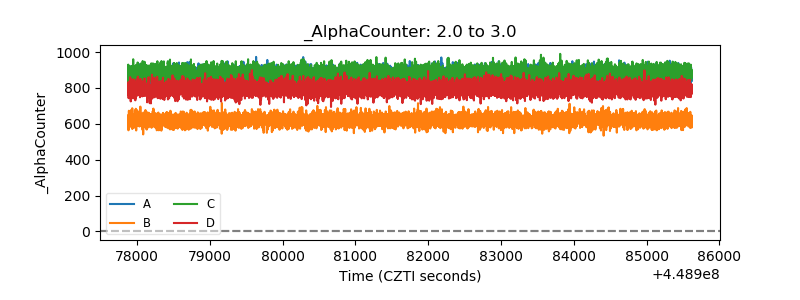 |
| _CPM_Rate | 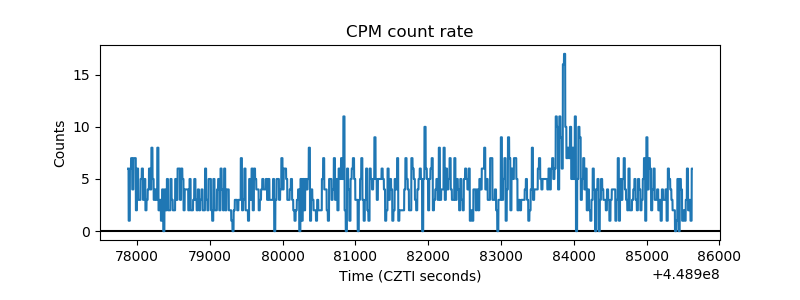 |
| CZT Counter | 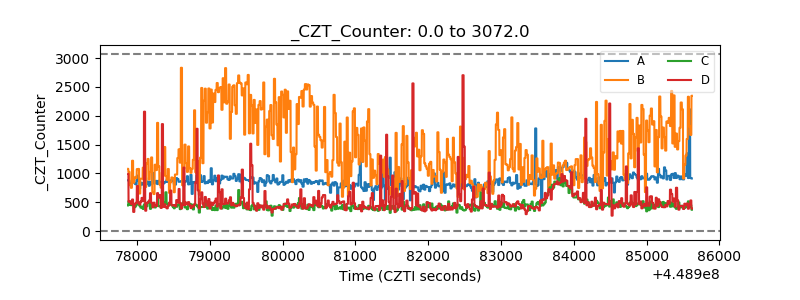 |
| +2.5 Volts monitor | 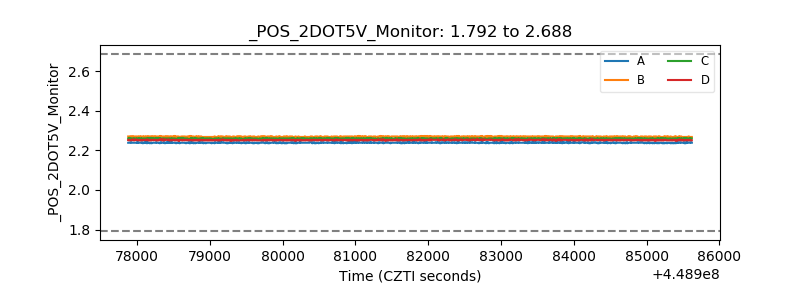 |
| +5 Volts monitor | 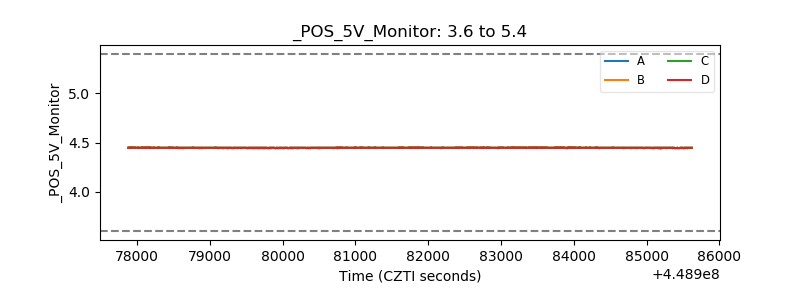 |
| _ROLL_ROT | 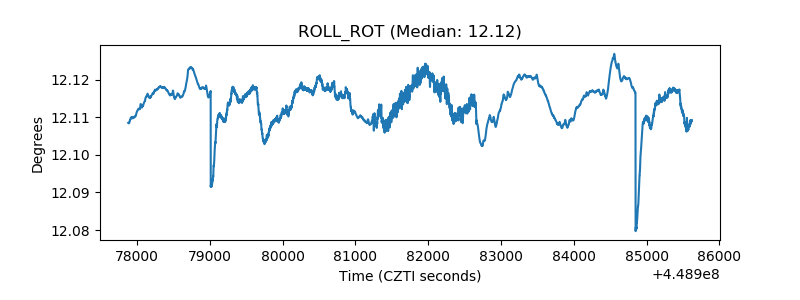 |
| _Roll_DEC | 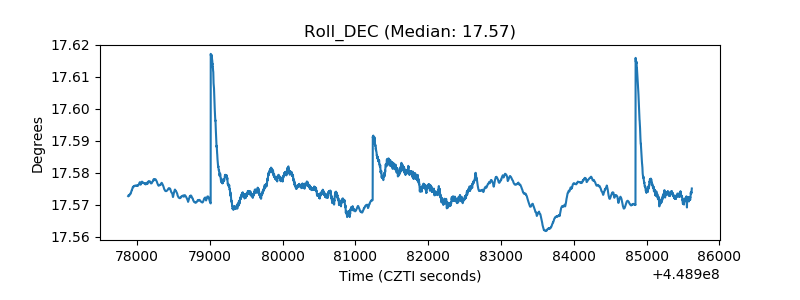 |
| _Roll_RA | 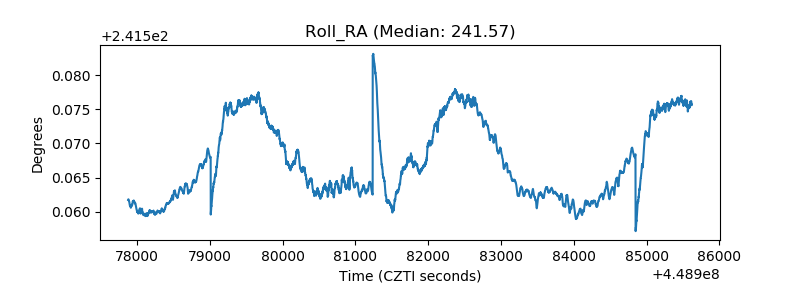 |
| Veto Counter | 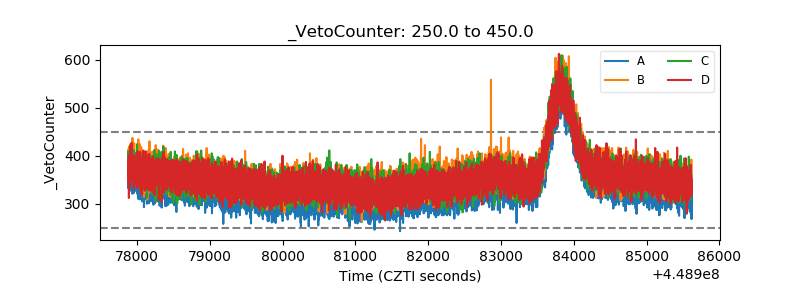 |