| Param | Original file | Final file |
|---|---|---|
| Filename | modeM0/AS1A13_033T02_9000006140_45903cztM0_level2.fits | modeM0/AS1A13_033T02_9000006140_45903cztM0_level2_quad_clean.evt |
| Size (bytes) | 1,559,664,000 | 308,269,440 |
| Size | 1.5 GB | 294.0 MB |
| Events in quadrant A | 16,470,315 | 2,129,998 |
| Events in quadrant B | 20,808,042 | 1,877,542 |
| Events in quadrant C | 8,414,049 | 2,085,995 |
| Events in quadrant D | 10,583,315 | 1,937,116 |
| Mode M9 | |||
|---|---|---|---|
| Quadrant | BADHDUFLAG | Total packets | Discarded packets |
| A | 0 | 14 | 0 |
| B | 0 | 14 | 0 |
| C | 0 | 14 | 0 |
| D | 0 | 14 | 0 |
| Mode SS | |||
|---|---|---|---|
| Quadrant | BADHDUFLAG | Total packets | Discarded packets |
| A | 0 | 386 | 0 |
| B | 0 | 386 | 0 |
| C | 0 | 386 | 0 |
| D | 0 | 386 | 0 |
| Mode M0 | |||
|---|---|---|---|
| Quadrant | BADHDUFLAG | Total packets | Discarded packets |
| A | 0 | 61643 | 3 |
| B | 0 | 75223 | 3 |
| C | 0 | 38946 | 3 |
| D | 0 | 44751 | 3 |
| Quadrant | Total seconds | Saturated seconds | Saturation percentage |
|---|---|---|---|
| A | 18898 | 494 | 2.614033% |
| B | 18898 | 2928 | 15.493703% |
| C | 18897 | 136 | 0.719691% |
| D | 18898 | 378 | 2.000212% |
Noise dominated data is calculated using 1-second bins in cleaned event files. If a bin has >2000 counts, and if more than 50% of those come from <1% of pixels, then it is considered to be noise-dominated and hence unusable.
| Quadrant | # 1 sec bins | Bins with >0 counts | Bins with >2000 counts | High rate bins dominated by noise | Noise dominated (total time) | Noise dominated (detector-on time) | Marked lightcurve |
|---|---|---|---|---|---|---|---|
| A | 20383 | 18900 | 21 | 21 | 0.10% | 0.11% | 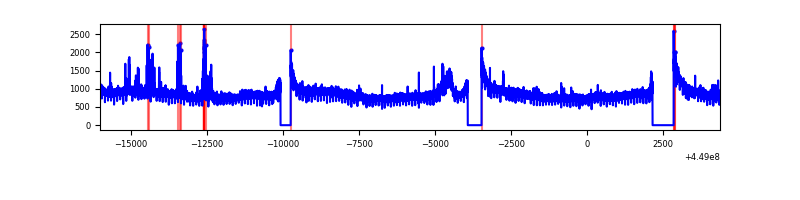 |
| B | 20383 | 18900 | 1509 | 1509 | 7.40% | 7.98% | 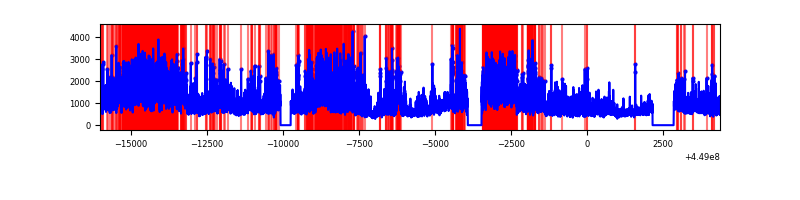 |
| C | 20382 | 18899 | 3 | 3 | 0.01% | 0.02% | 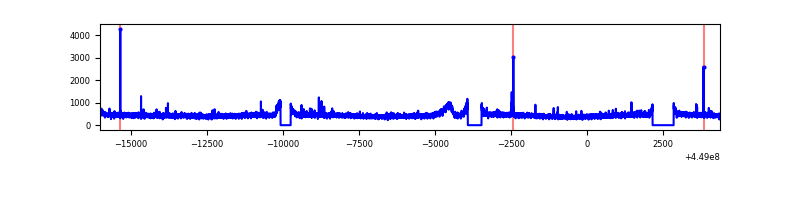 |
| D | 20383 | 18901 | 195 | 195 | 0.96% | 1.03% | 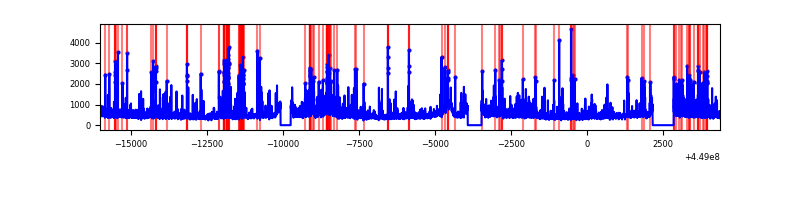 |
Top three noisy pixels from each quadrant. If the there are fewer than three noisy pixels in the level2.evt file, extra rows are filled as -1
| Pixel properties | Quadrant properties | ||||||
|---|---|---|---|---|---|---|---|
| Quadrant | DetID | PixID | Counts | Sigma | Mean | Median | Sigma |
| A | 10 | 83 | 7801741 | 17298.84 | 2173 | 2129 | 450.9 |
| A | 14 | 235 | 209796 | 460.59 | 2173 | 2129 | 450.9 |
| A | 3 | 137 | 25110 | 50.97 | 2173 | 2129 | 450.9 |
| B | 3 | 112 | 12253122 | 29982.03 | 2065 | 2001 | 408.6 |
| B | 4 | 171 | 119738 | 288.14 | 2065 | 2001 | 408.6 |
| B | 0 | 245 | 66111 | 156.9 | 2065 | 2001 | 408.6 |
| C | 2 | 14 | 36334 | 67.83 | 2139 | 2157 | 503.9 |
| C | 3 | 9 | 14933 | 25.36 | 2139 | 2157 | 503.9 |
| C | 13 | 61 | 14207 | 23.91 | 2139 | 2157 | 503.9 |
| D | 2 | 249 | 837592 | 1523.77 | 2148 | 2084 | 548.3 |
| D | 1 | 52 | 395721 | 717.9 | 2148 | 2084 | 548.3 |
| D | 5 | 171 | 229913 | 415.51 | 2148 | 2084 | 548.3 |
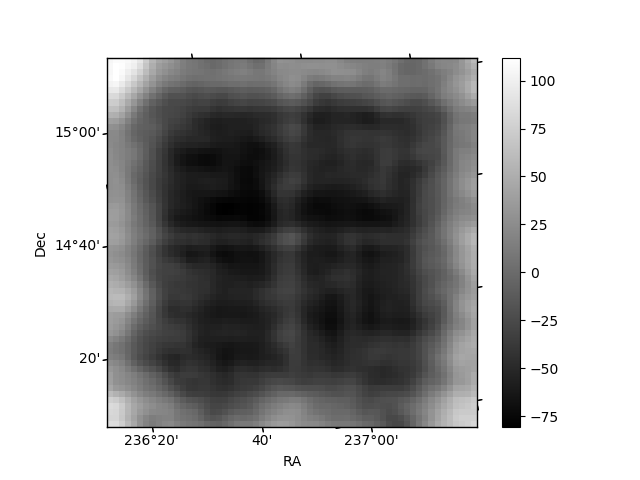
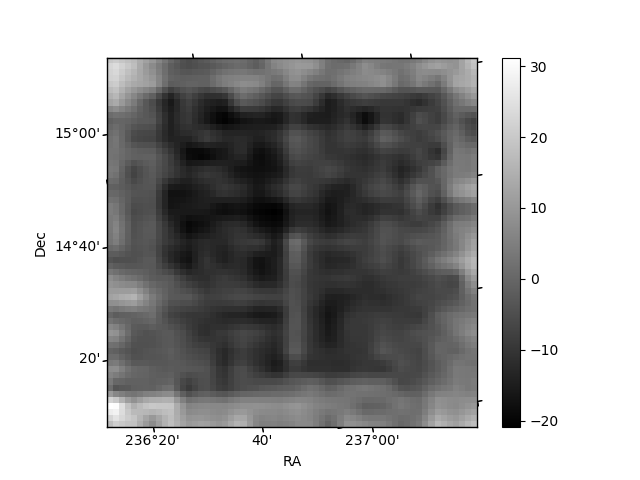
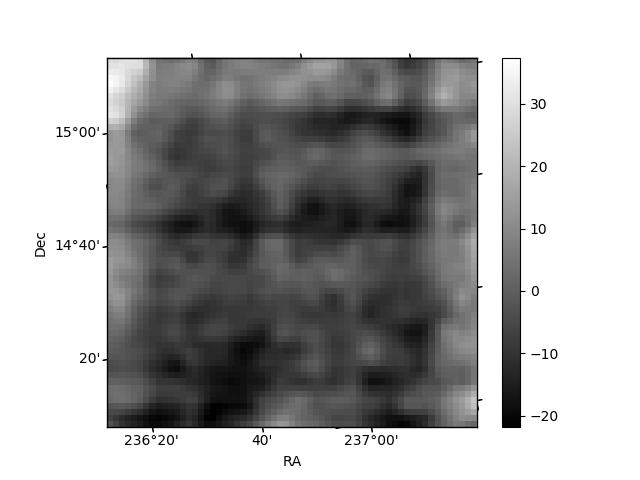
Histogram calculated using DETX and DETY for each event in the final _common_clean file
| Quadrant A | 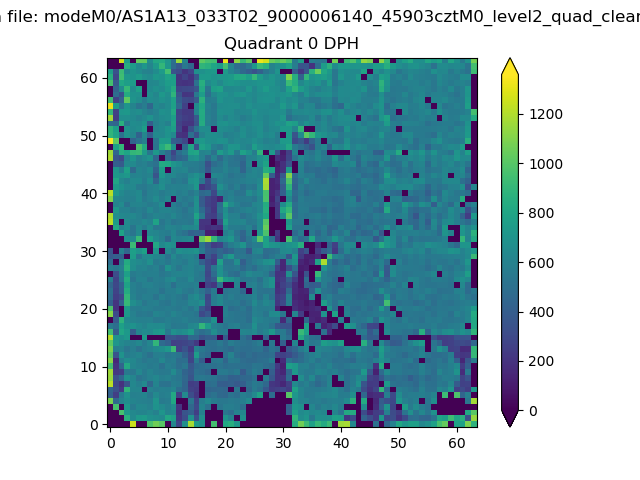 |
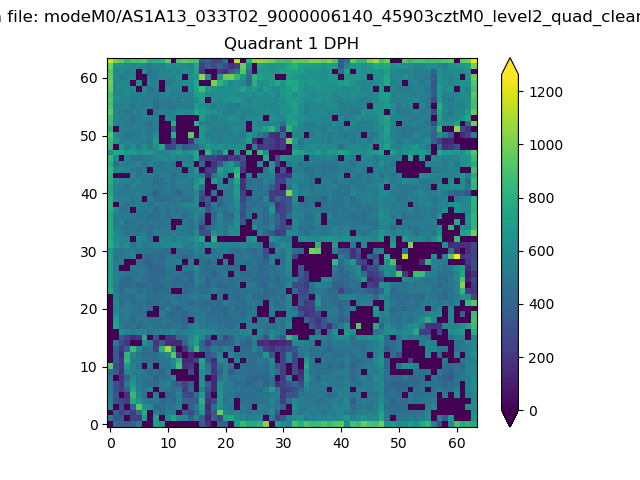 |
Quadrant B |
|---|---|---|---|
| Quadrant D | 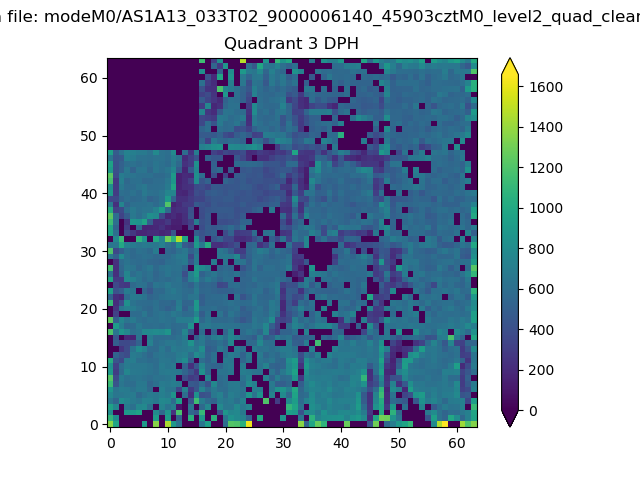 |
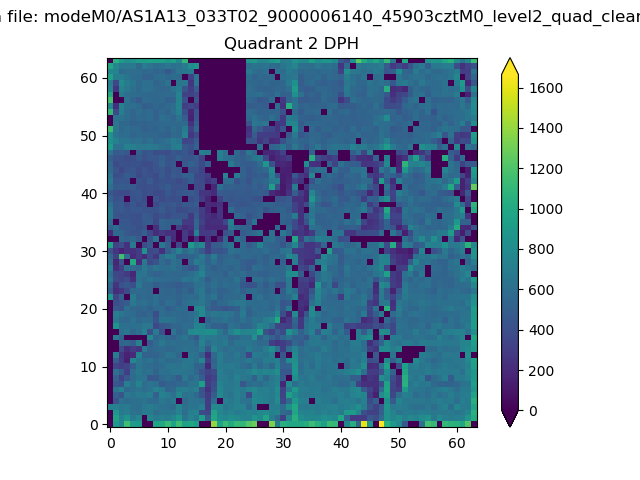 |
Quadrant C |
| Plot type | Count rate plots | Images |
|---|---|---|
| Comparison with Poisson distribution Blue bars denote a histogram of data divided into 1 sec bins. Red curve is a Poisson curve with rate = median count rate of data. |
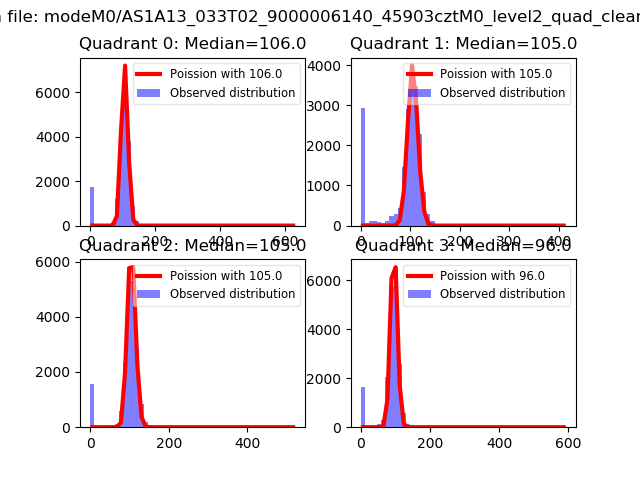 |
 |
| Quadrant-wise count rates Data is divided into 100 sec bins |
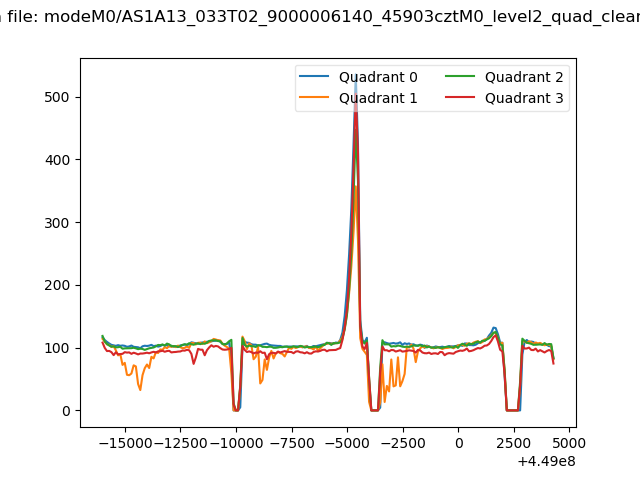 |
|
| Module-wise count rates for Quadrant A Data is divided into 100 sec bins |
 |
 |
| Module-wise count rates for Quadrant B Data is divided into 100 sec bins |
 |
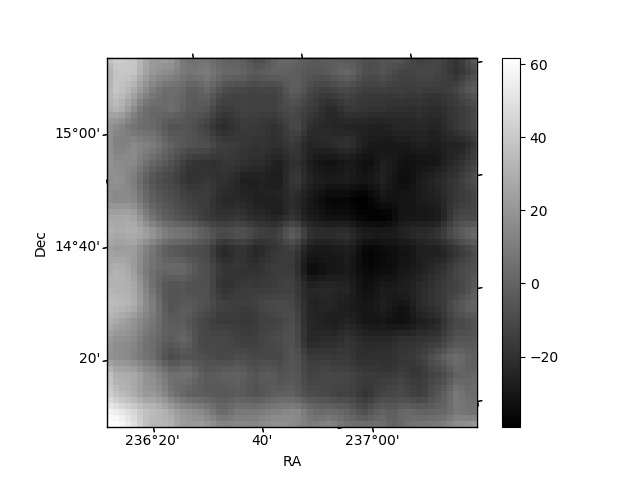 |
| Module-wise count rates for Quadrant C Data is divided into 100 sec bins |
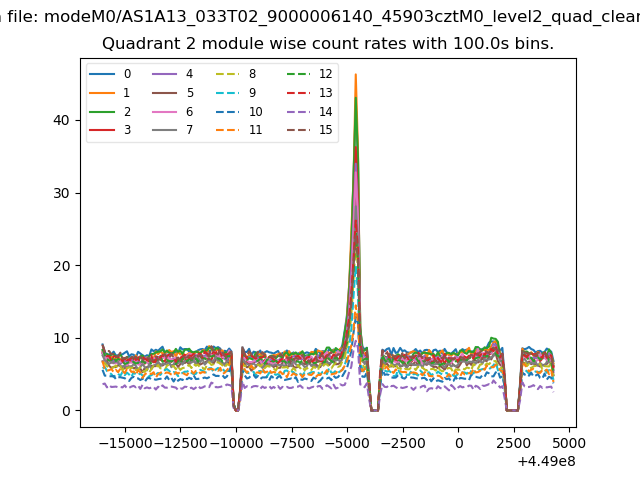 |
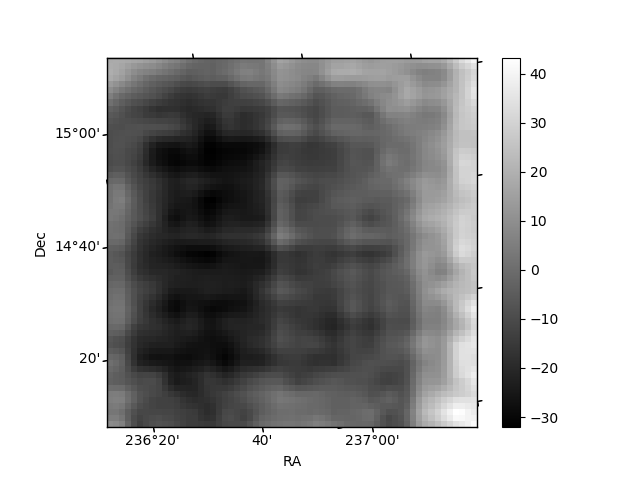 |
| Module-wise count rates for Quadrant D Data is divided into 100 sec bins |
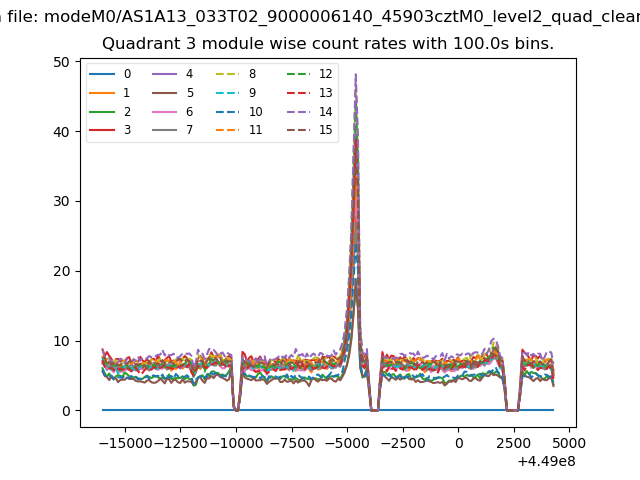 |
 |
| Parameter | Plot |
|---|---|
| CZT HV Monitor | 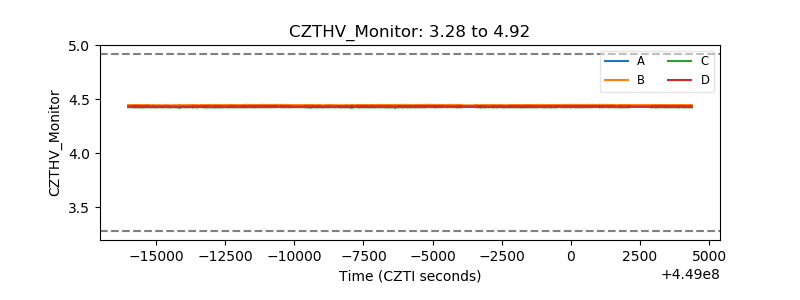 |
| D_VDD | 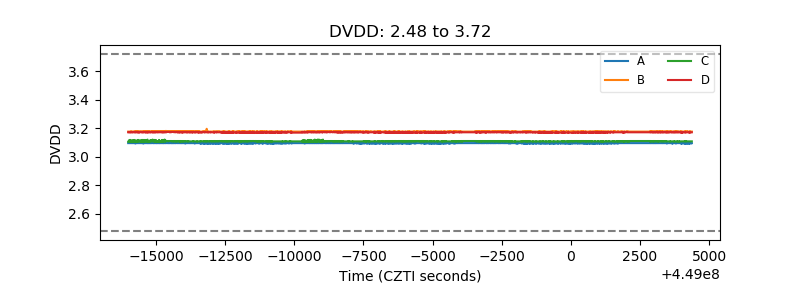 |
| Temperature 1 | 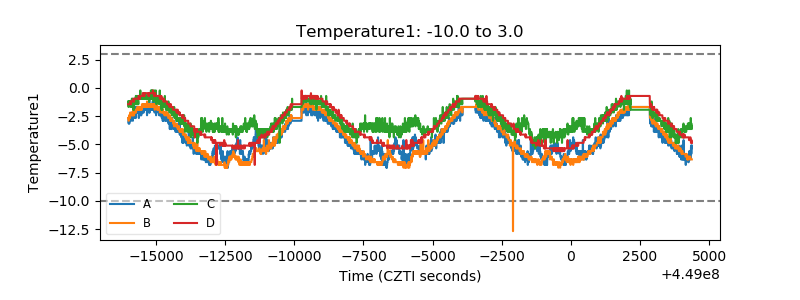 |
| Veto HV Monitor | 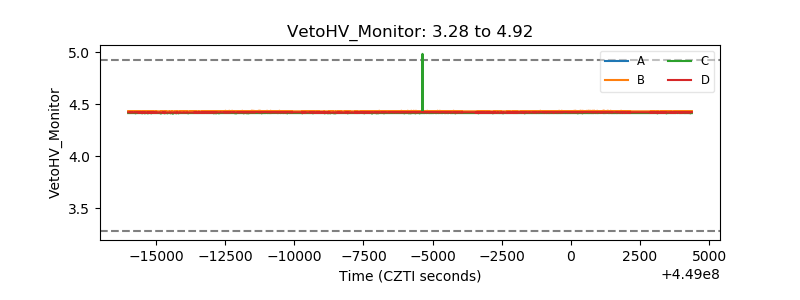 |
| Veto LLD | 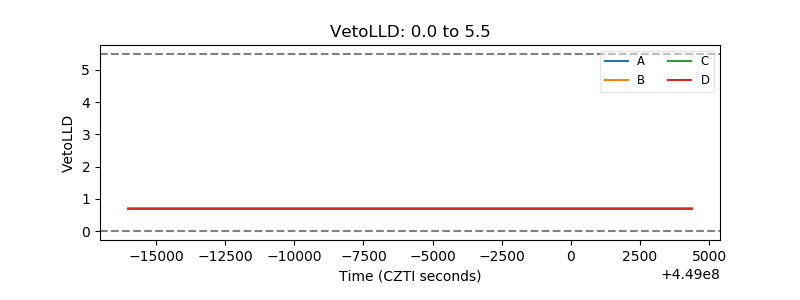 |
| Alpha Counter | 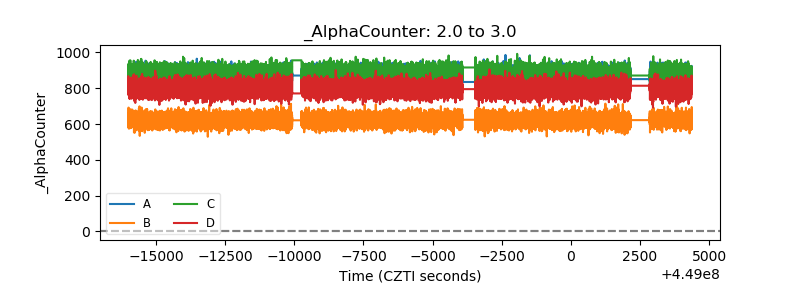 |
| _CPM_Rate | 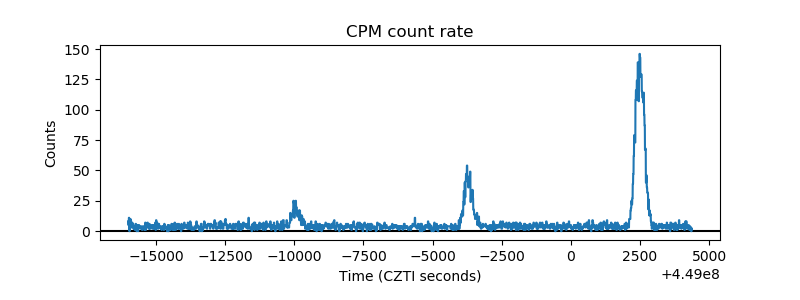 |
| CZT Counter | 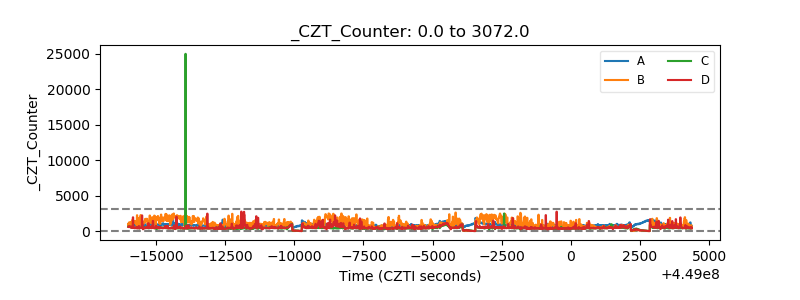 |
| +2.5 Volts monitor | 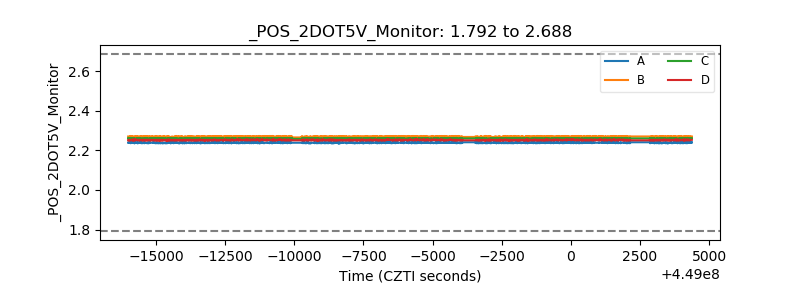 |
| +5 Volts monitor |  |
| _ROLL_ROT | 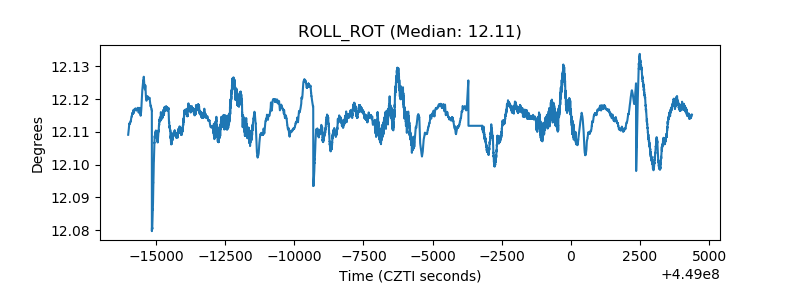 |
| _Roll_DEC | 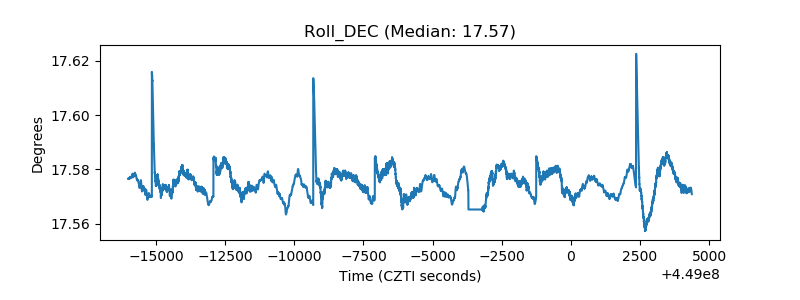 |
| _Roll_RA | 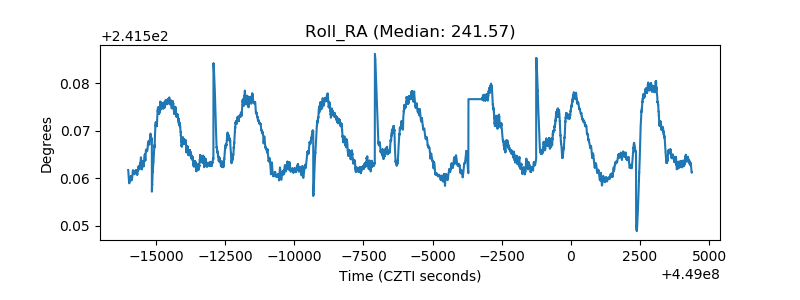 |
| Veto Counter | 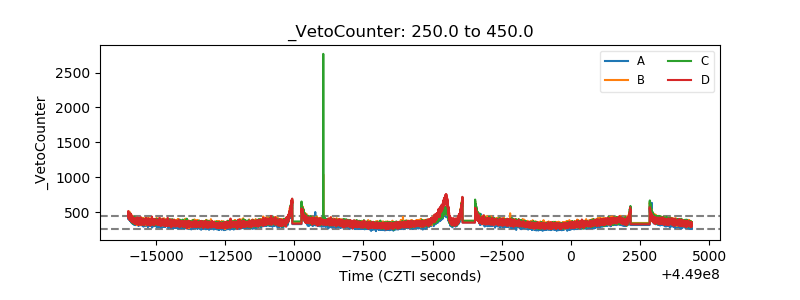 |