| Param | Original file | Final file |
|---|---|---|
| Filename | modeM0/AS1A13_033T02_9000006140_45907cztM0_level2.fits | modeM0/AS1A13_033T02_9000006140_45907cztM0_level2_quad_clean.evt |
| Size (bytes) | 476,956,800 | 106,784,640 |
| Size | 454.9 MB | 101.8 MB |
| Events in quadrant A | 5,680,821 | 699,821 |
| Events in quadrant B | 4,017,202 | 735,301 |
| Events in quadrant C | 2,937,668 | 713,164 |
| Events in quadrant D | 4,514,963 | 631,377 |
| Mode M9 | |||
|---|---|---|---|
| Quadrant | BADHDUFLAG | Total packets | Discarded packets |
| A | 0 | 20 | 0 |
| B | 0 | 21 | 0 |
| C | 0 | 21 | 0 |
| D | 0 | 21 | 0 |
| Mode SS | |||
|---|---|---|---|
| Quadrant | BADHDUFLAG | Total packets | Discarded packets |
| A | 0 | 134 | 0 |
| B | 0 | 134 | 0 |
| C | 0 | 134 | 0 |
| D | 0 | 134 | 0 |
| Mode M0 | |||
|---|---|---|---|
| Quadrant | BADHDUFLAG | Total packets | Discarded packets |
| A | 0 | 21508 | 2 |
| B | 0 | 16375 | 2 |
| C | 0 | 13702 | 2 |
| D | 0 | 18195 | 2 |
| Quadrant | Total seconds | Saturated seconds | Saturation percentage |
|---|---|---|---|
| A | 6507 | 183 | 2.812356% |
| B | 6507 | 110 | 1.690487% |
| C | 6507 | 22 | 0.338097% |
| D | 6507 | 292 | 4.487475% |
Noise dominated data is calculated using 1-second bins in cleaned event files. If a bin has >2000 counts, and if more than 50% of those come from <1% of pixels, then it is considered to be noise-dominated and hence unusable.
| Quadrant | # 1 sec bins | Bins with >0 counts | Bins with >2000 counts | High rate bins dominated by noise | Noise dominated (total time) | Noise dominated (detector-on time) | Marked lightcurve |
|---|---|---|---|---|---|---|---|
| A | 7592 | 6508 | 56 | 56 | 0.74% | 0.86% | 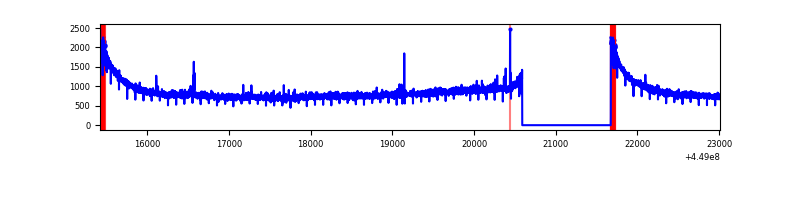 |
| B | 7592 | 6507 | 36 | 36 | 0.47% | 0.55% | 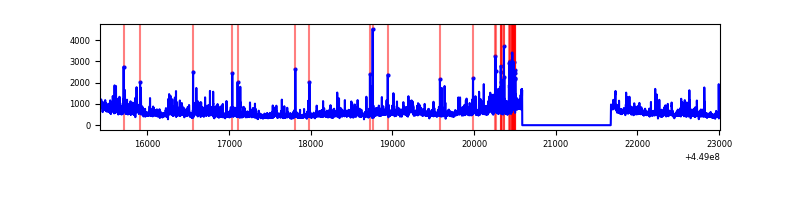 |
| C | 7592 | 6508 | 2 | 2 | 0.03% | 0.03% | 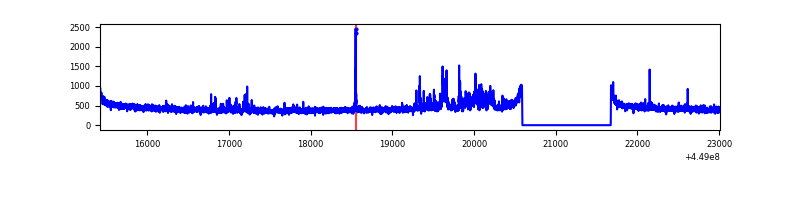 |
| D | 7592 | 6508 | 265 | 265 | 3.49% | 4.07% | 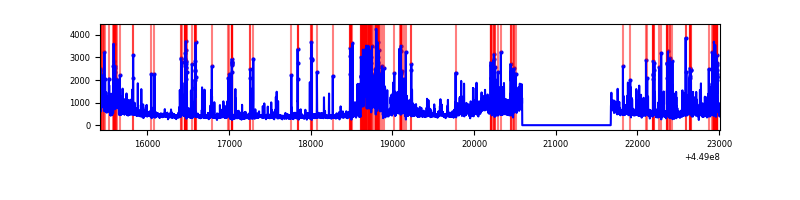 |
Top three noisy pixels from each quadrant. If the there are fewer than three noisy pixels in the level2.evt file, extra rows are filled as -1
| Pixel properties | Quadrant properties | ||||||
|---|---|---|---|---|---|---|---|
| Quadrant | DetID | PixID | Counts | Sigma | Mean | Median | Sigma |
| A | 10 | 83 | 2951606 | 20256.91 | 696 | 681 | 145.7 |
| A | 7 | 3 | 27670 | 185.27 | 696 | 681 | 145.7 |
| A | 0 | 243 | 8535 | 53.91 | 696 | 681 | 145.7 |
| B | 3 | 112 | 1122241 | 8143.11 | 702 | 681 | 137.7 |
| B | 0 | 245 | 36964 | 263.43 | 702 | 681 | 137.7 |
| B | 4 | 171 | 31045 | 220.46 | 702 | 681 | 137.7 |
| C | 2 | 14 | 190204 | 1156.68 | 695 | 702 | 163.8 |
| C | 10 | 20 | 27578 | 164.04 | 695 | 702 | 163.8 |
| C | 3 | 233 | 6851 | 37.53 | 695 | 702 | 163.8 |
| D | 1 | 52 | 1198019 | 7017.48 | 676 | 653 | 170.6 |
| D | 13 | 249 | 211293 | 1234.51 | 676 | 653 | 170.6 |
| D | 13 | 138 | 156036 | 910.66 | 676 | 653 | 170.6 |
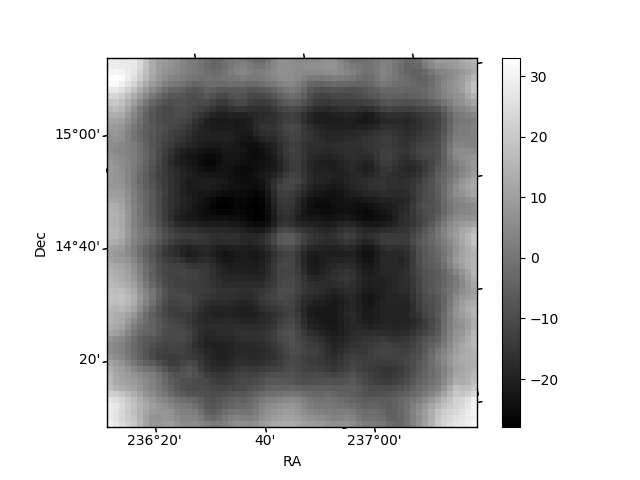
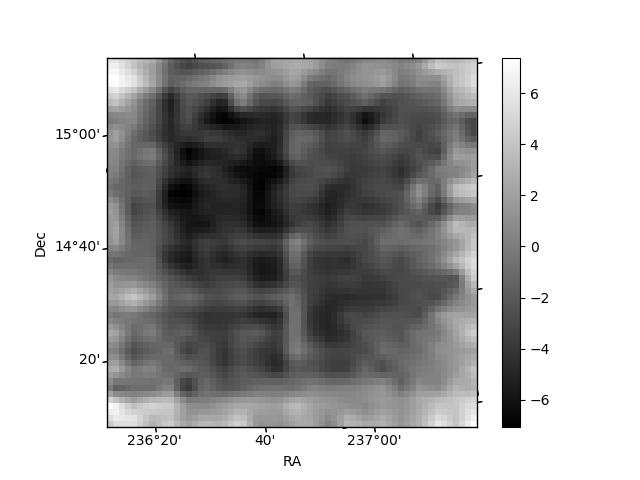
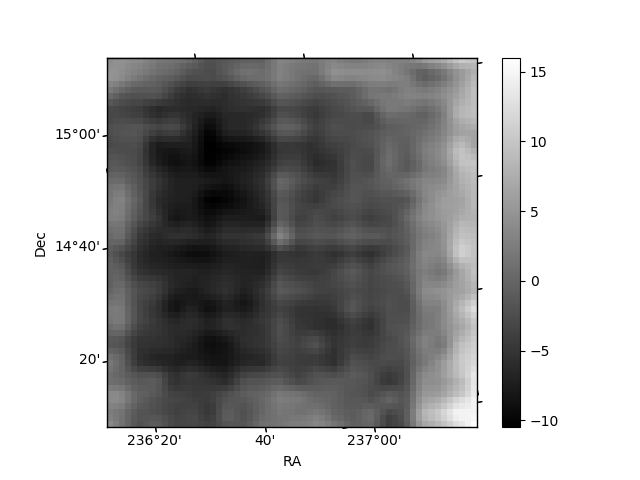
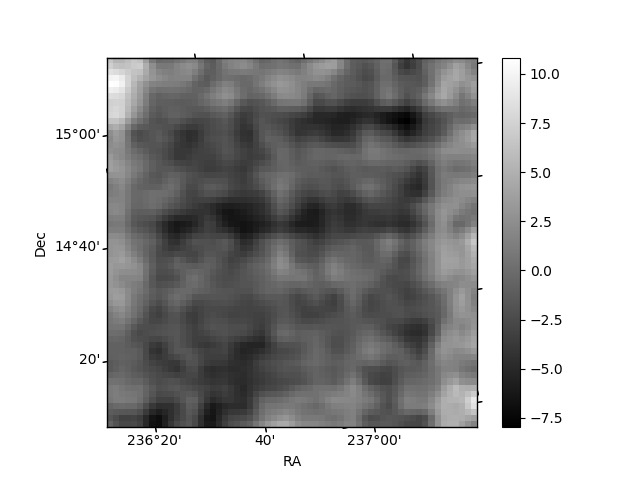
Histogram calculated using DETX and DETY for each event in the final _common_clean file
| Quadrant A | 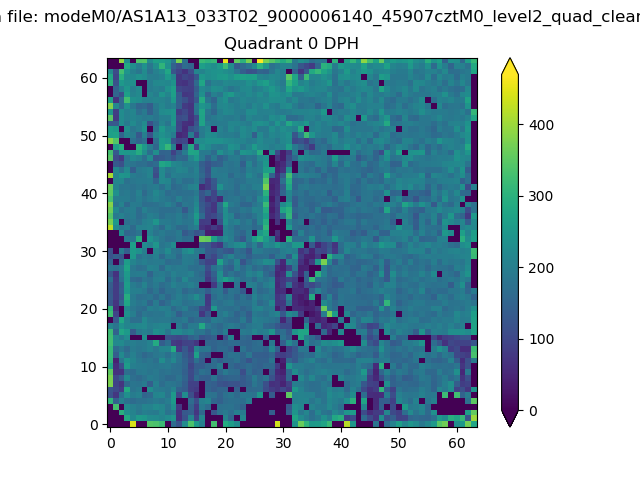 |
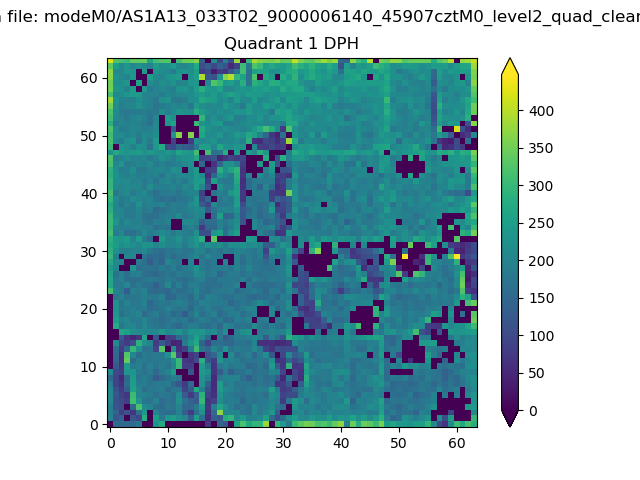 |
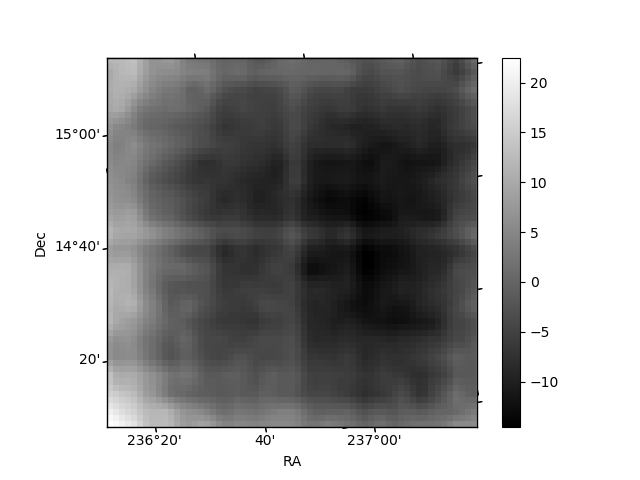
Quadrant B |
|---|---|---|---|
| Quadrant D | 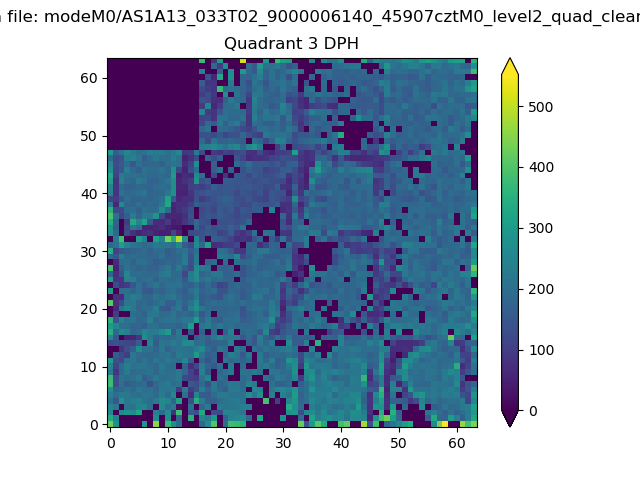 |
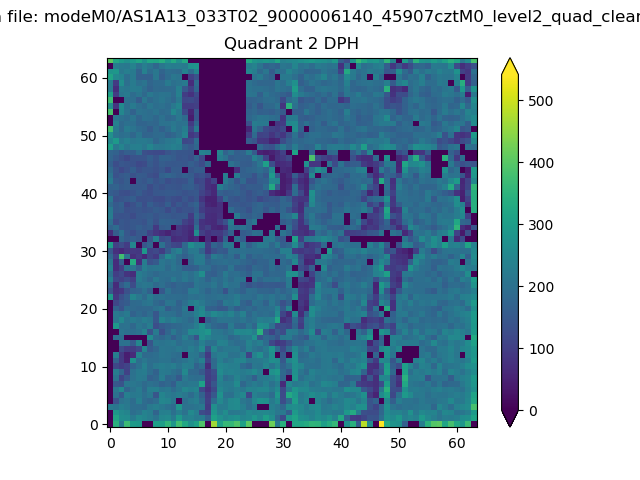 |
Quadrant C |
| Plot type | Count rate plots | Images |
|---|---|---|
| Comparison with Poisson distribution Blue bars denote a histogram of data divided into 1 sec bins. Red curve is a Poisson curve with rate = median count rate of data. |
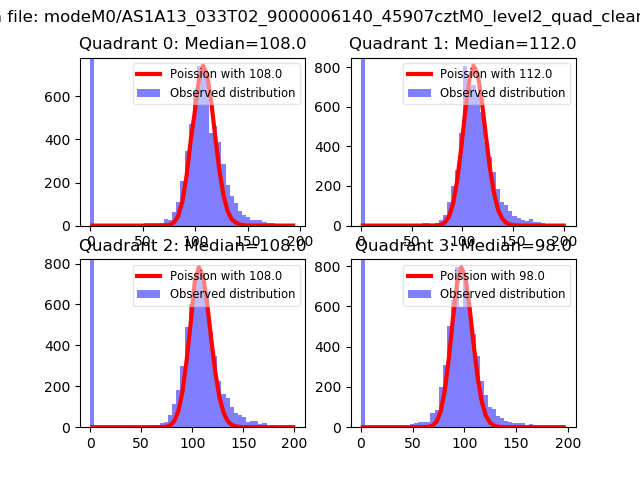 |
 |
| Quadrant-wise count rates Data is divided into 100 sec bins |
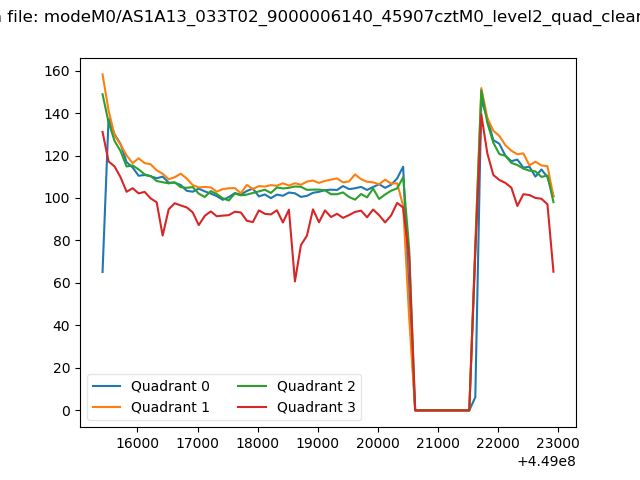 |
|
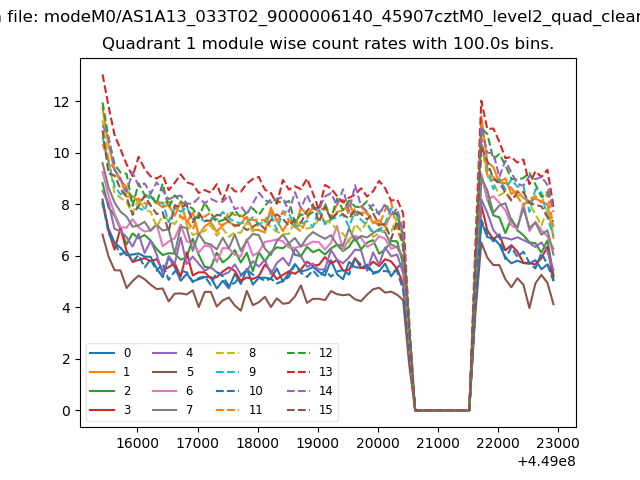
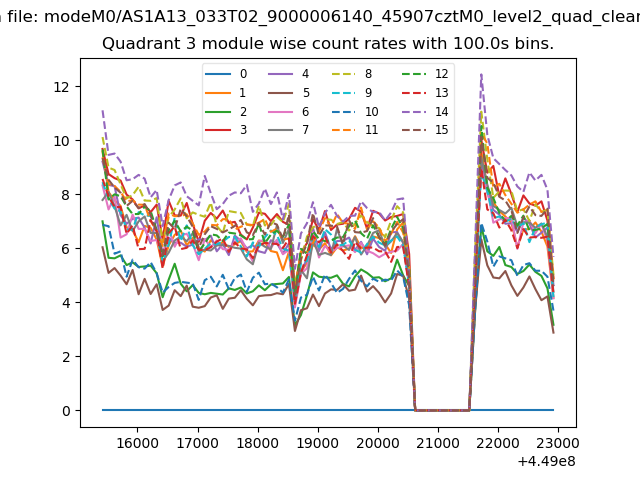
| Module-wise count rates for Quadrant A Data is divided into 100 sec bins |
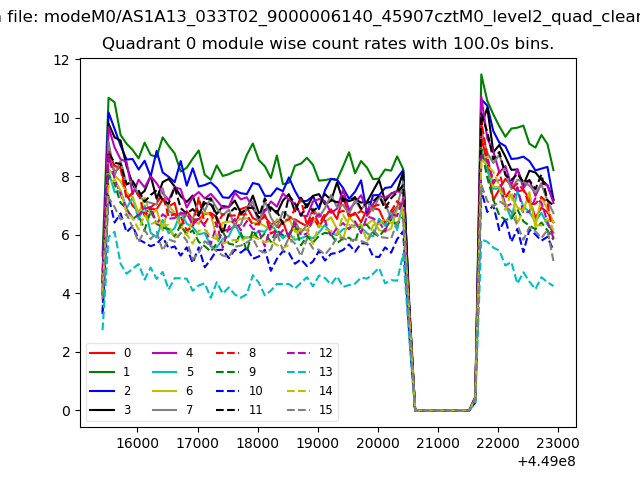 |
 |
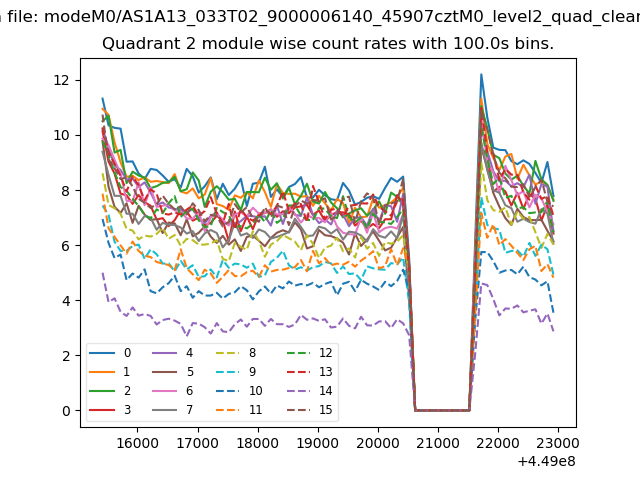
| Module-wise count rates for Quadrant B Data is divided into 100 sec bins |
 |
 |
| Module-wise count rates for Quadrant C Data is divided into 100 sec bins |
 |
 |
| Module-wise count rates for Quadrant D Data is divided into 100 sec bins |
 |
 |
| Parameter | Plot |
|---|---|
| CZT HV Monitor |  |
| D_VDD | 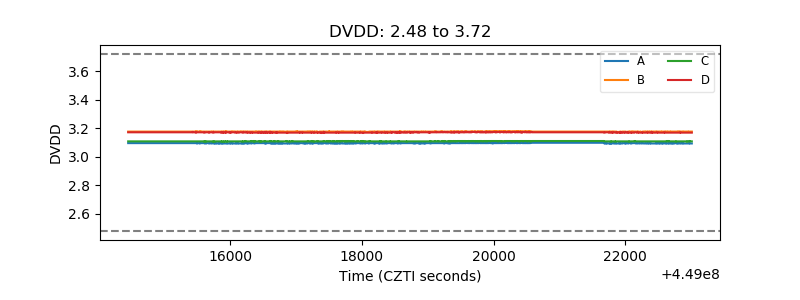 |
| Temperature 1 | 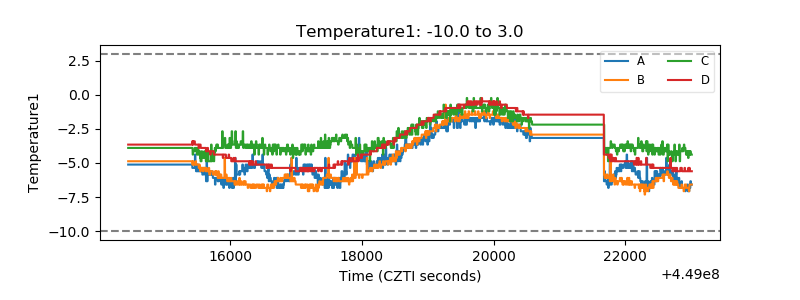 |
| Veto HV Monitor | 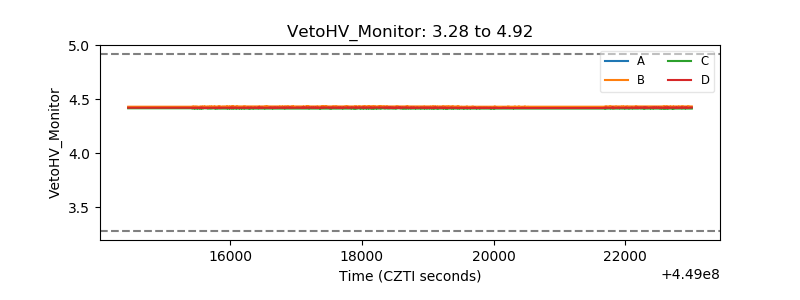 |
| Veto LLD | 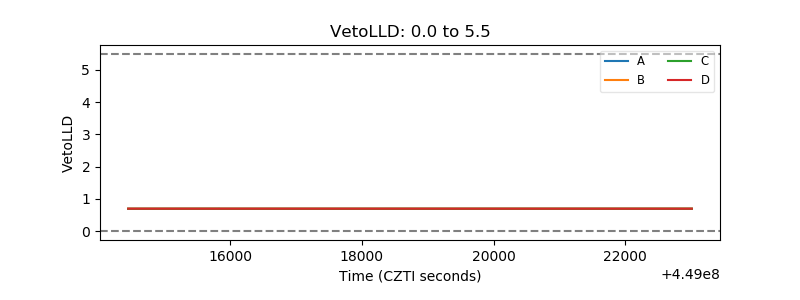 |
| Alpha Counter | 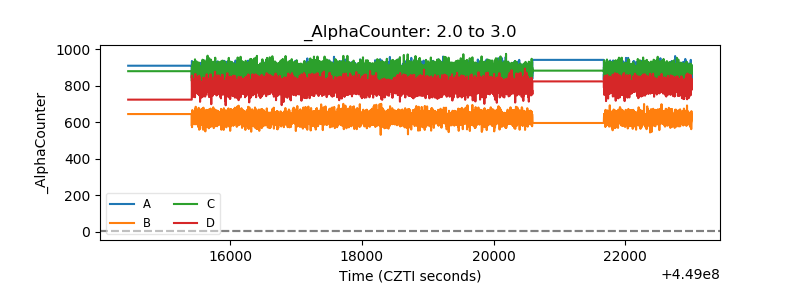 |
| _CPM_Rate | 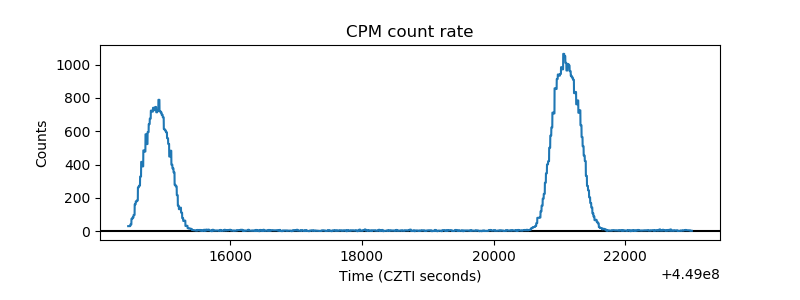 |
| CZT Counter | 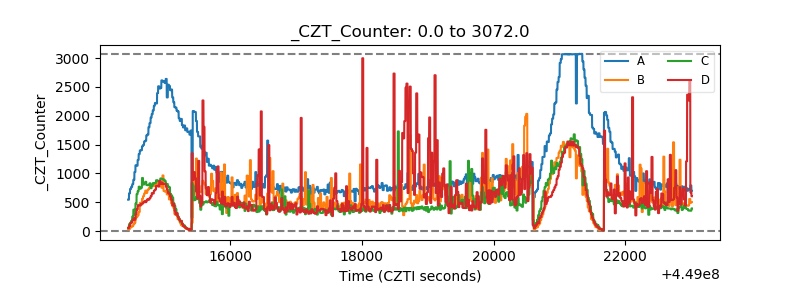 |
| +2.5 Volts monitor | 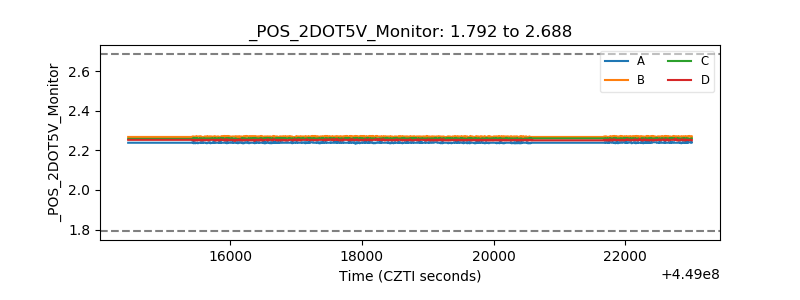 |
| +5 Volts monitor | 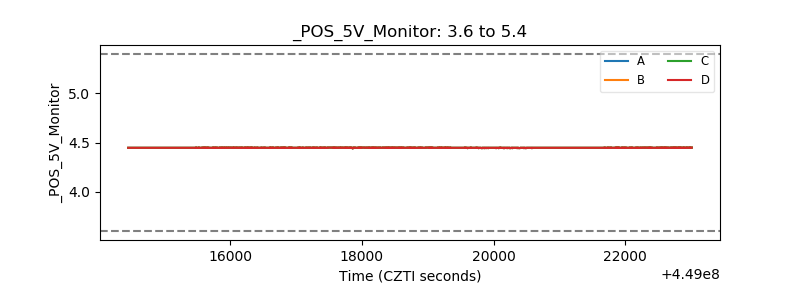 |
| _ROLL_ROT | 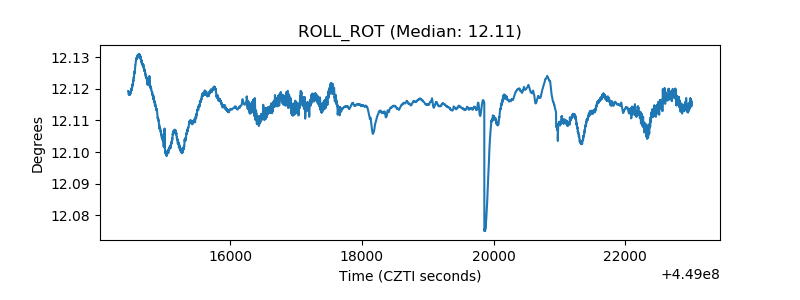 |
| _Roll_DEC | 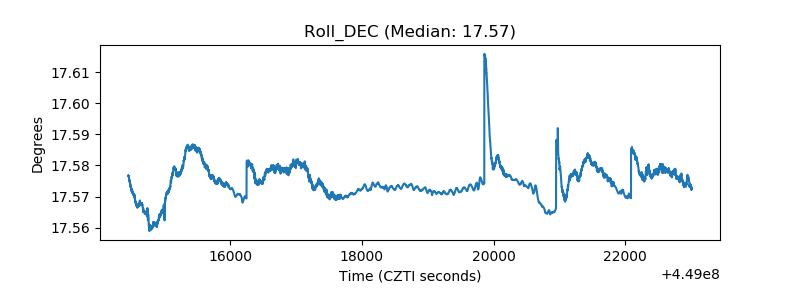 |
| _Roll_RA | 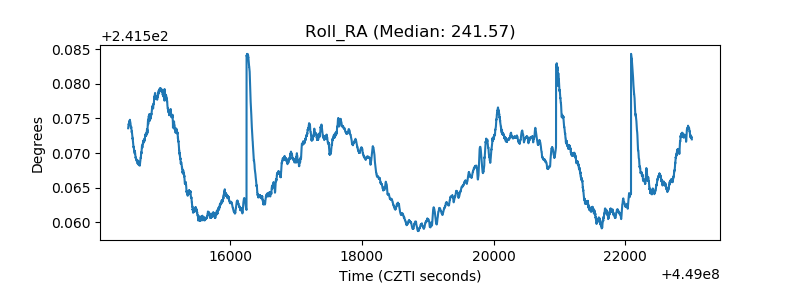 |
| Veto Counter | 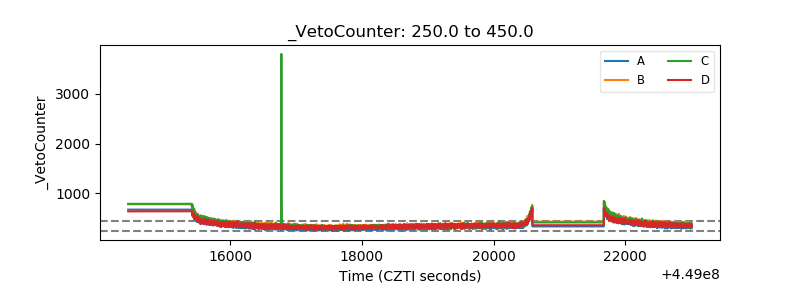 |