| Param | Original file | Final file |
|---|---|---|
| Filename | modeM0/AS1A13_071T03_9000006142_45909cztM0_level2.fits | modeM0/AS1A13_071T03_9000006142_45909cztM0_level2_quad_clean.evt |
| Size (bytes) | 661,458,240 | 113,463,360 |
| Size | 630.8 MB | 108.2 MB |
| Events in quadrant A | 6,134,334 | 757,986 |
| Events in quadrant B | 5,726,150 | 775,364 |
| Events in quadrant C | 6,960,483 | 760,389 |
| Events in quadrant D | 5,135,682 | 664,738 |
| Mode M0 | |||
|---|---|---|---|
| Quadrant | BADHDUFLAG | Total packets | Discarded packets |
| A | 0 | 23163 | 2 |
| B | 0 | 21646 | 2 |
| C | 0 | 25495 | 2 |
| D | 0 | 19958 | 2 |
| Mode M9 | |||
|---|---|---|---|
| Quadrant | BADHDUFLAG | Total packets | Discarded packets |
| A | 0 | 12 | 0 |
| B | 0 | 13 | 0 |
| C | 0 | 13 | 0 |
| D | 0 | 13 | 0 |
| Mode SS | |||
|---|---|---|---|
| Quadrant | BADHDUFLAG | Total packets | Discarded packets |
| A | 0 | 140 | 0 |
| B | 0 | 140 | 0 |
| C | 0 | 140 | 0 |
| D | 0 | 140 | 0 |
| Quadrant | Total seconds | Saturated seconds | Saturation percentage |
|---|---|---|---|
| A | 6843 | 244 | 3.565688% |
| B | 6843 | 455 | 6.649130% |
| C | 6843 | 290 | 4.237907% |
| D | 6843 | 539 | 7.876662% |
Noise dominated data is calculated using 1-second bins in cleaned event files. If a bin has >2000 counts, and if more than 50% of those come from <1% of pixels, then it is considered to be noise-dominated and hence unusable.
| Quadrant | # 1 sec bins | Bins with >0 counts | Bins with >2000 counts | High rate bins dominated by noise | Noise dominated (total time) | Noise dominated (detector-on time) | Marked lightcurve |
|---|---|---|---|---|---|---|---|
| A | 8008 | 6844 | 82 | 82 | 1.02% | 1.20% | 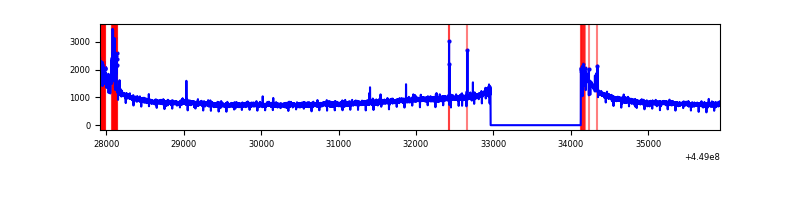 |
| B | 8008 | 6844 | 215 | 215 | 2.68% | 3.14% | 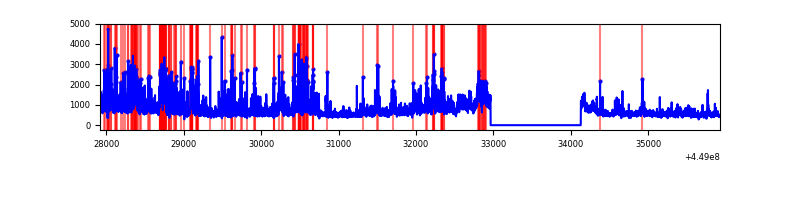 |
| C | 8008 | 6844 | 227 | 227 | 2.83% | 3.32% | 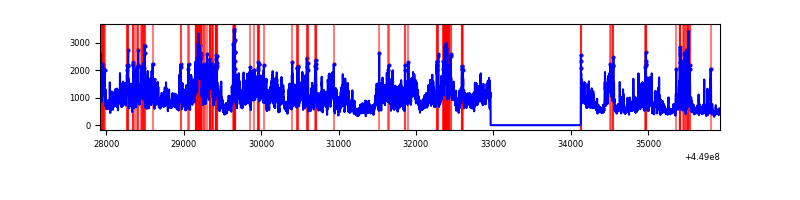 |
| D | 8008 | 6844 | 445 | 445 | 5.56% | 6.50% | 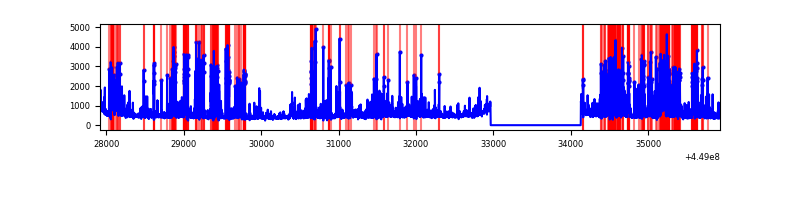 |
Top three noisy pixels from each quadrant. If the there are fewer than three noisy pixels in the level2.evt file, extra rows are filled as -1
| Pixel properties | Quadrant properties | ||||||
|---|---|---|---|---|---|---|---|
| Quadrant | DetID | PixID | Counts | Sigma | Mean | Median | Sigma |
| A | 10 | 83 | 3098431 | 19708.6 | 758 | 742 | 157.2 |
| A | 0 | 247 | 70605 | 444.49 | 758 | 742 | 157.2 |
| A | 13 | 252 | 13304 | 79.92 | 758 | 742 | 157.2 |
| B | 3 | 112 | 2572765 | 17399.35 | 759 | 735 | 147.8 |
| B | 0 | 245 | 47603 | 317.05 | 759 | 735 | 147.8 |
| B | 2 | 2 | 24972 | 163.96 | 759 | 735 | 147.8 |
| C | 4 | 254 | 3797990 | 21153.42 | 761 | 767 | 179.5 |
| C | 14 | 254 | 169894 | 942.16 | 761 | 767 | 179.5 |
| C | 12 | 2 | 17345 | 92.35 | 761 | 767 | 179.5 |
| D | 13 | 249 | 1257501 | 6778.22 | 737 | 714 | 185.4 |
| D | 1 | 52 | 380355 | 2047.52 | 737 | 714 | 185.4 |
| D | 2 | 249 | 368327 | 1982.64 | 737 | 714 | 185.4 |
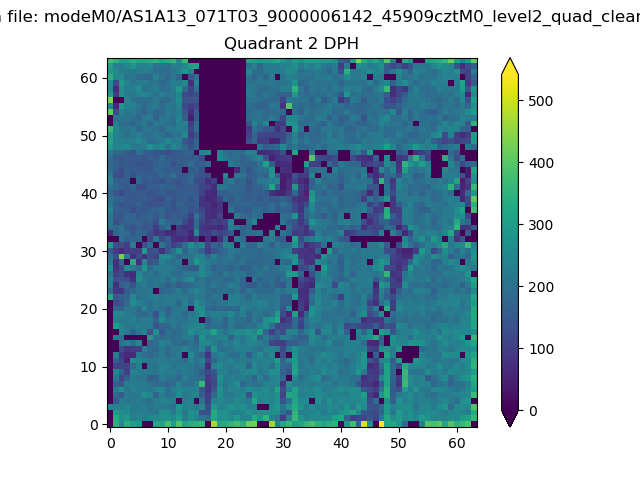
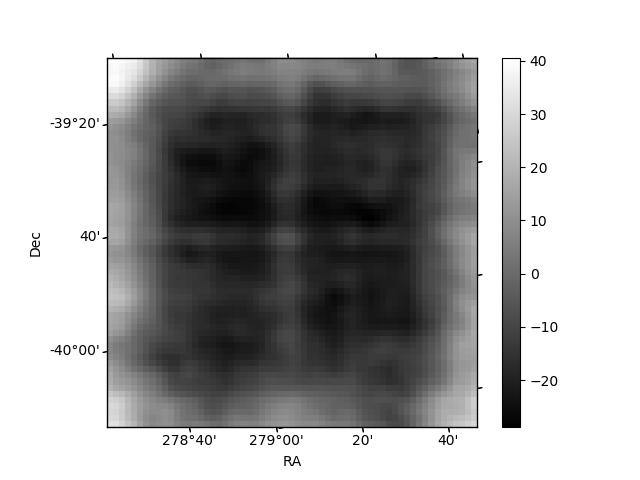
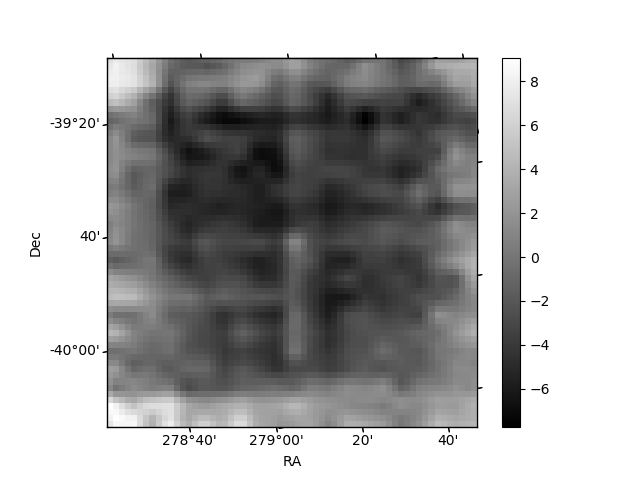
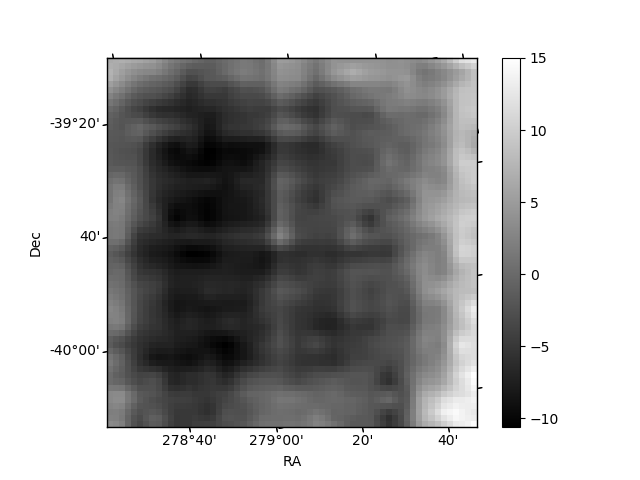
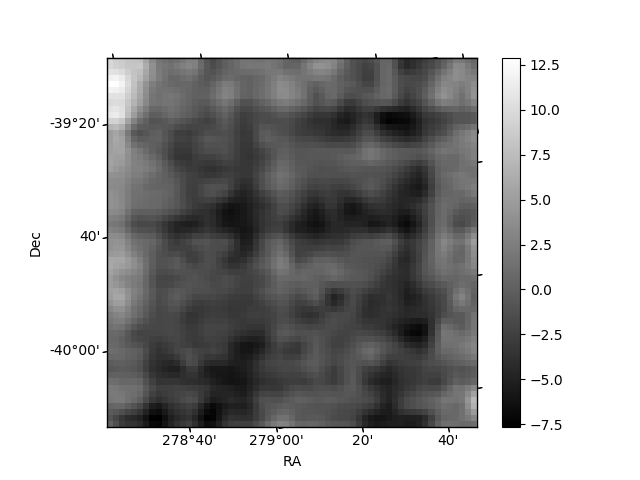
Histogram calculated using DETX and DETY for each event in the final _common_clean file
| Quadrant A | 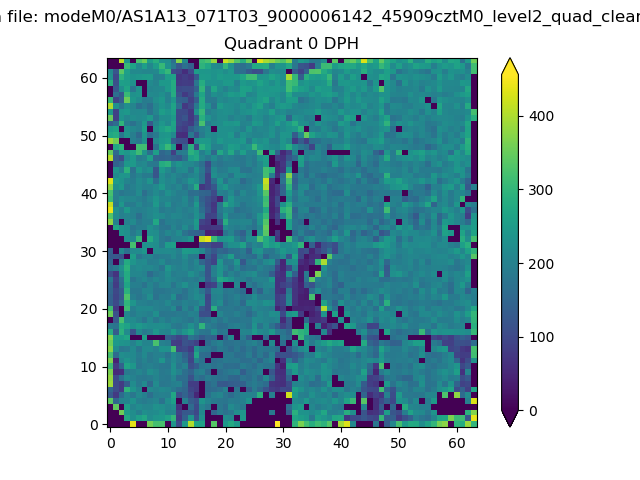 |
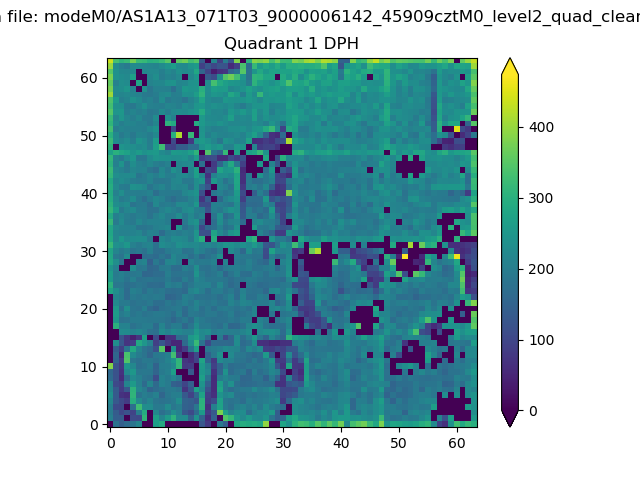 |
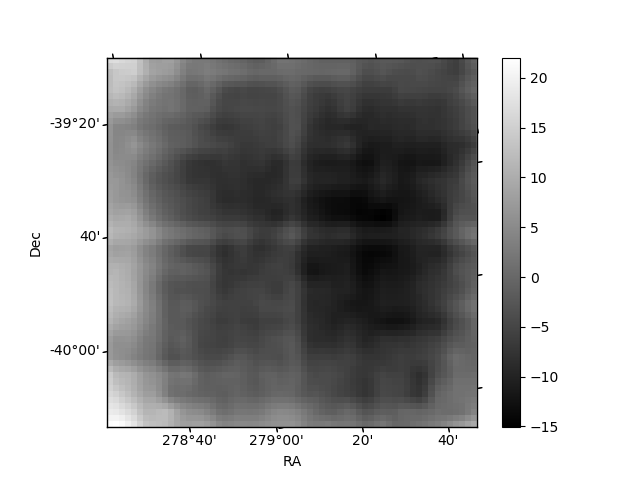
Quadrant B |
|---|---|---|---|
| Quadrant D | 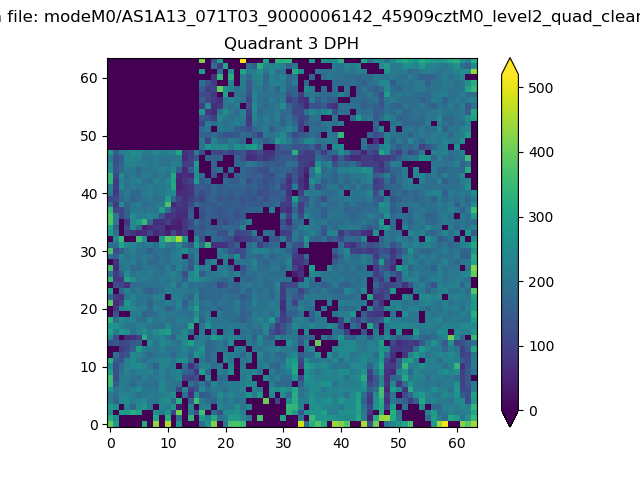 |
 |
Quadrant C |
| Plot type | Count rate plots | Images |
|---|---|---|
| Comparison with Poisson distribution Blue bars denote a histogram of data divided into 1 sec bins. Red curve is a Poisson curve with rate = median count rate of data. |
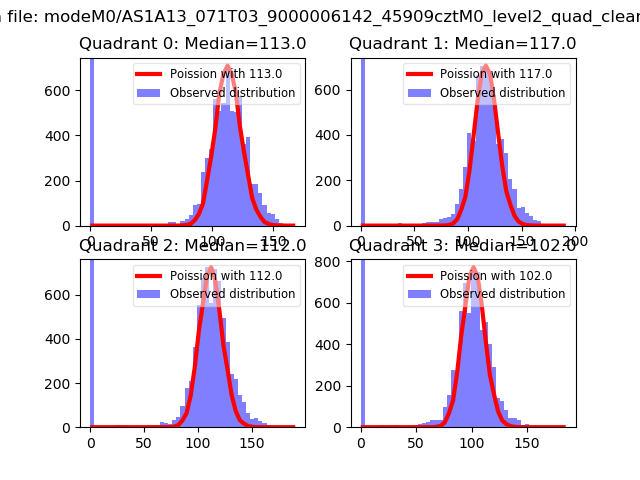 |
 |
| Quadrant-wise count rates Data is divided into 100 sec bins |
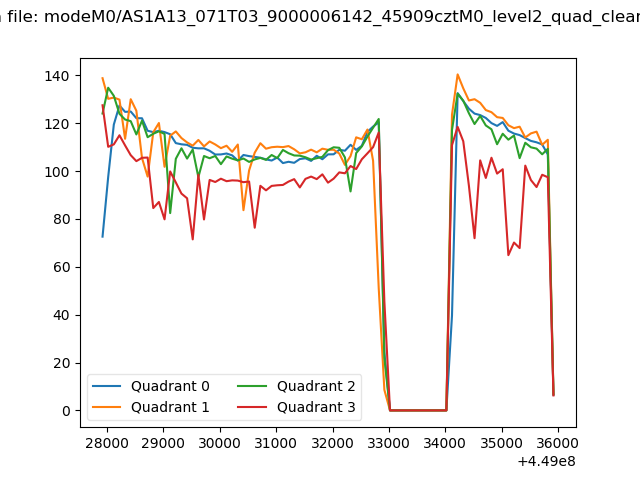 |
|
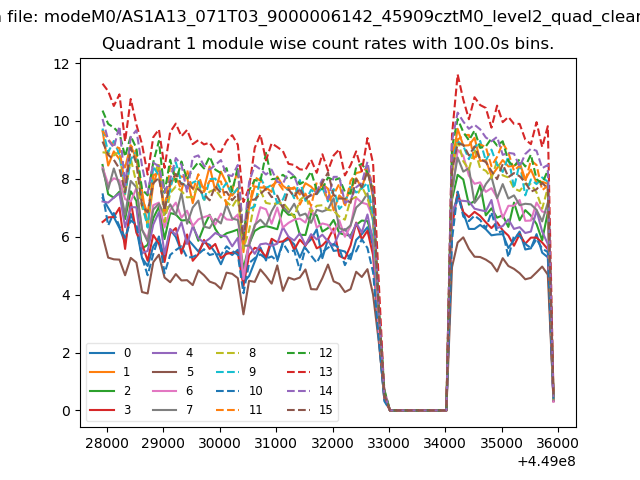
| Module-wise count rates for Quadrant A Data is divided into 100 sec bins |
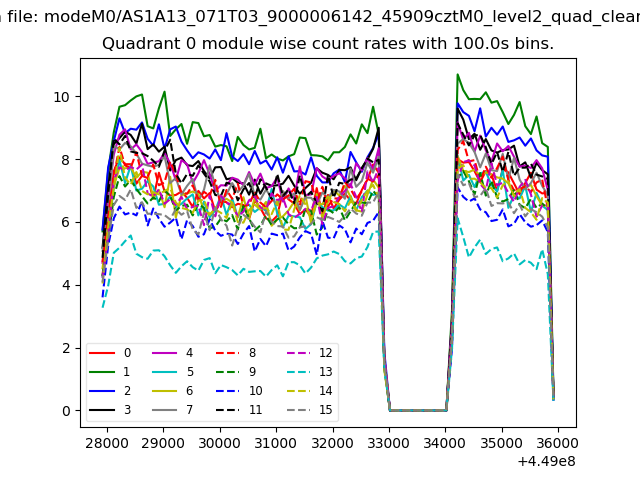 |
 |
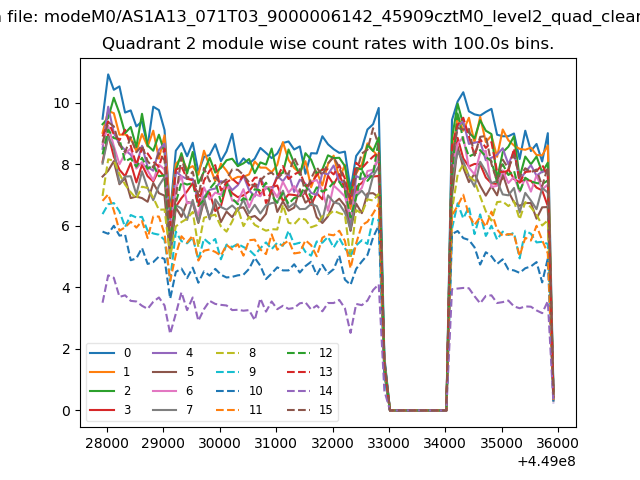
| Module-wise count rates for Quadrant B Data is divided into 100 sec bins |
 |
 |
| Module-wise count rates for Quadrant C Data is divided into 100 sec bins |
 |
 |
| Module-wise count rates for Quadrant D Data is divided into 100 sec bins |
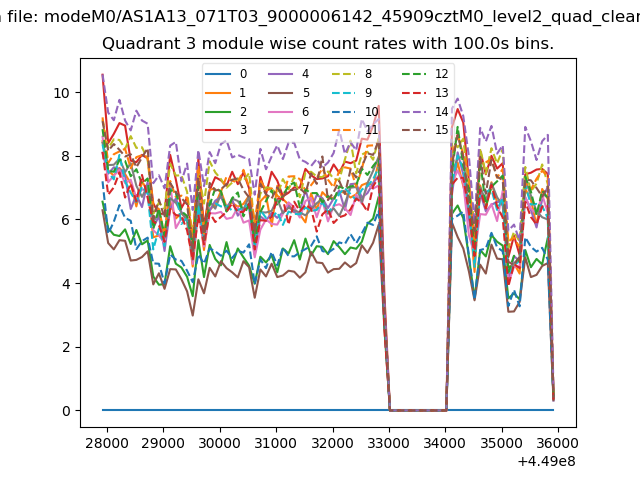 |
 |
| Parameter | Plot |
|---|---|
| CZT HV Monitor | 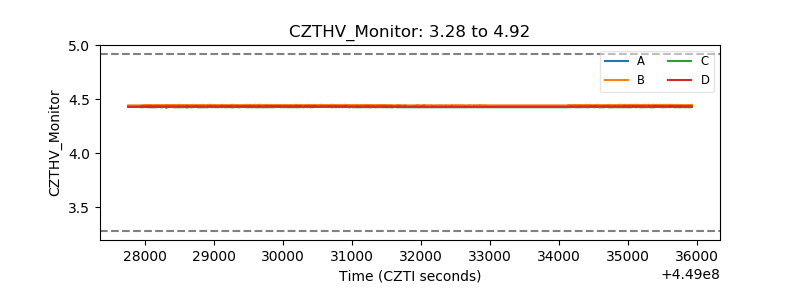 |
| D_VDD | 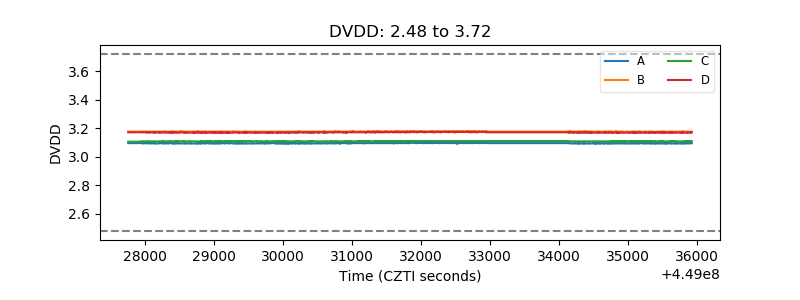 |
| Temperature 1 | 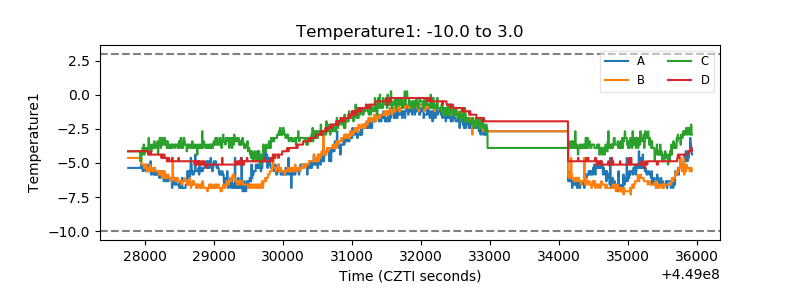 |
| Veto HV Monitor | 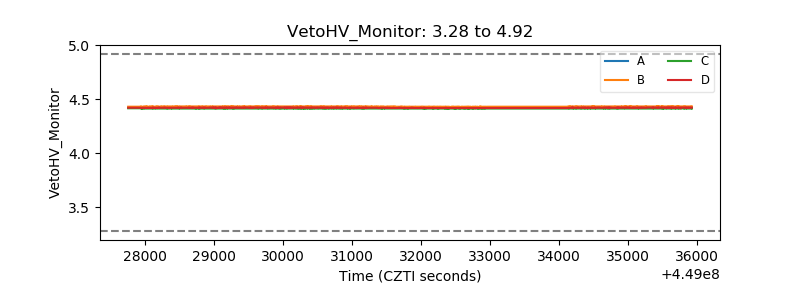 |
| Veto LLD | 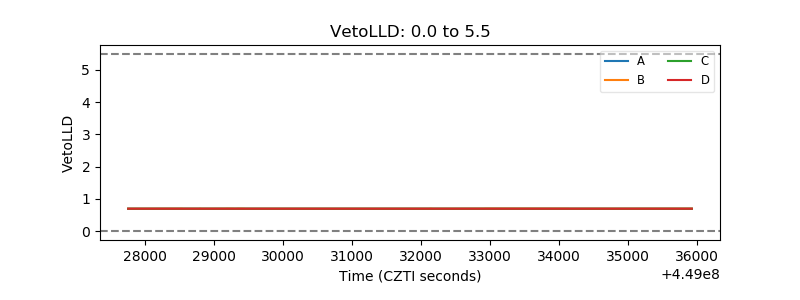 |
| Alpha Counter | 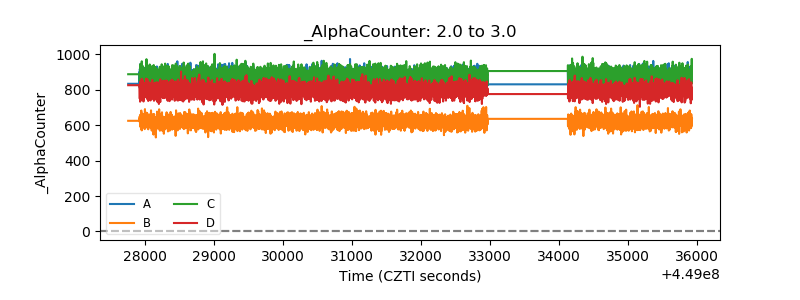 |
| _CPM_Rate | 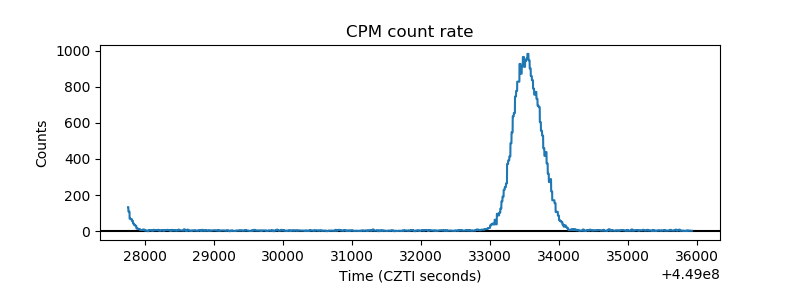 |
| CZT Counter | 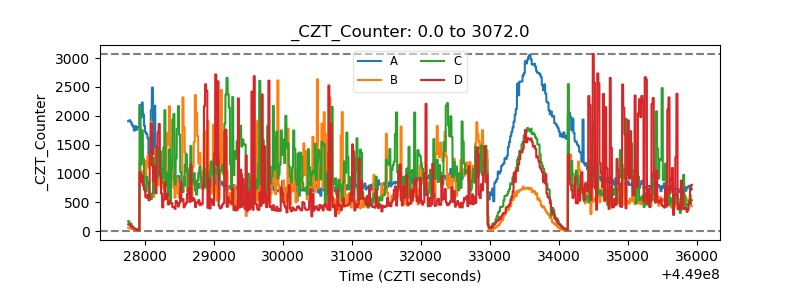 |
| +2.5 Volts monitor | 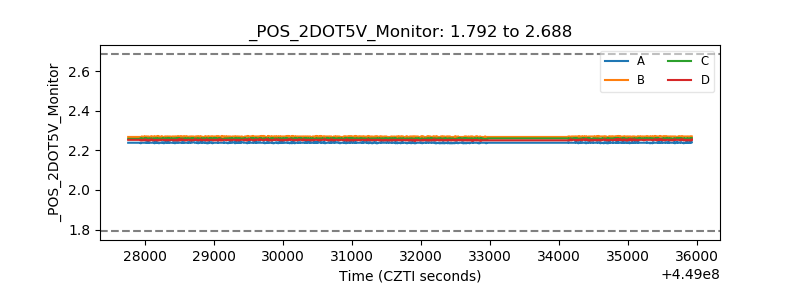 |
| +5 Volts monitor | 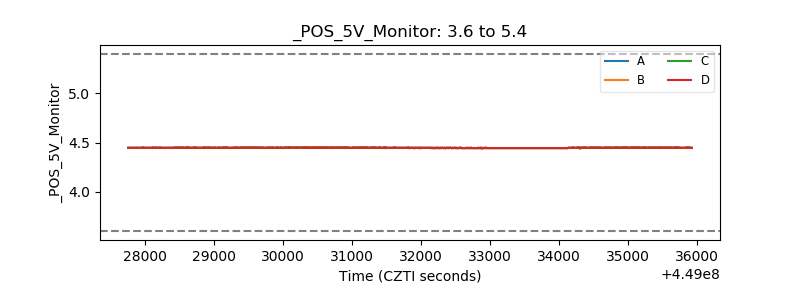 |
| _ROLL_ROT | 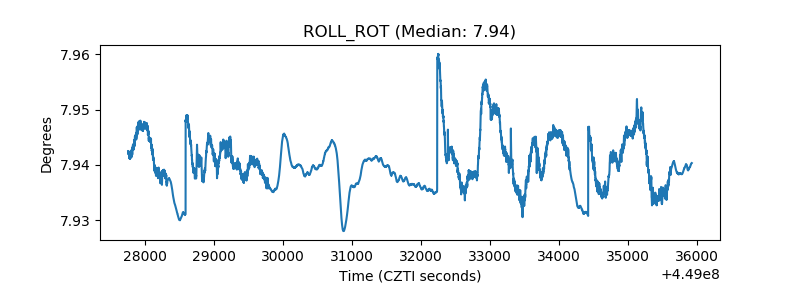 |
| _Roll_DEC | 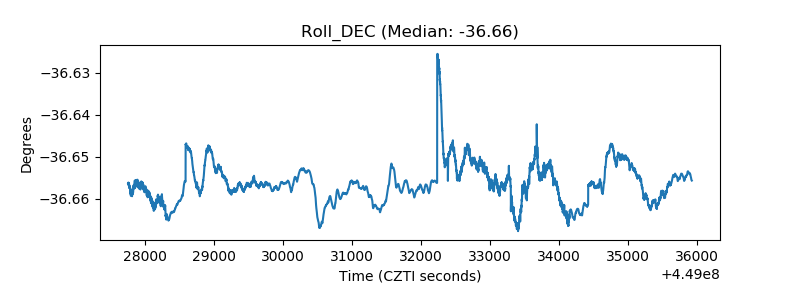 |
| _Roll_RA | 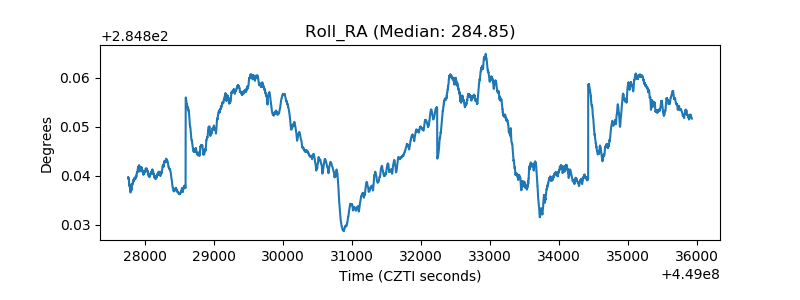 |
| Veto Counter | 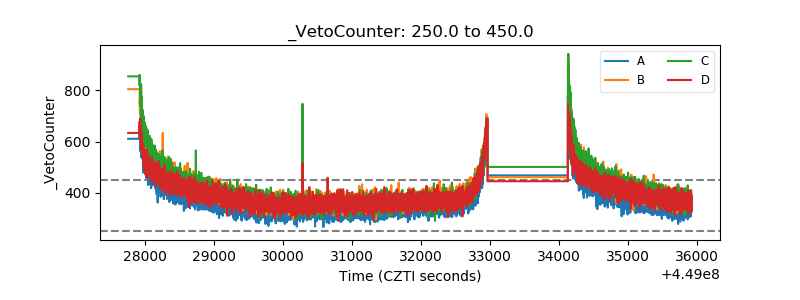 |