| Param | Original file | Final file |
|---|---|---|
| Filename | modeM0/AS1A13_077T01_9000006168_46089cztM0_level2.fits | modeM0/AS1A13_077T01_9000006168_46089cztM0_level2_quad_clean.evt |
| Size (bytes) | 342,236,160 | 80,933,760 |
| Size | 326.4 MB | 77.2 MB |
| Events in quadrant A | 4,182,745 | 537,936 |
| Events in quadrant B | 2,423,687 | 552,034 |
| Events in quadrant C | 2,239,598 | 531,429 |
| Events in quadrant D | 3,423,740 | 469,880 |
| Mode M0 | |||
|---|---|---|---|
| Quadrant | BADHDUFLAG | Total packets | Discarded packets |
| A | 0 | 15433 | 2 |
| B | 0 | 10613 | 0 |
| C | 0 | 10448 | 0 |
| D | 0 | 13709 | 0 |
| Mode SS | |||
|---|---|---|---|
| Quadrant | BADHDUFLAG | Total packets | Discarded packets |
| A | 0 | 104 | 0 |
| B | 0 | 104 | 0 |
| C | 0 | 104 | 0 |
| D | 0 | 104 | 0 |
| Quadrant | Total seconds | Saturated seconds | Saturation percentage |
|---|---|---|---|
| A | 5120 | 9 | 0.175781% |
| B | 5121 | 21 | 0.410076% |
| C | 5121 | 14 | 0.273384% |
| D | 5121 | 219 | 4.276508% |
Noise dominated data is calculated using 1-second bins in cleaned event files. If a bin has >2000 counts, and if more than 50% of those come from <1% of pixels, then it is considered to be noise-dominated and hence unusable.
| Quadrant | # 1 sec bins | Bins with >0 counts | Bins with >2000 counts | High rate bins dominated by noise | Noise dominated (total time) | Noise dominated (detector-on time) | Marked lightcurve |
|---|---|---|---|---|---|---|---|
| A | 5120 | 5120 | 0 | 0 | 0.00% | 0.00% |  |
| B | 5121 | 5121 | 9 | 9 | 0.18% | 0.18% |  |
| C | 5121 | 5121 | 6 | 6 | 0.12% | 0.12% |  |
| D | 5121 | 5121 | 212 | 212 | 4.14% | 4.14% |  |
Top three noisy pixels from each quadrant. If the there are fewer than three noisy pixels in the level2.evt file, extra rows are filled as -1
| Pixel properties | Quadrant properties | ||||||
|---|---|---|---|---|---|---|---|
| Quadrant | DetID | PixID | Counts | Sigma | Mean | Median | Sigma |
| A | 10 | 83 | 2003625 | 16924.64 | 558 | 545 | 118.4 |
| A | 9 | 191 | 17878 | 146.45 | 558 | 545 | 118.4 |
| A | 13 | 254 | 7243 | 56.59 | 558 | 545 | 118.4 |
| B | 0 | 190 | 107047 | 951.96 | 556 | 537 | 111.9 |
| B | 5 | 172 | 60699 | 537.71 | 556 | 537 | 111.9 |
| B | 3 | 112 | 21288 | 185.47 | 556 | 537 | 111.9 |
| C | 14 | 254 | 65279 | 494.42 | 550 | 552 | 130.9 |
| C | 12 | 2 | 25131 | 187.75 | 550 | 552 | 130.9 |
| C | 3 | 233 | 9086 | 65.19 | 550 | 552 | 130.9 |
| D | 1 | 52 | 374547 | 2740.72 | 538 | 522 | 136.5 |
| D | 5 | 235 | 245723 | 1796.74 | 538 | 522 | 136.5 |
| D | 13 | 249 | 234553 | 1714.89 | 538 | 522 | 136.5 |
Histogram calculated using DETX and DETY for each event in the final _common_clean file
| Quadrant A |  |
 |
Quadrant B |
|---|---|---|---|
| Quadrant D |  |
 |
Quadrant C |
| Plot type | Count rate plots | Images |
|---|---|---|
| Comparison with Poisson distribution Blue bars denote a histogram of data divided into 1 sec bins. Red curve is a Poisson curve with rate = median count rate of data. |
 |
 |
| Quadrant-wise count rates Data is divided into 100 sec bins |
 |
|
| Module-wise count rates for Quadrant A Data is divided into 100 sec bins |
 |
 |
| Module-wise count rates for Quadrant B Data is divided into 100 sec bins |
 |
 |
| Module-wise count rates for Quadrant C Data is divided into 100 sec bins |
 |
 |
| Module-wise count rates for Quadrant D Data is divided into 100 sec bins |
 |
 |
| Parameter | Plot |
|---|---|
| CZT HV Monitor |  |
| D_VDD |  |
| Temperature 1 |  |
| Veto HV Monitor |  |
| Veto LLD |  |
| Alpha Counter |  |
| _CPM_Rate |  |
| CZT Counter |  |
| +2.5 Volts monitor | 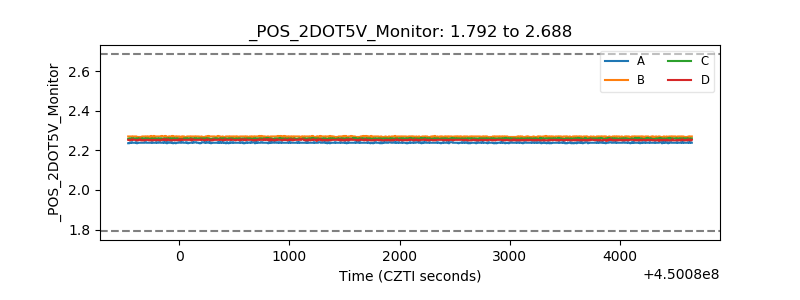 |
| +5 Volts monitor | 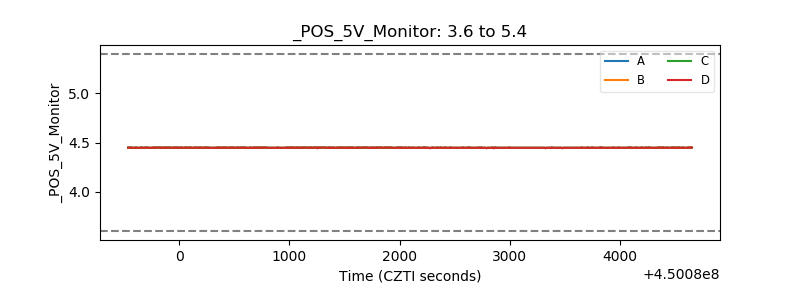 |
| _ROLL_ROT |  |
| _Roll_DEC |  |
| _Roll_RA |  |
| Veto Counter |  |