| Param | Original file | Final file |
|---|---|---|
| Filename | modeM0/AS1A13_098T02_9000006174_46146cztM0_level2.fits | modeM0/AS1A13_098T02_9000006174_46146cztM0_level2_quad_clean.evt |
| Size (bytes) | 608,869,440 | 125,729,280 |
| Size | 580.7 MB | 119.9 MB |
| Events in quadrant A | 7,027,021 | 828,721 |
| Events in quadrant B | 5,474,261 | 862,019 |
| Events in quadrant C | 3,931,123 | 833,041 |
| Events in quadrant D | 5,491,386 | 730,830 |
| Mode M0 | |||
|---|---|---|---|
| Quadrant | BADHDUFLAG | Total packets | Discarded packets |
| A | 0 | 25752 | 0 |
| B | 0 | 21615 | 0 |
| C | 0 | 17312 | 0 |
| D | 0 | 21919 | 0 |
| Mode SS | |||
|---|---|---|---|
| Quadrant | BADHDUFLAG | Total packets | Discarded packets |
| A | 0 | 160 | 0 |
| B | 0 | 160 | 0 |
| C | 0 | 160 | 0 |
| D | 0 | 160 | 0 |
| Quadrant | Total seconds | Saturated seconds | Saturation percentage |
|---|---|---|---|
| A | 7936 | 119 | 1.499496% |
| B | 7937 | 143 | 1.801688% |
| C | 7937 | 74 | 0.932342% |
| D | 7937 | 394 | 4.964092% |
Noise dominated data is calculated using 1-second bins in cleaned event files. If a bin has >2000 counts, and if more than 50% of those come from <1% of pixels, then it is considered to be noise-dominated and hence unusable.
| Quadrant | # 1 sec bins | Bins with >0 counts | Bins with >2000 counts | High rate bins dominated by noise | Noise dominated (total time) | Noise dominated (detector-on time) | Marked lightcurve |
|---|---|---|---|---|---|---|---|
| A | 7936 | 7936 | 8 | 8 | 0.10% | 0.10% | 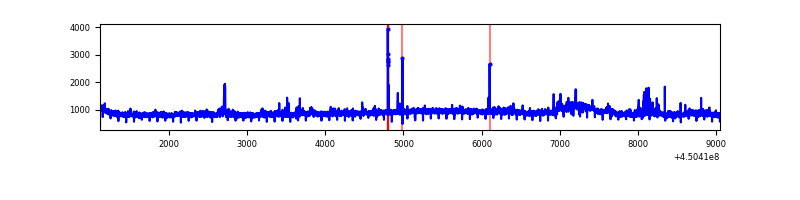 |
| B | 7937 | 7937 | 59 | 59 | 0.74% | 0.74% | 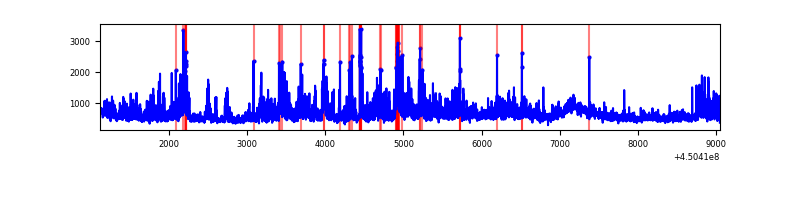 |
| C | 7937 | 7937 | 53 | 53 | 0.67% | 0.67% | 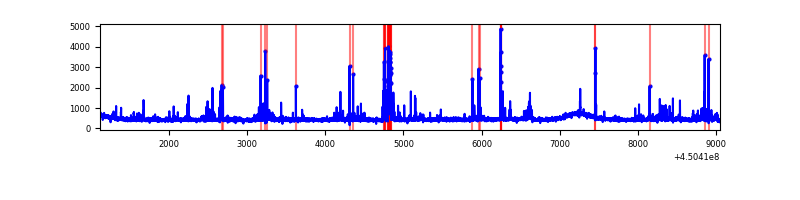 |
| D | 7937 | 7937 | 312 | 312 | 3.93% | 3.93% | 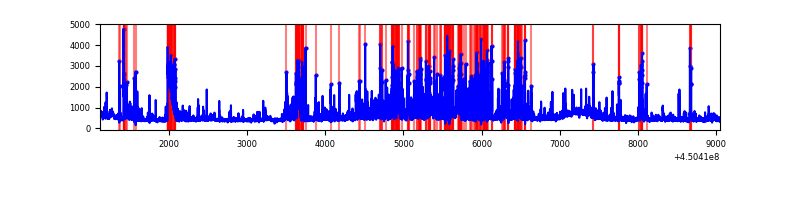 |
Top three noisy pixels from each quadrant. If the there are fewer than three noisy pixels in the level2.evt file, extra rows are filled as -1
| Pixel properties | Quadrant properties | ||||||
|---|---|---|---|---|---|---|---|
| Quadrant | DetID | PixID | Counts | Sigma | Mean | Median | Sigma |
| A | 10 | 83 | 3229901 | 17107.12 | 897 | 876 | 188.8 |
| A | 14 | 235 | 271297 | 1432.67 | 897 | 876 | 188.8 |
| A | 10 | 255 | 35645 | 184.2 | 897 | 876 | 188.8 |
| B | 3 | 112 | 1791048 | 9933.87 | 900 | 871 | 180.2 |
| B | 5 | 172 | 56827 | 310.51 | 900 | 871 | 180.2 |
| B | 12 | 111 | 23450 | 125.29 | 900 | 871 | 180.2 |
| C | 12 | 2 | 354899 | 1675.13 | 886 | 890 | 211.3 |
| C | 2 | 14 | 62902 | 293.43 | 886 | 890 | 211.3 |
| C | 12 | 249 | 39618 | 183.26 | 886 | 890 | 211.3 |
| D | 5 | 235 | 1195166 | 5455.94 | 865 | 839 | 218.9 |
| D | 13 | 249 | 330699 | 1506.87 | 865 | 839 | 218.9 |
| D | 2 | 37 | 217940 | 991.76 | 865 | 839 | 218.9 |
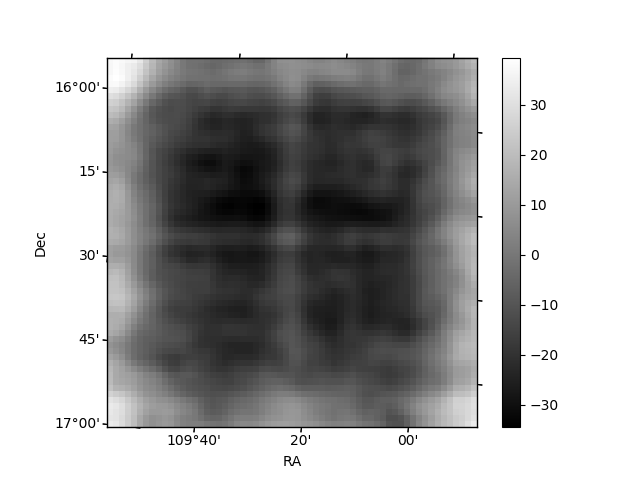
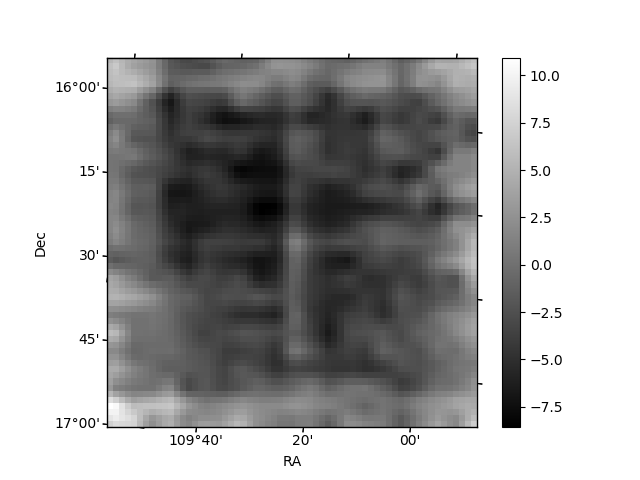
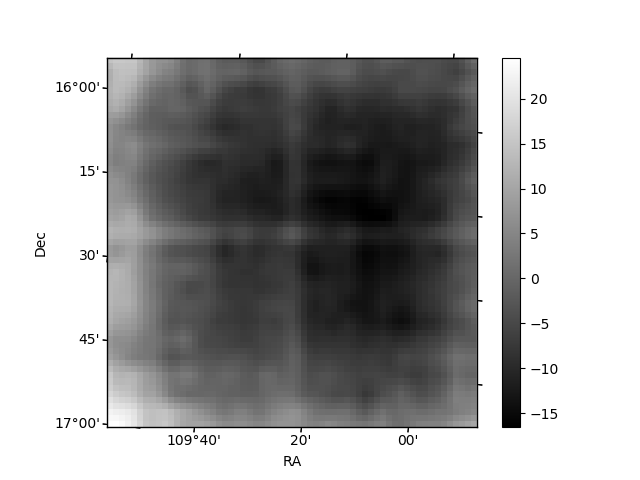
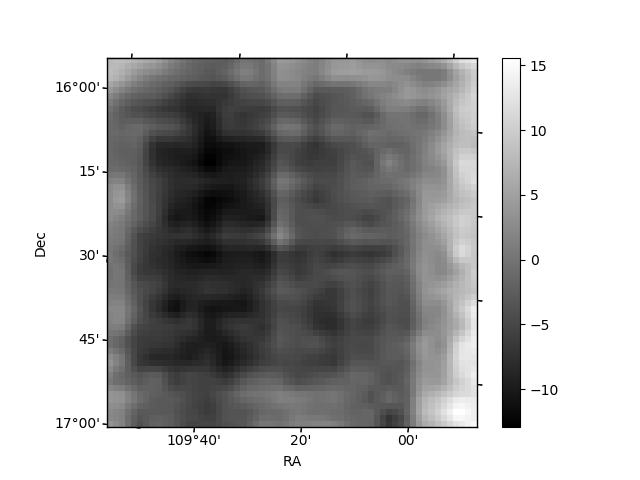
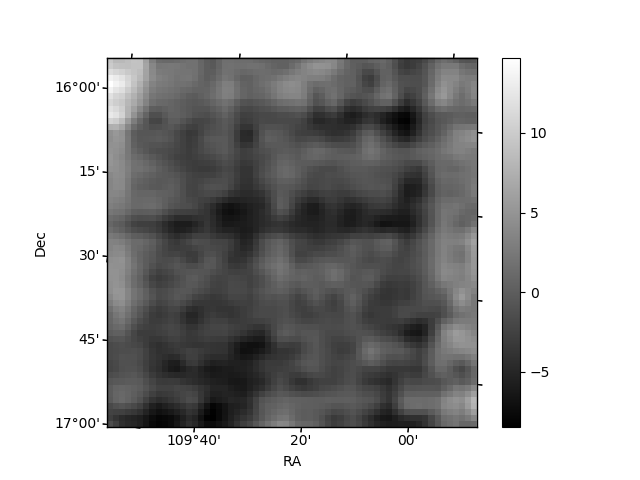
Histogram calculated using DETX and DETY for each event in the final _common_clean file
| Quadrant A | 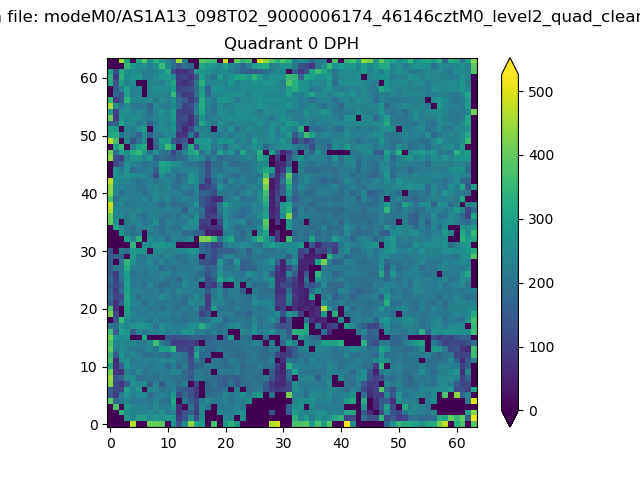 |
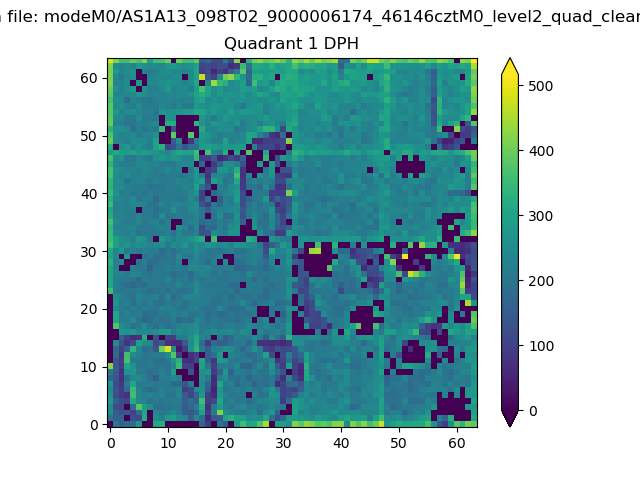 |
Quadrant B |
|---|---|---|---|
| Quadrant D | 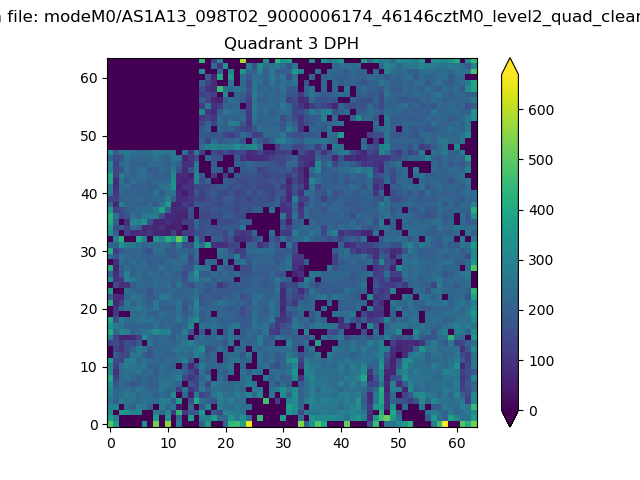 |
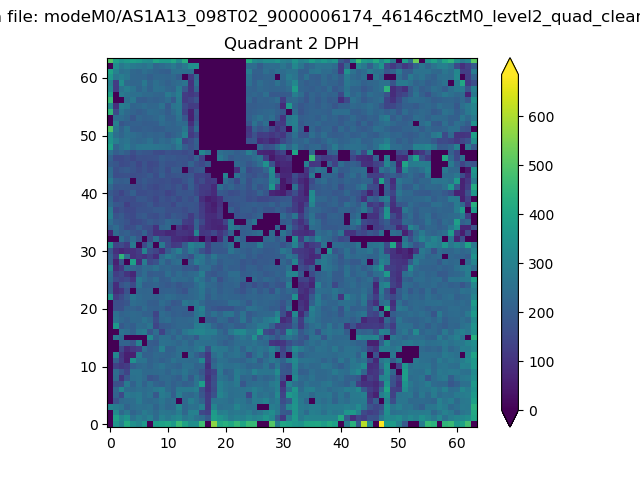 |
Quadrant C |
| Plot type | Count rate plots | Images |
|---|---|---|
| Comparison with Poisson distribution Blue bars denote a histogram of data divided into 1 sec bins. Red curve is a Poisson curve with rate = median count rate of data. |
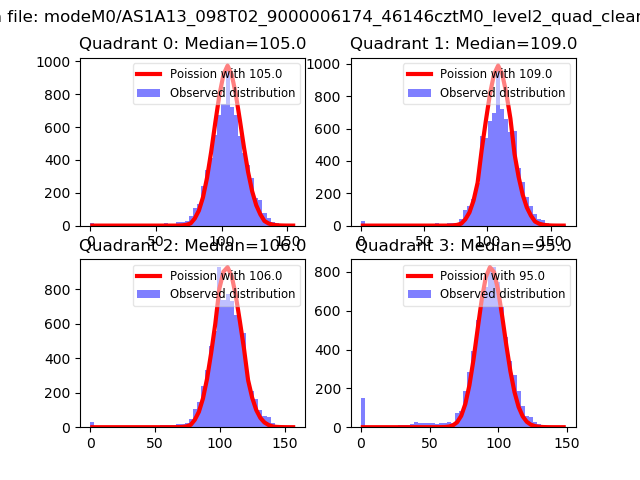 |
 |
| Quadrant-wise count rates Data is divided into 100 sec bins |
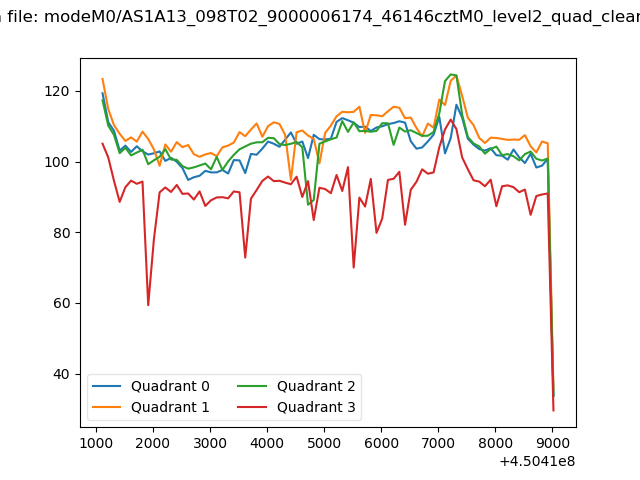 |
|
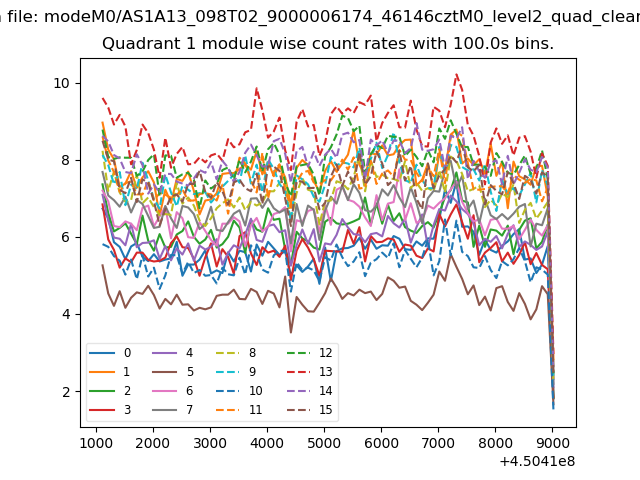
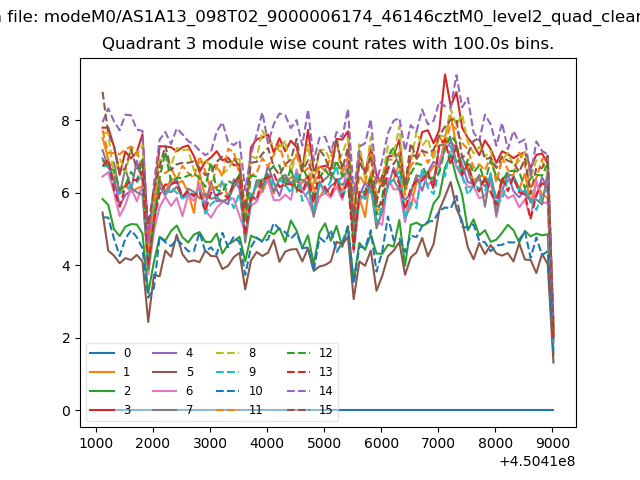
| Module-wise count rates for Quadrant A Data is divided into 100 sec bins |
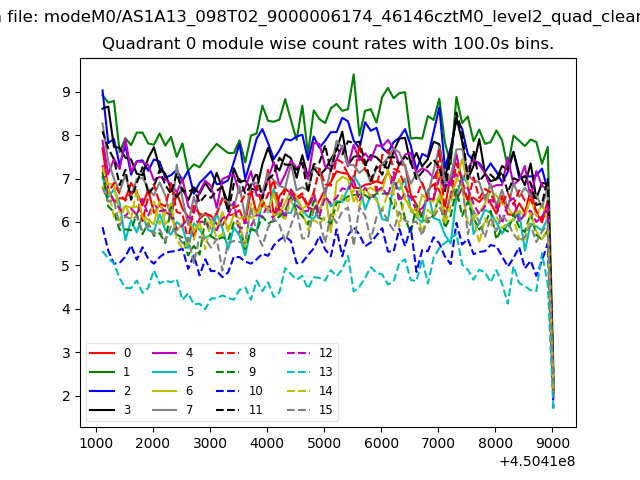 |
 |
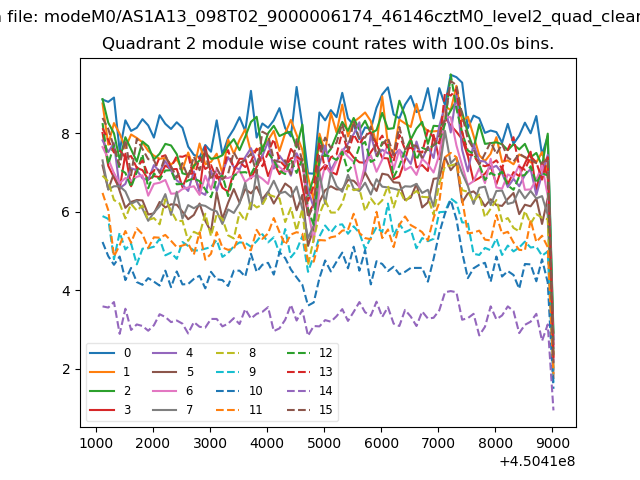
| Module-wise count rates for Quadrant B Data is divided into 100 sec bins |
 |
 |
| Module-wise count rates for Quadrant C Data is divided into 100 sec bins |
 |
 |
| Module-wise count rates for Quadrant D Data is divided into 100 sec bins |
 |
 |
| Parameter | Plot |
|---|---|
| CZT HV Monitor | 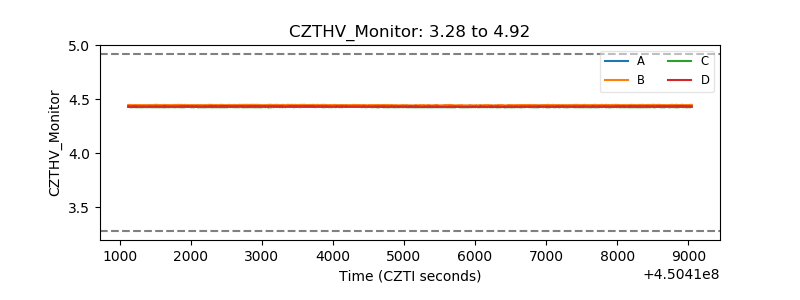 |
| D_VDD | 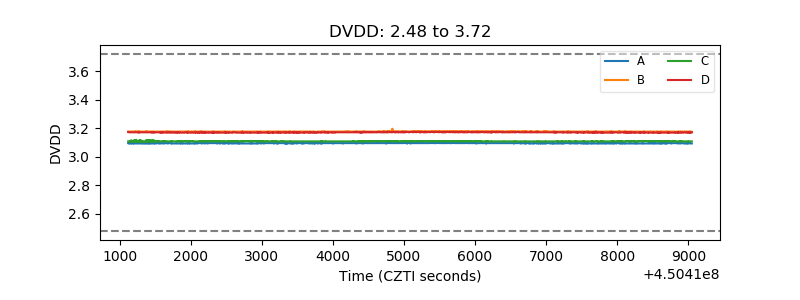 |
| Temperature 1 | 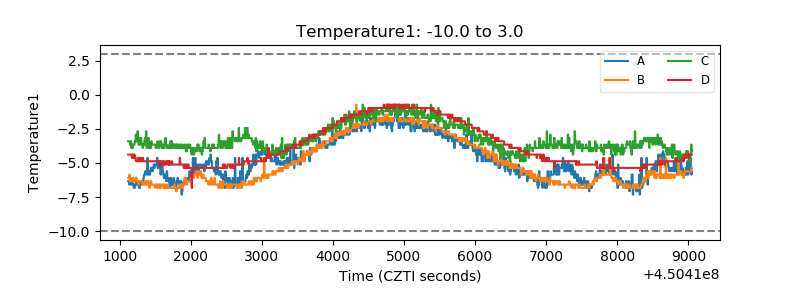 |
| Veto HV Monitor | 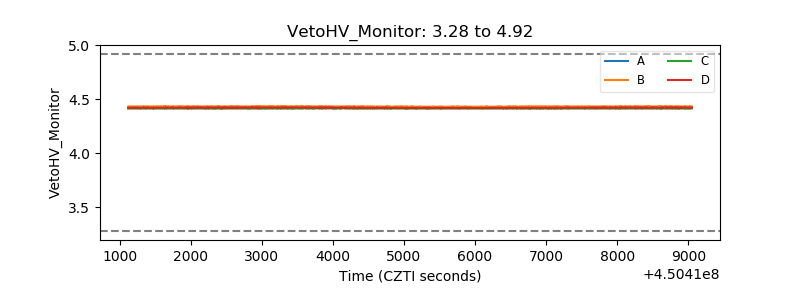 |
| Veto LLD | 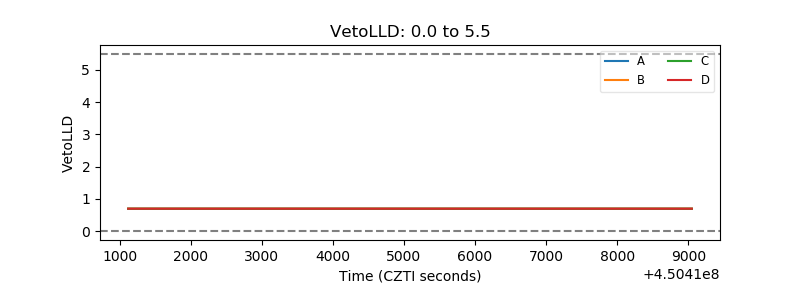 |
| Alpha Counter | 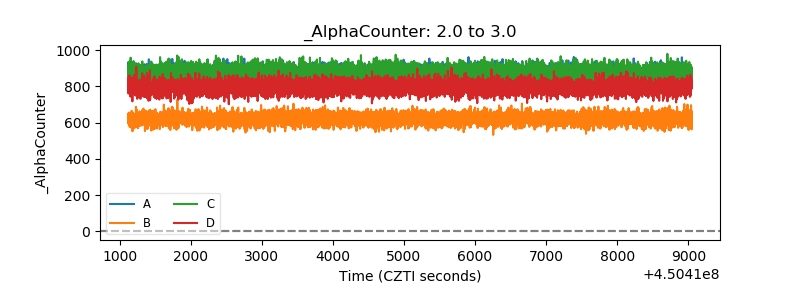 |
| _CPM_Rate | 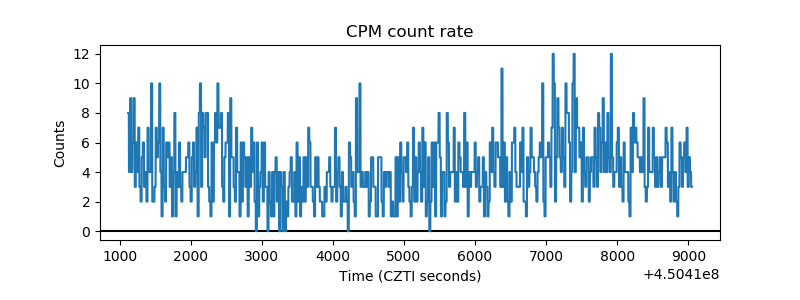 |
| CZT Counter | 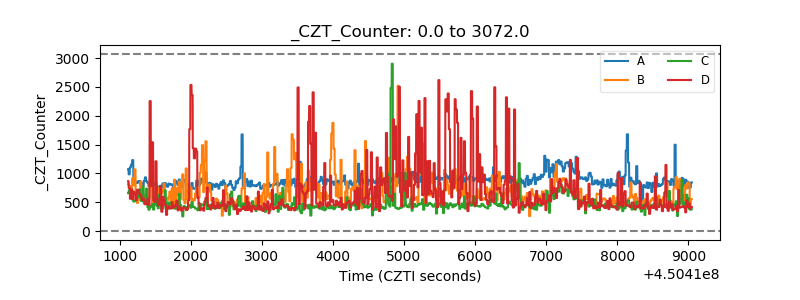 |
| +2.5 Volts monitor | 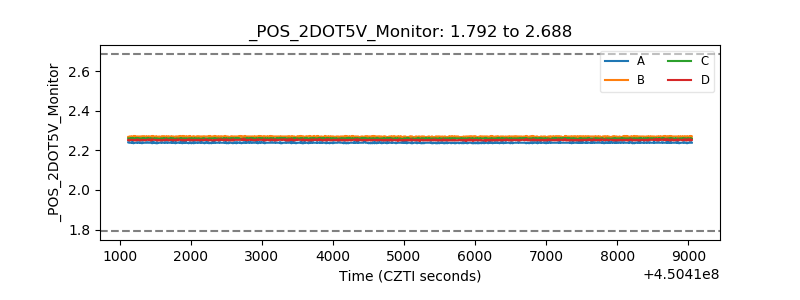 |
| +5 Volts monitor | 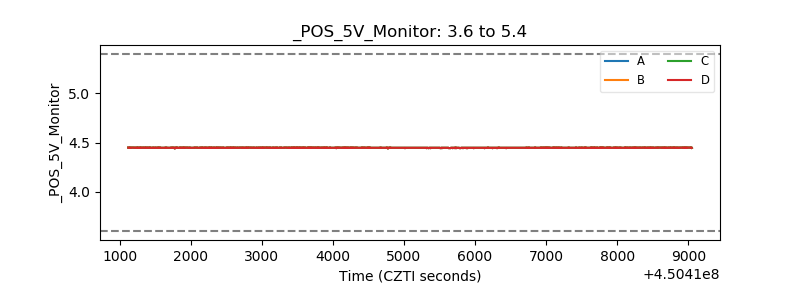 |
| _ROLL_ROT | 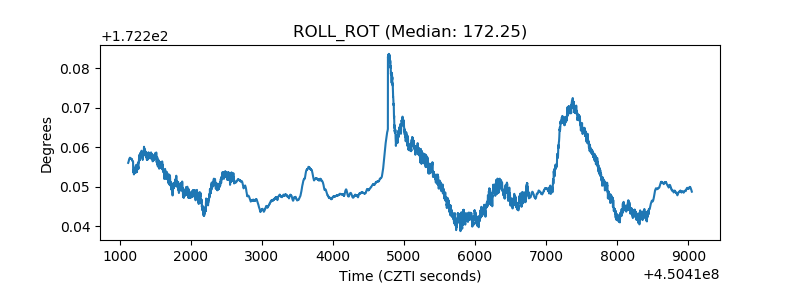 |
| _Roll_DEC | 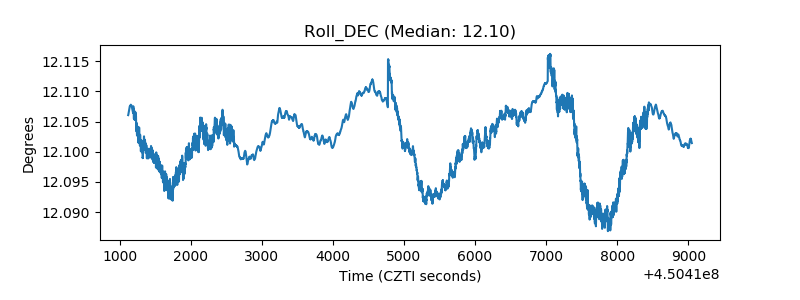 |
| _Roll_RA | 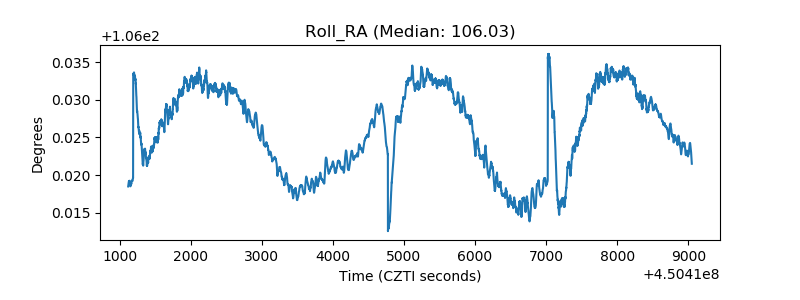 |
| Veto Counter | 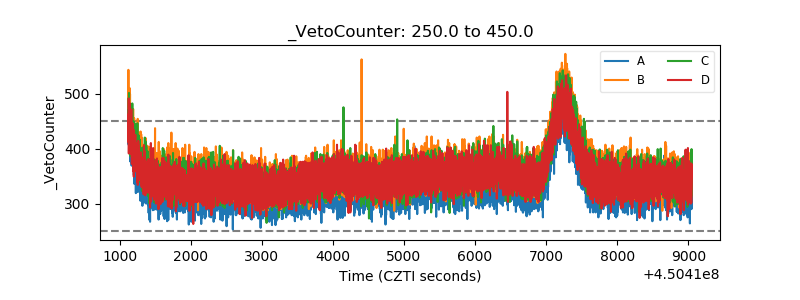 |