| Param | Original file | Final file |
|---|---|---|
| Filename | modeM0/AS1A13_098T02_9000006174_46149cztM0_level2.fits | modeM0/AS1A13_098T02_9000006174_46149cztM0_level2_quad_clean.evt |
| Size (bytes) | 935,271,360 | 157,680,000 |
| Size | 891.9 MB | 150.4 MB |
| Events in quadrant A | 9,298,177 | 1,054,750 |
| Events in quadrant B | 10,573,354 | 957,274 |
| Events in quadrant C | 5,031,899 | 1,097,438 |
| Events in quadrant D | 8,900,657 | 933,330 |
| Mode M0 | |||
|---|---|---|---|
| Quadrant | BADHDUFLAG | Total packets | Discarded packets |
| A | 0 | 33463 | 1 |
| B | 0 | 38525 | 1 |
| C | 0 | 22557 | 1 |
| D | 0 | 33752 | 1 |
| Mode SS | |||
|---|---|---|---|
| Quadrant | BADHDUFLAG | Total packets | Discarded packets |
| A | 0 | 212 | 0 |
| B | 0 | 212 | 0 |
| C | 0 | 212 | 0 |
| D | 0 | 212 | 0 |
| Mode M9 | |||
|---|---|---|---|
| Quadrant | BADHDUFLAG | Total packets | Discarded packets |
| A | 0 | 3 | 0 |
| B | 0 | 3 | 0 |
| C | 0 | 3 | 0 |
| D | 0 | 3 | 0 |
| Quadrant | Total seconds | Saturated seconds | Saturation percentage |
|---|---|---|---|
| A | 10560 | 570 | 5.397727% |
| B | 10561 | 1980 | 18.748225% |
| C | 10561 | 219 | 2.073667% |
| D | 10561 | 1035 | 9.800208% |
Noise dominated data is calculated using 1-second bins in cleaned event files. If a bin has >2000 counts, and if more than 50% of those come from <1% of pixels, then it is considered to be noise-dominated and hence unusable.
| Quadrant | # 1 sec bins | Bins with >0 counts | Bins with >2000 counts | High rate bins dominated by noise | Noise dominated (total time) | Noise dominated (detector-on time) | Marked lightcurve |
|---|---|---|---|---|---|---|---|
| A | 10790 | 10561 | 18 | 18 | 0.17% | 0.17% | 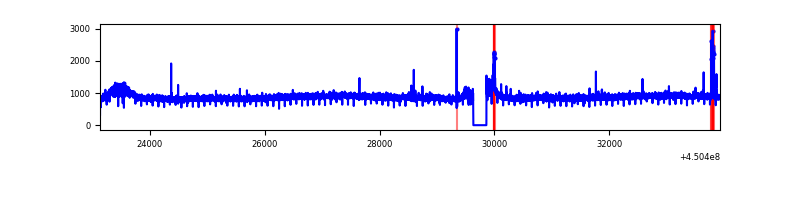 |
| B | 10790 | 10561 | 1413 | 1413 | 13.10% | 13.38% | 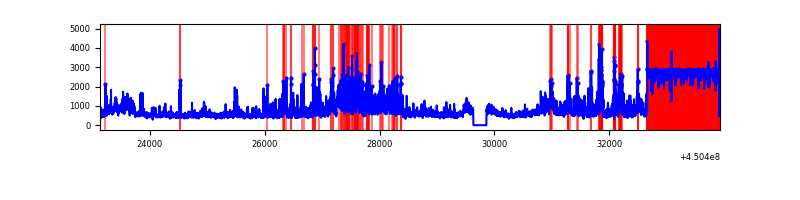 |
| C | 10791 | 10562 | 29 | 29 | 0.27% | 0.27% | 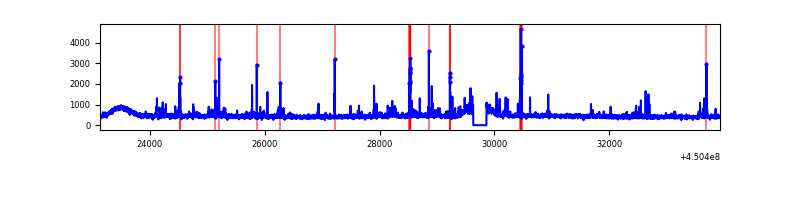 |
| D | 10791 | 10562 | 639 | 639 | 5.92% | 6.05% | 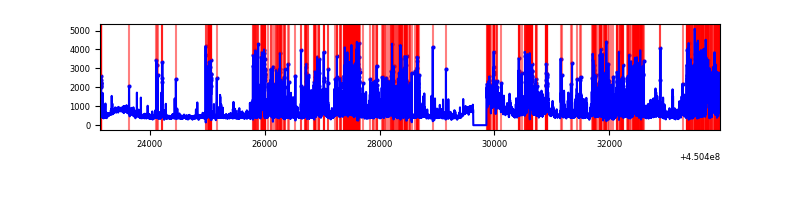 |
Top three noisy pixels from each quadrant. If the there are fewer than three noisy pixels in the level2.evt file, extra rows are filled as -1
| Pixel properties | Quadrant properties | ||||||
|---|---|---|---|---|---|---|---|
| Quadrant | DetID | PixID | Counts | Sigma | Mean | Median | Sigma |
| A | 10 | 83 | 4493710 | 17727.71 | 1209 | 1182 | 253.4 |
| A | 10 | 255 | 44723 | 171.81 | 1209 | 1182 | 253.4 |
| A | 13 | 248 | 41653 | 159.7 | 1209 | 1182 | 253.4 |
| B | 10 | 246 | 3256961 | 14815.75 | 1091 | 1057 | 219.8 |
| B | 3 | 112 | 2686024 | 12217.75 | 1091 | 1057 | 219.8 |
| B | 0 | 186 | 125821 | 567.73 | 1091 | 1057 | 219.8 |
| C | 12 | 2 | 200877 | 699.95 | 1204 | 1207 | 285.3 |
| C | 2 | 14 | 86300 | 298.3 | 1204 | 1207 | 285.3 |
| C | 3 | 233 | 25765 | 86.09 | 1204 | 1207 | 285.3 |
| D | 5 | 235 | 2550559 | 8551.47 | 1167 | 1127 | 298.1 |
| D | 13 | 138 | 725720 | 2430.47 | 1167 | 1127 | 298.1 |
| D | 1 | 52 | 221509 | 739.22 | 1167 | 1127 | 298.1 |
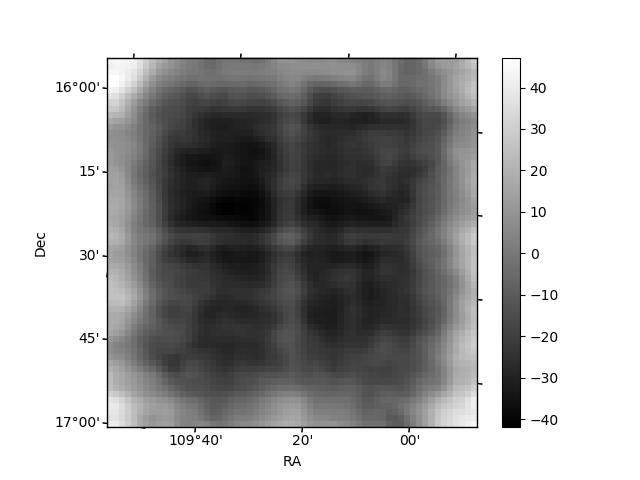
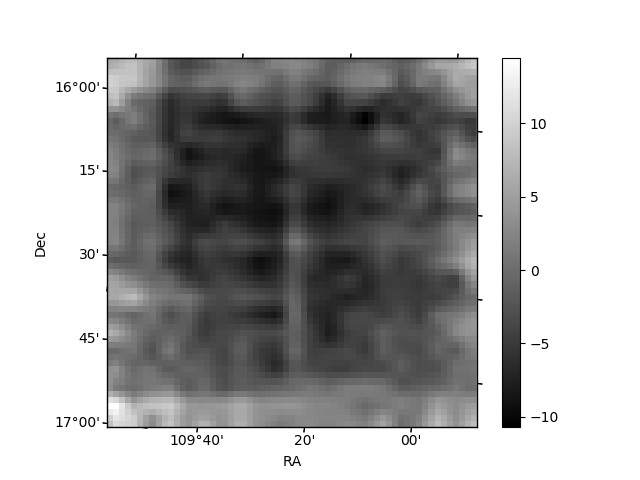
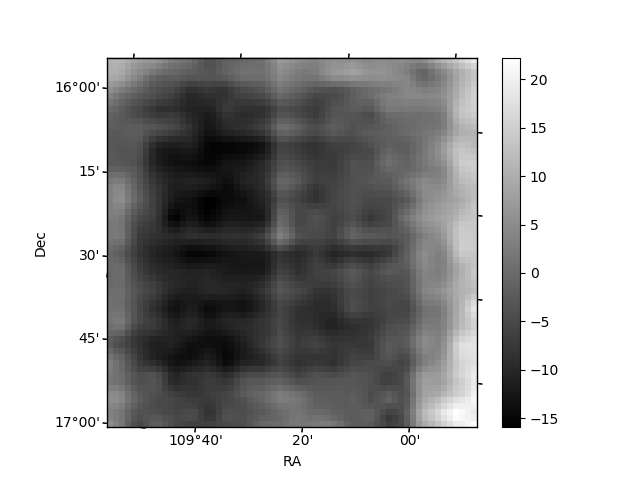
Histogram calculated using DETX and DETY for each event in the final _common_clean file
| Quadrant A | 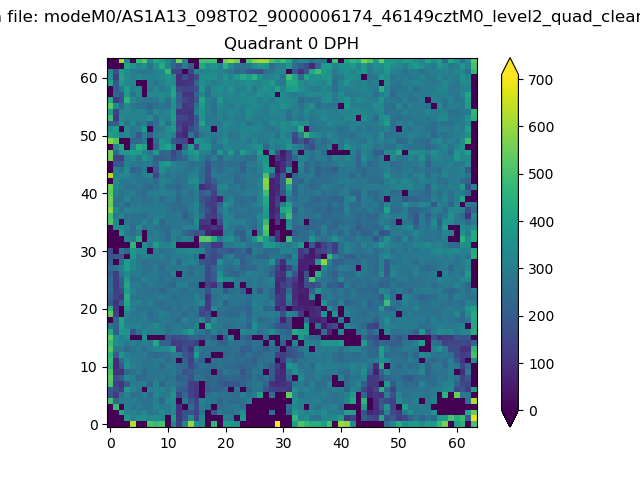 |
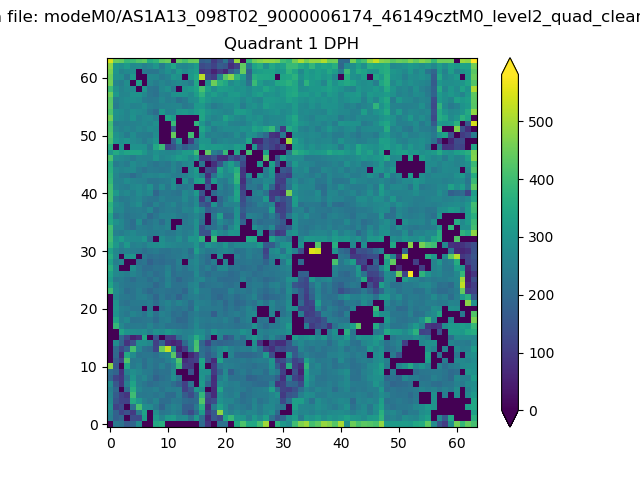 |
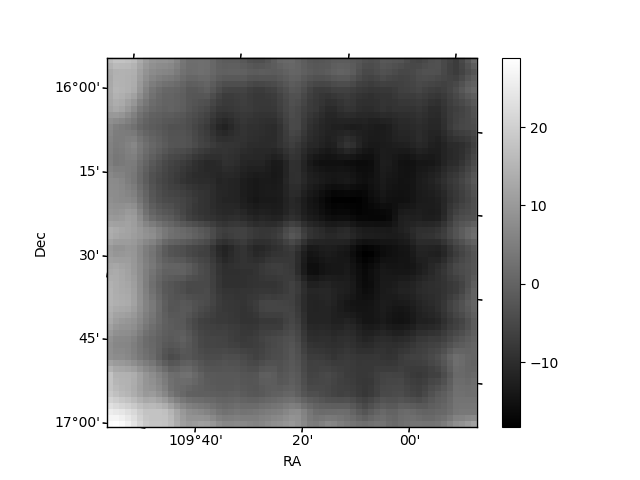
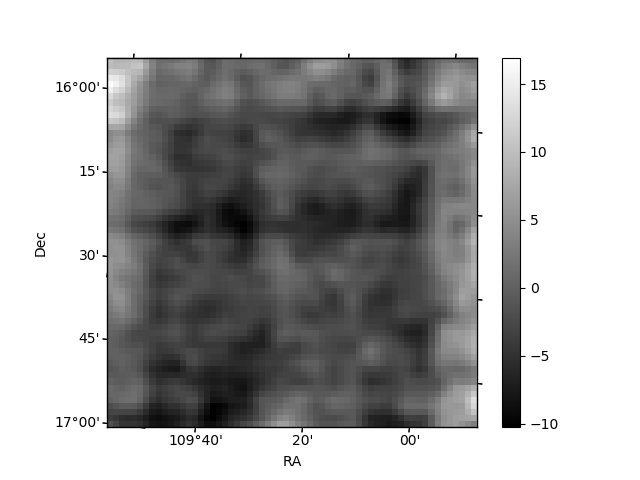
Quadrant B |
|---|---|---|---|
| Quadrant D | 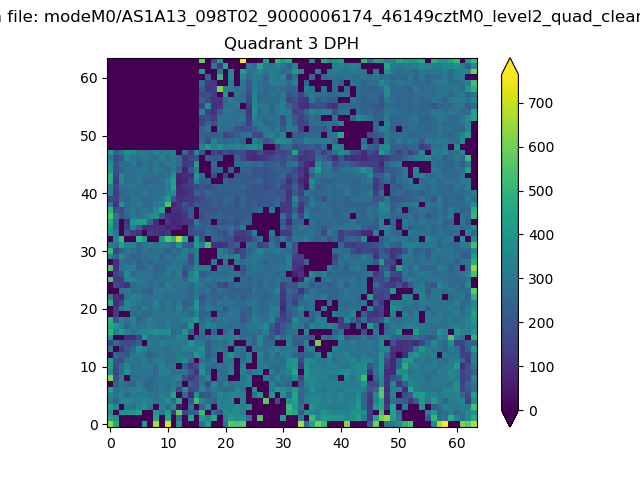 |
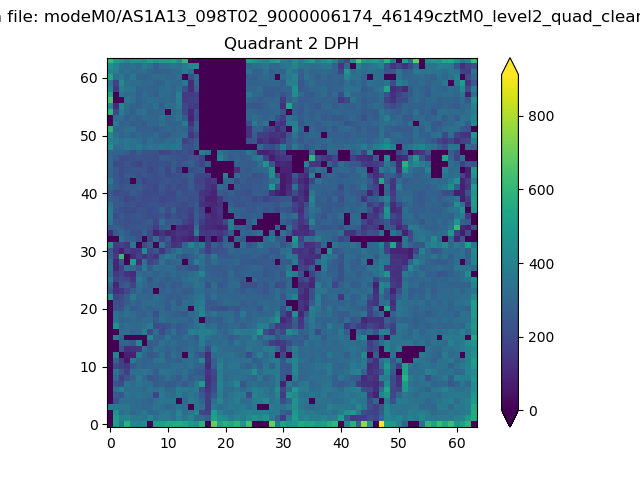 |
Quadrant C |
| Plot type | Count rate plots | Images |
|---|---|---|
| Comparison with Poisson distribution Blue bars denote a histogram of data divided into 1 sec bins. Red curve is a Poisson curve with rate = median count rate of data. |
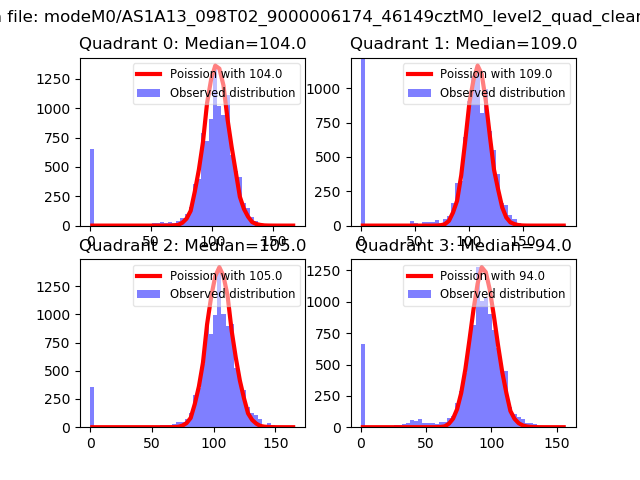 |
 |
| Quadrant-wise count rates Data is divided into 100 sec bins |
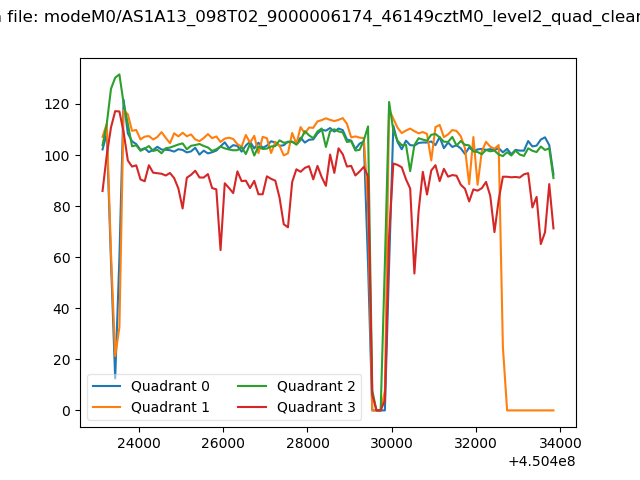 |
|
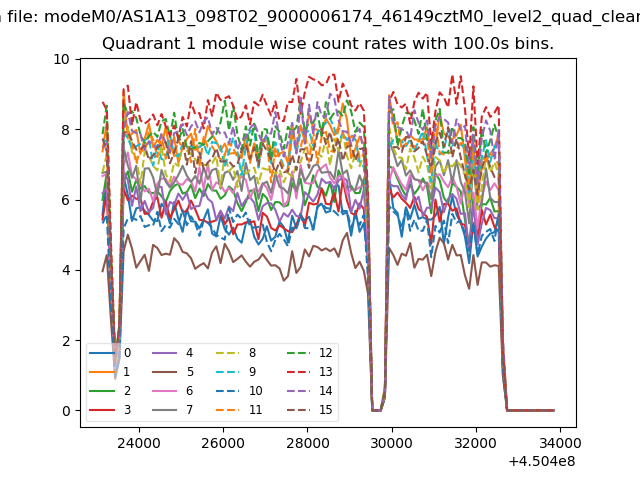
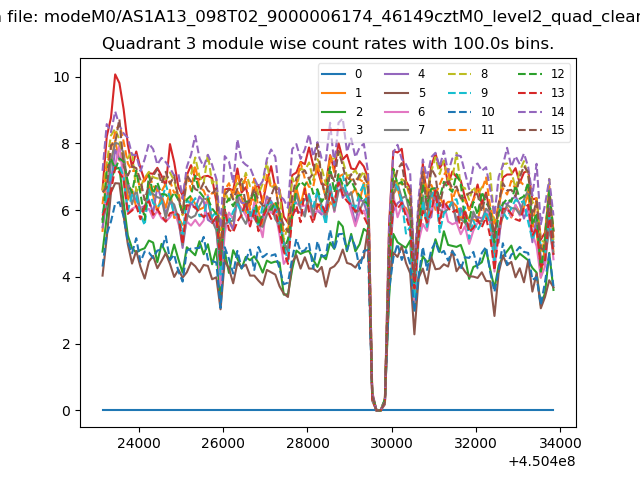
| Module-wise count rates for Quadrant A Data is divided into 100 sec bins |
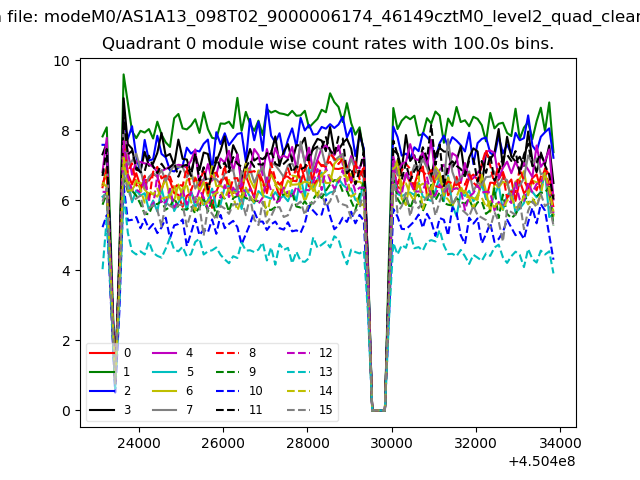 |
 |
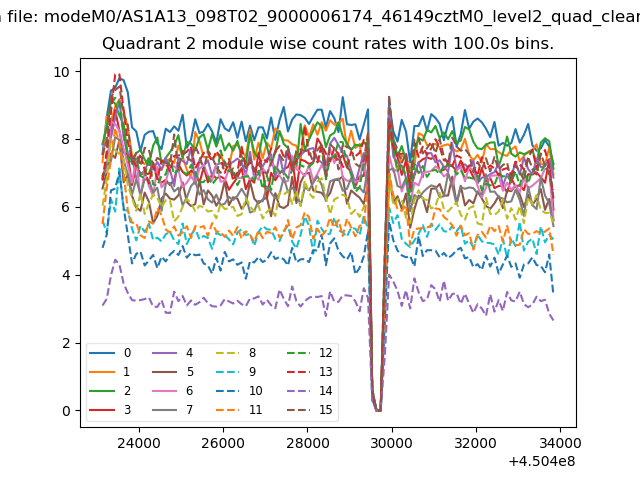
| Module-wise count rates for Quadrant B Data is divided into 100 sec bins |
 |
 |
| Module-wise count rates for Quadrant C Data is divided into 100 sec bins |
 |
 |
| Module-wise count rates for Quadrant D Data is divided into 100 sec bins |
 |
 |
| Parameter | Plot |
|---|---|
| CZT HV Monitor | 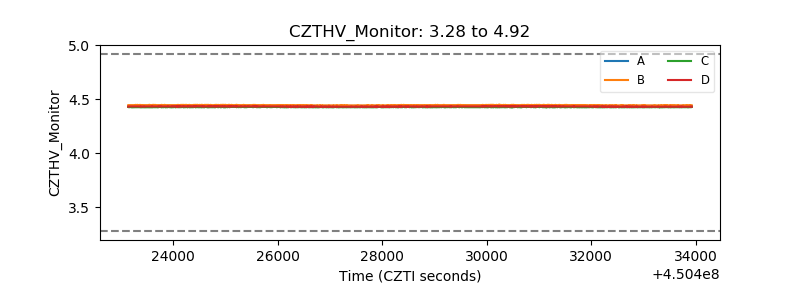 |
| D_VDD | 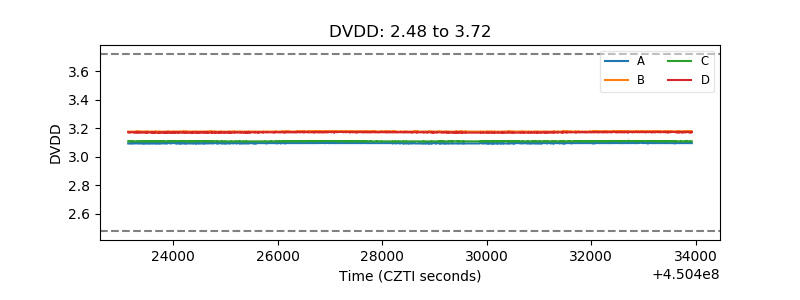 |
| Temperature 1 | 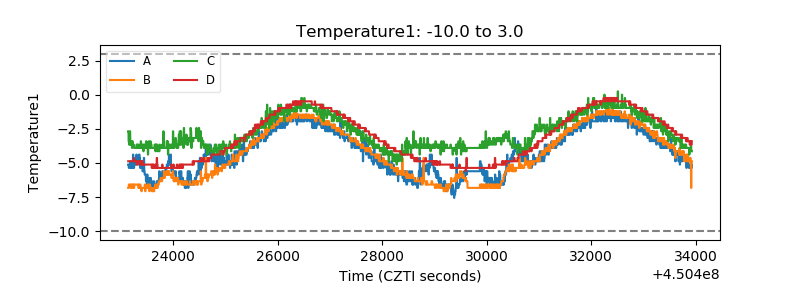 |
| Veto HV Monitor |  |
| Veto LLD | 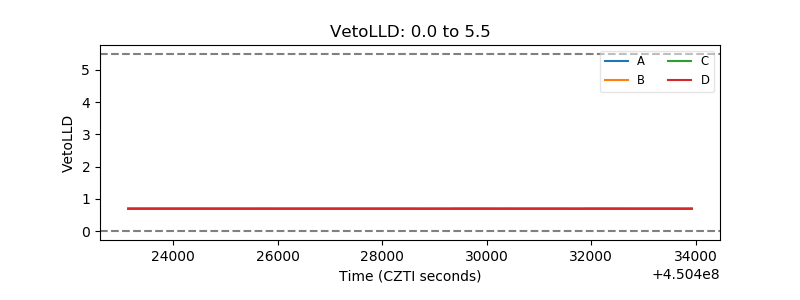 |
| Alpha Counter | 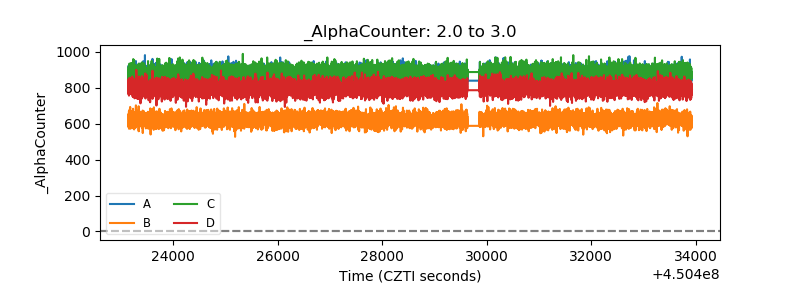 |
| _CPM_Rate | 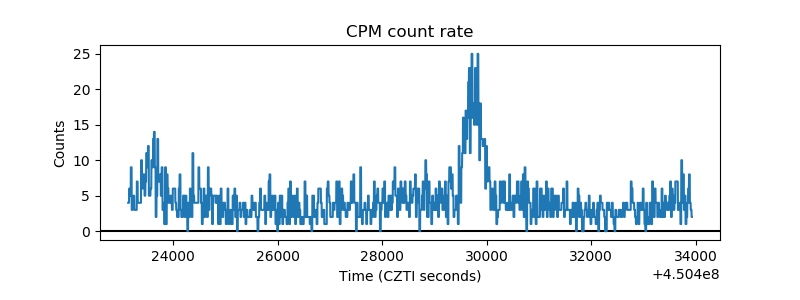 |
| CZT Counter | 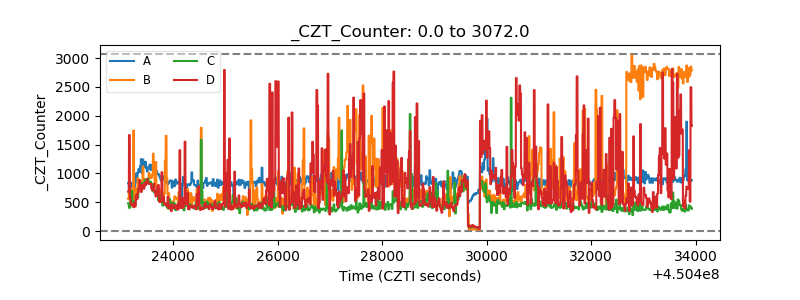 |
| +2.5 Volts monitor | 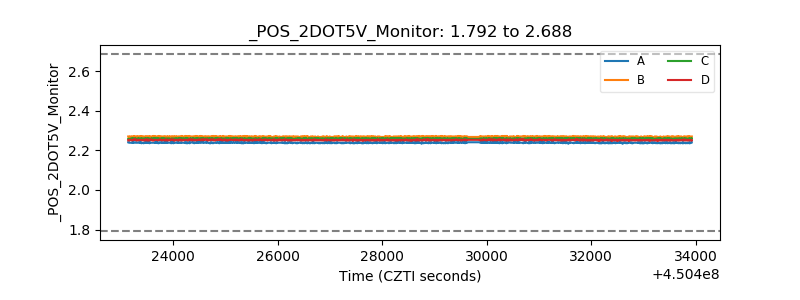 |
| +5 Volts monitor | 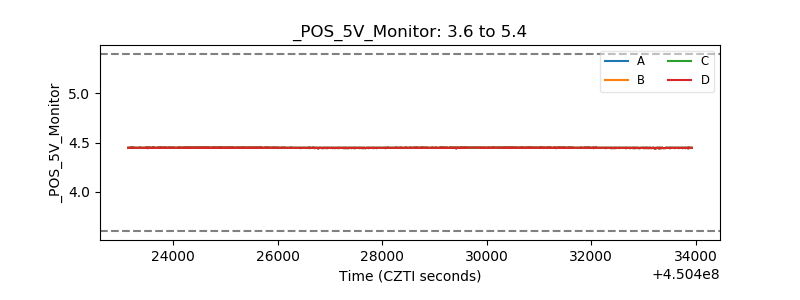 |
| _ROLL_ROT | 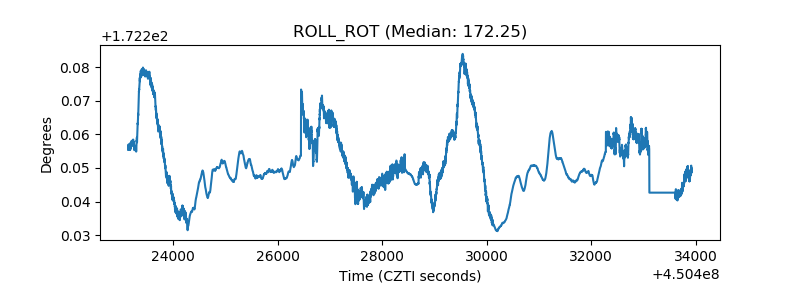 |
| _Roll_DEC | 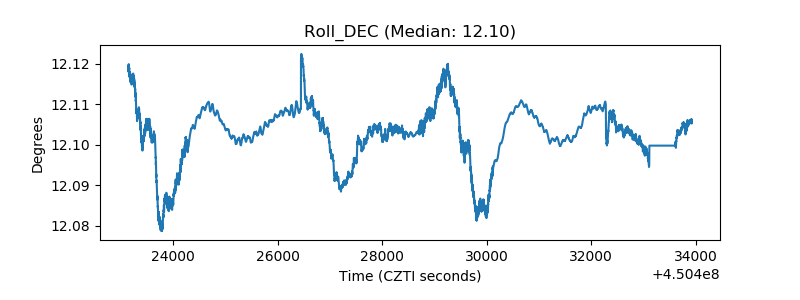 |
| _Roll_RA | 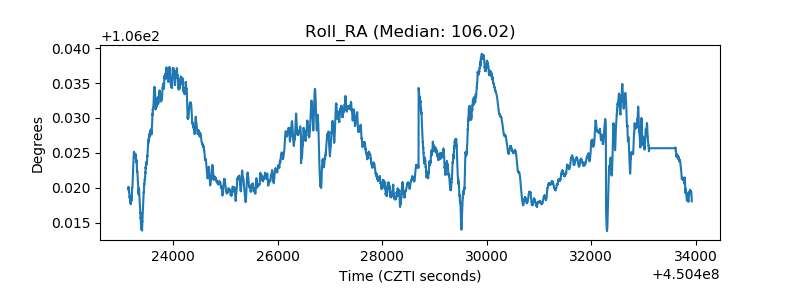 |
| Veto Counter | 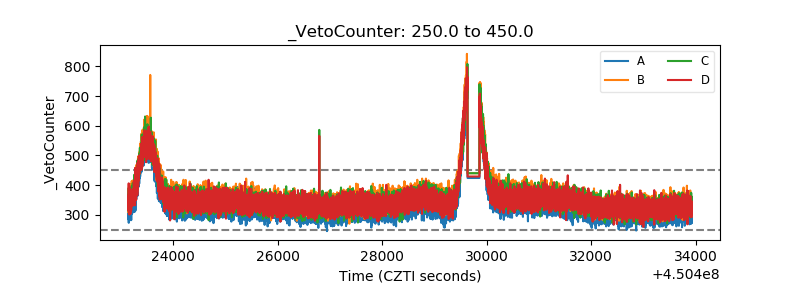 |