| Param | Original file | Final file |
|---|---|---|
| Filename | modeM0/AS1T05_194T01_9000006180_46167cztM0_level2.fits | modeM0/AS1T05_194T01_9000006180_46167cztM0_level2_quad_clean.evt |
| Size (bytes) | 619,992,000 | 96,384,960 |
| Size | 591.3 MB | 91.9 MB |
| Events in quadrant A | 5,518,365 | 671,485 |
| Events in quadrant B | 4,691,433 | 659,810 |
| Events in quadrant C | 6,099,032 | 600,127 |
| Events in quadrant D | 6,159,941 | 551,856 |
| Mode M9 | |||
|---|---|---|---|
| Quadrant | BADHDUFLAG | Total packets | Discarded packets |
| A | 0 | 10 | 0 |
| B | 0 | 10 | 0 |
| C | 0 | 10 | 0 |
| D | 0 | 10 | 0 |
| Mode SS | |||
|---|---|---|---|
| Quadrant | BADHDUFLAG | Total packets | Discarded packets |
| A | 0 | 128 | 0 |
| B | 0 | 128 | 0 |
| C | 0 | 128 | 0 |
| D | 0 | 128 | 0 |
| Mode M0 | |||
|---|---|---|---|
| Quadrant | BADHDUFLAG | Total packets | Discarded packets |
| A | 0 | 20168 | 1 |
| B | 0 | 18075 | 1 |
| C | 0 | 22435 | 1 |
| D | 0 | 22645 | 1 |
| Quadrant | Total seconds | Saturated seconds | Saturation percentage |
|---|---|---|---|
| A | 6222 | 126 | 2.025072% |
| B | 6222 | 441 | 7.087753% |
| C | 6222 | 796 | 12.793314% |
| D | 6222 | 782 | 12.568306% |
Noise dominated data is calculated using 1-second bins in cleaned event files. If a bin has >2000 counts, and if more than 50% of those come from <1% of pixels, then it is considered to be noise-dominated and hence unusable.
| Quadrant | # 1 sec bins | Bins with >0 counts | Bins with >2000 counts | High rate bins dominated by noise | Noise dominated (total time) | Noise dominated (detector-on time) | Marked lightcurve |
|---|---|---|---|---|---|---|---|
| A | 7232 | 6223 | 8 | 8 | 0.11% | 0.13% | 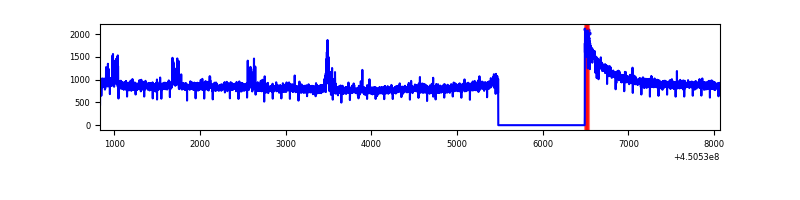 |
| B | 7232 | 6223 | 276 | 276 | 3.82% | 4.44% | 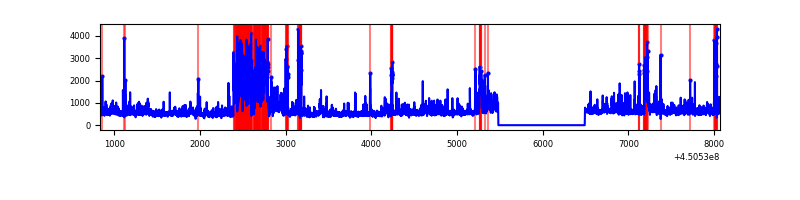 |
| C | 7232 | 6223 | 656 | 656 | 9.07% | 10.54% | 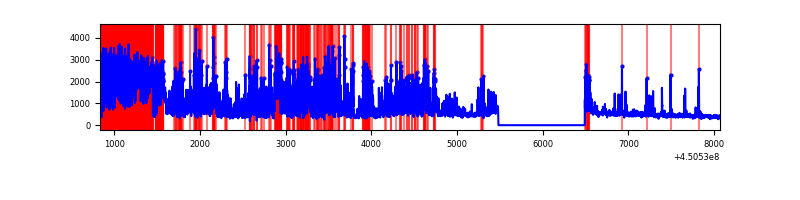 |
| D | 7232 | 6223 | 590 | 590 | 8.16% | 9.48% | 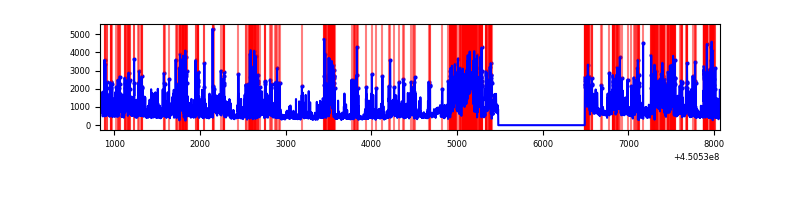 |
Top three noisy pixels from each quadrant. If the there are fewer than three noisy pixels in the level2.evt file, extra rows are filled as -1
| Pixel properties | Quadrant properties | ||||||
|---|---|---|---|---|---|---|---|
| Quadrant | DetID | PixID | Counts | Sigma | Mean | Median | Sigma |
| A | 10 | 83 | 2757563 | 19344.92 | 686 | 672 | 142.5 |
| A | 0 | 247 | 71348 | 495.93 | 686 | 672 | 142.5 |
| A | 9 | 191 | 14586 | 97.63 | 686 | 672 | 142.5 |
| B | 3 | 112 | 1204410 | 9191.37 | 667 | 647 | 131.0 |
| B | 15 | 201 | 713172 | 5440.51 | 667 | 647 | 131.0 |
| B | 5 | 172 | 96354 | 730.77 | 667 | 647 | 131.0 |
| C | 14 | 254 | 3454595 | 22988.98 | 642 | 646 | 150.2 |
| C | 12 | 2 | 89380 | 590.6 | 642 | 646 | 150.2 |
| C | 2 | 14 | 20628 | 132.99 | 642 | 646 | 150.2 |
| D | 1 | 52 | 1153319 | 7101.88 | 641 | 620 | 162.3 |
| D | 2 | 249 | 794882 | 4893.51 | 641 | 620 | 162.3 |
| D | 5 | 235 | 732495 | 4509.14 | 641 | 620 | 162.3 |
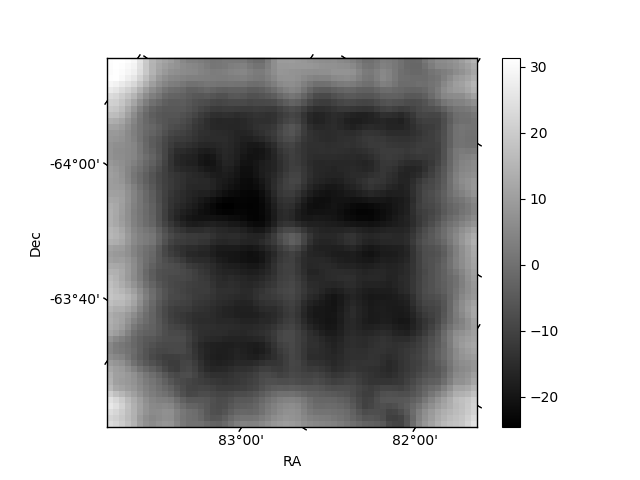
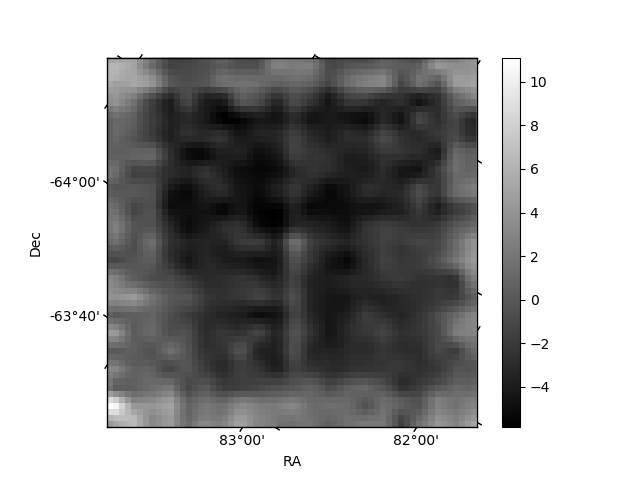
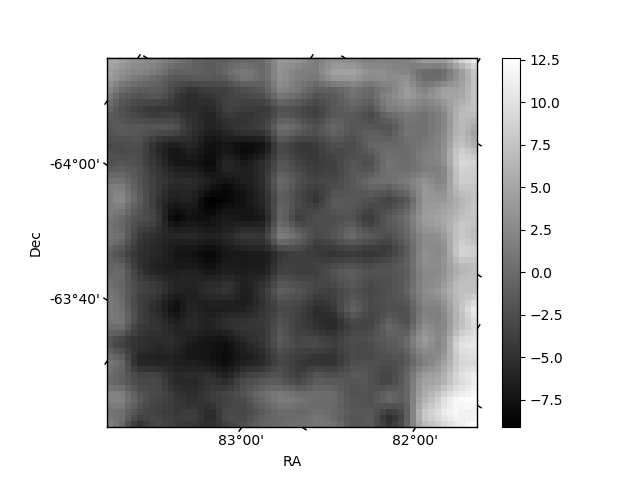
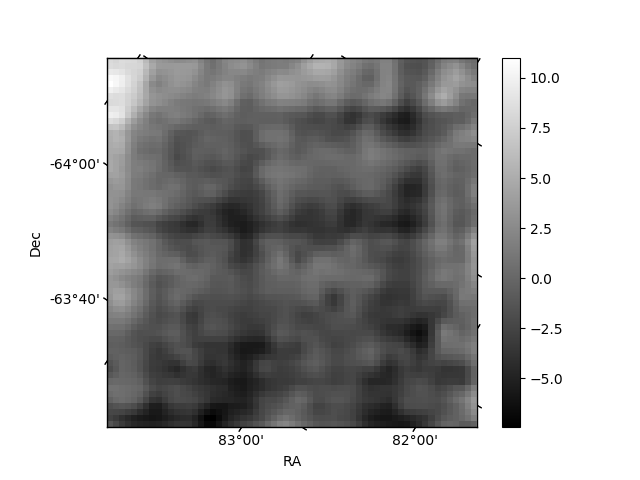
Histogram calculated using DETX and DETY for each event in the final _common_clean file
| Quadrant A | 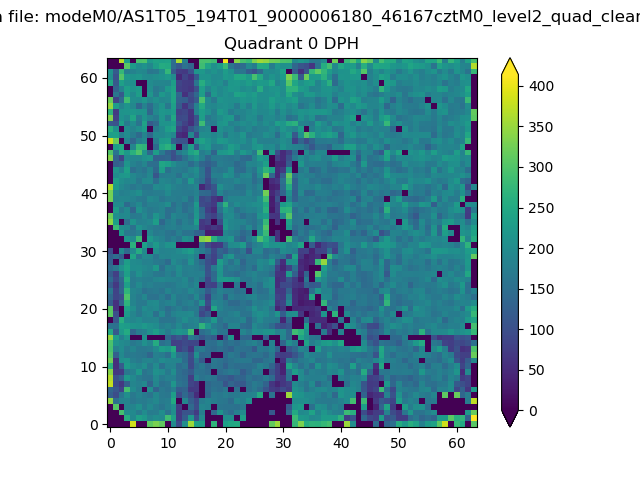 |
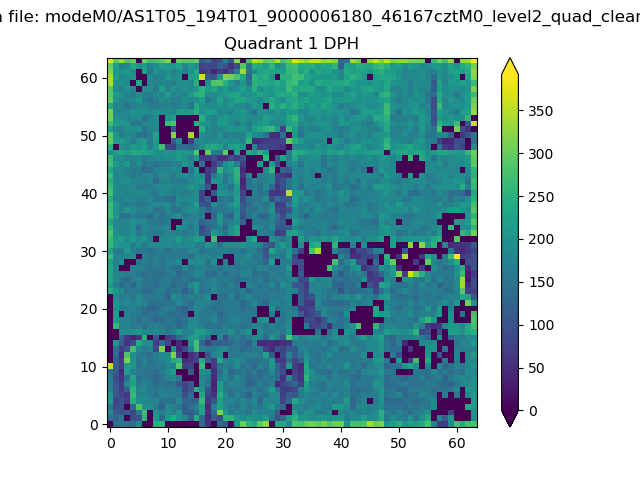 |
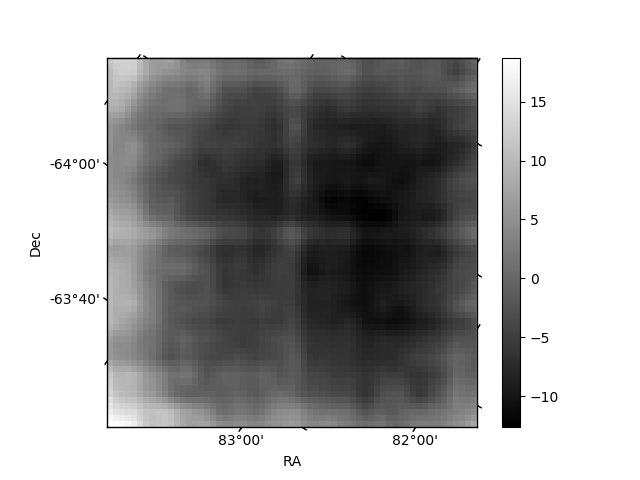
Quadrant B |
|---|---|---|---|
| Quadrant D | 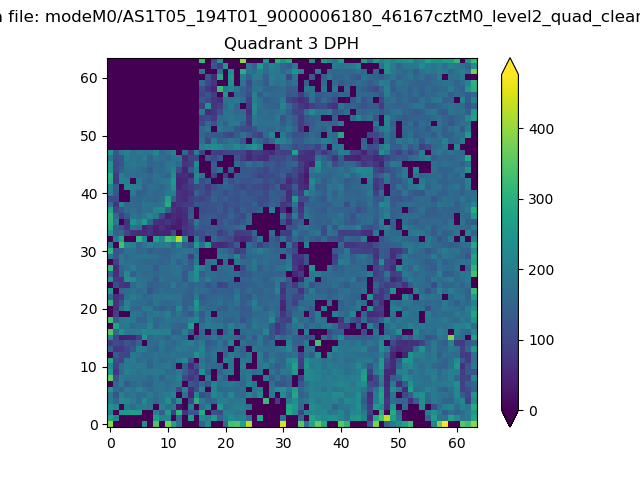 |
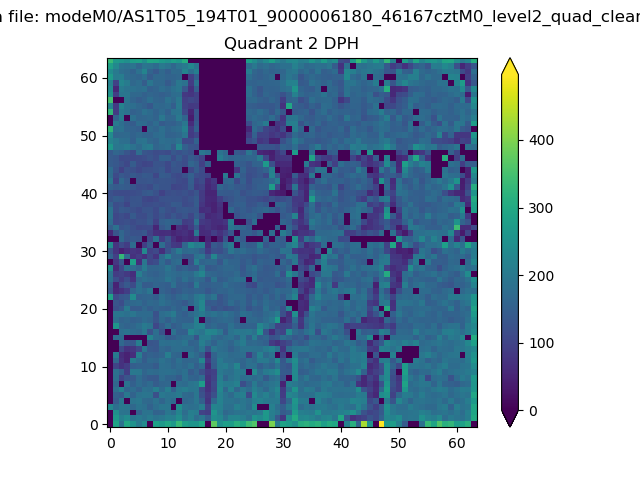 |
Quadrant C |
| Plot type | Count rate plots | Images |
|---|---|---|
| Comparison with Poisson distribution Blue bars denote a histogram of data divided into 1 sec bins. Red curve is a Poisson curve with rate = median count rate of data. |
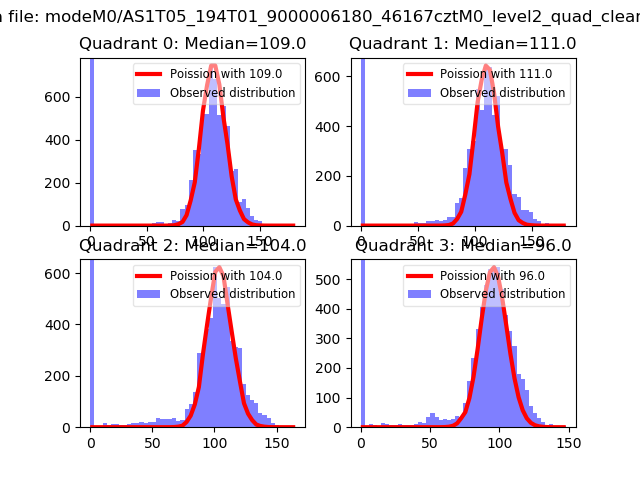 |
 |
| Quadrant-wise count rates Data is divided into 100 sec bins |
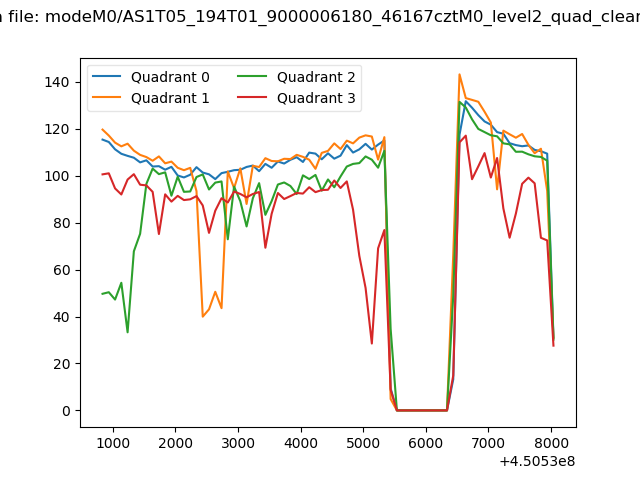 |
|
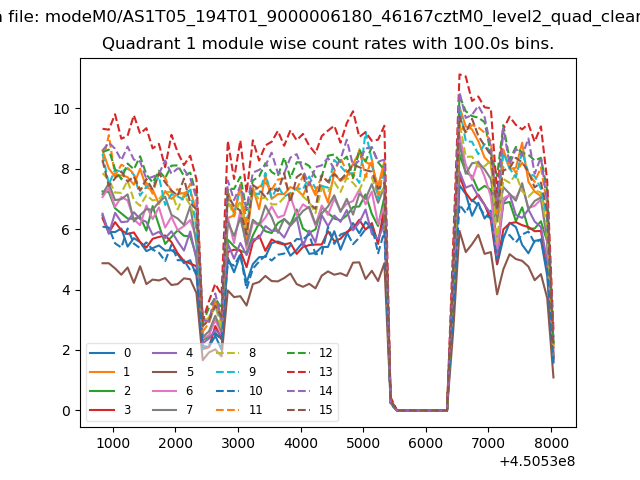
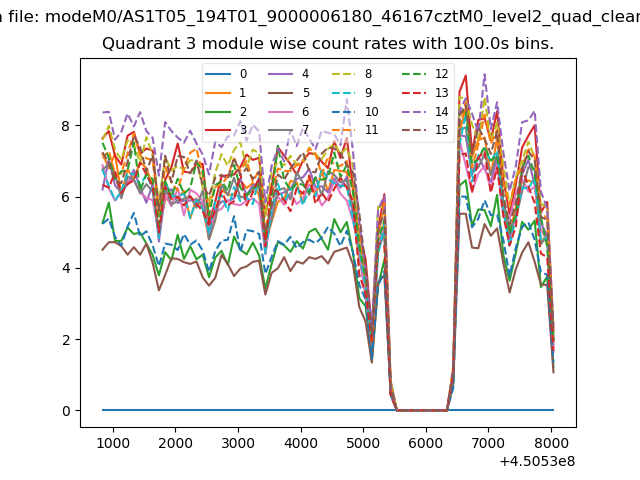
| Module-wise count rates for Quadrant A Data is divided into 100 sec bins |
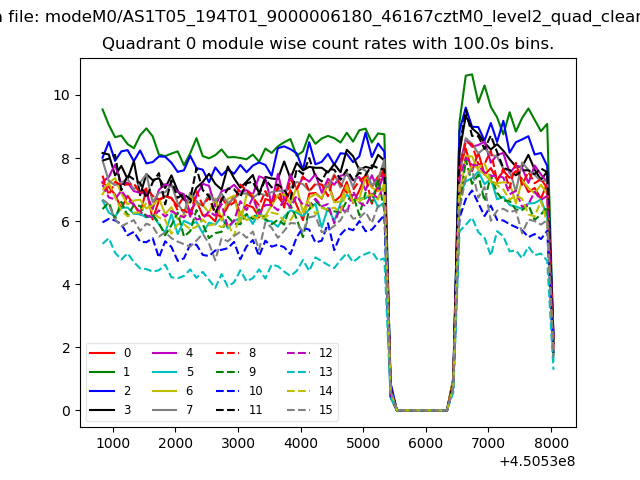 |
 |
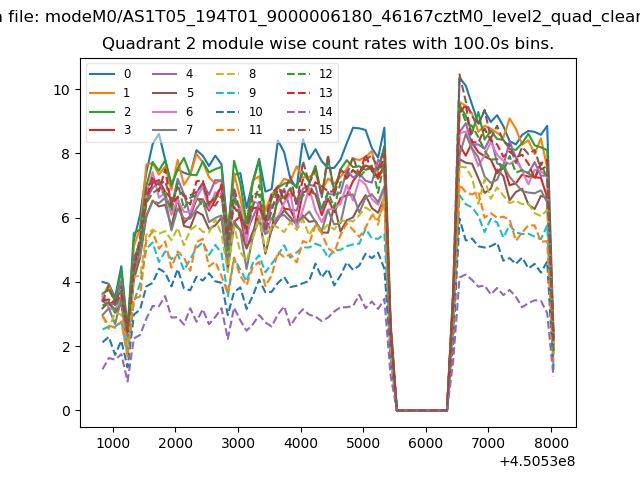
| Module-wise count rates for Quadrant B Data is divided into 100 sec bins |
 |
 |
| Module-wise count rates for Quadrant C Data is divided into 100 sec bins |
 |
 |
| Module-wise count rates for Quadrant D Data is divided into 100 sec bins |
 |
 |
| Parameter | Plot |
|---|---|
| CZT HV Monitor | 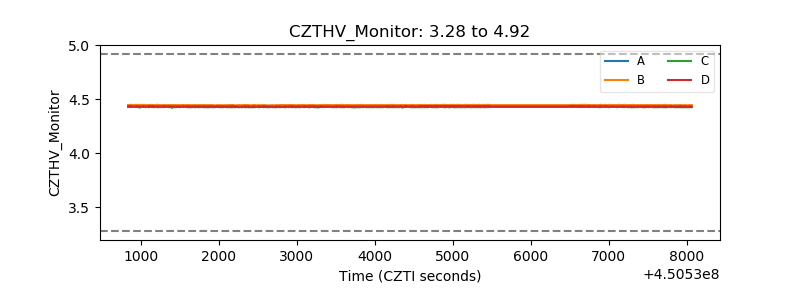 |
| D_VDD | 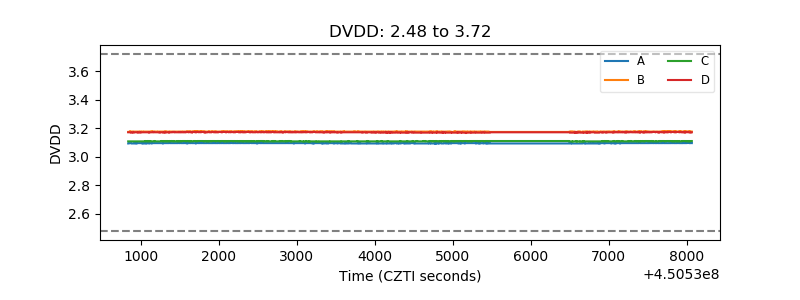 |
| Temperature 1 | 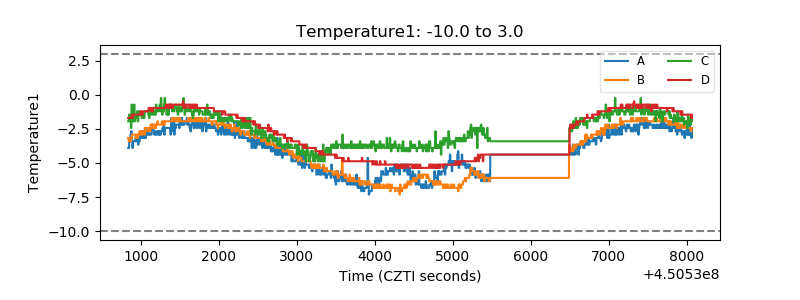 |
| Veto HV Monitor | 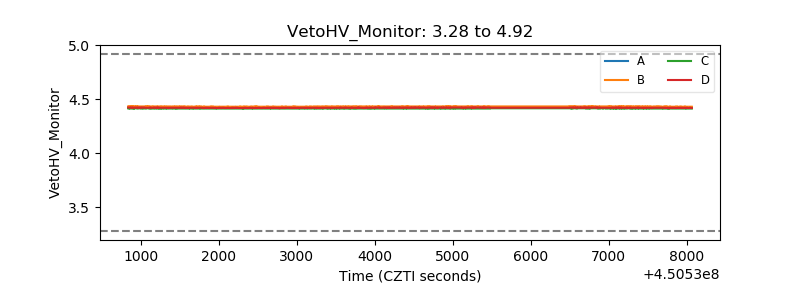 |
| Veto LLD | 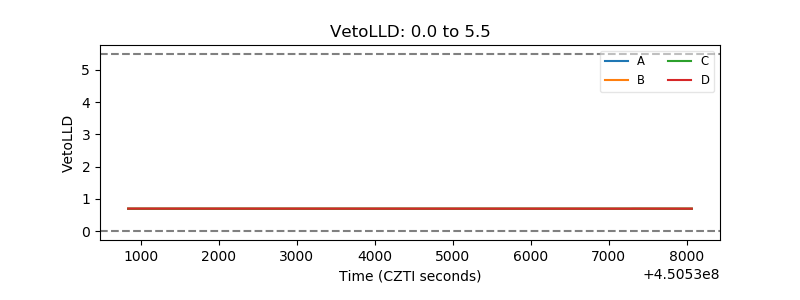 |
| Alpha Counter | 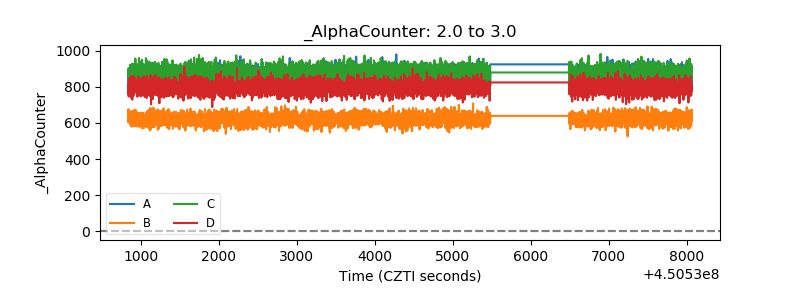 |
| _CPM_Rate | 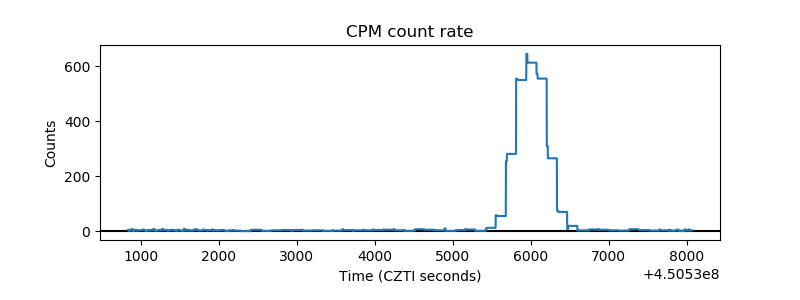 |
| CZT Counter | 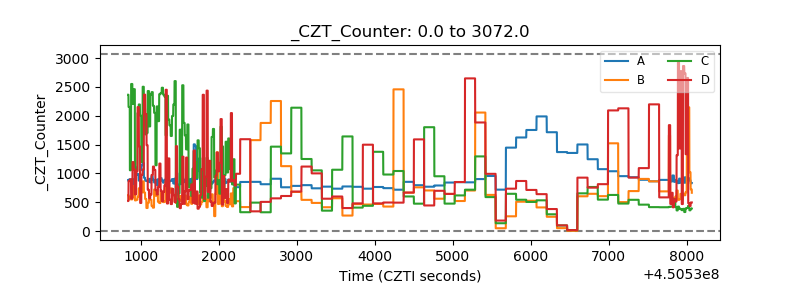 |
| +2.5 Volts monitor | 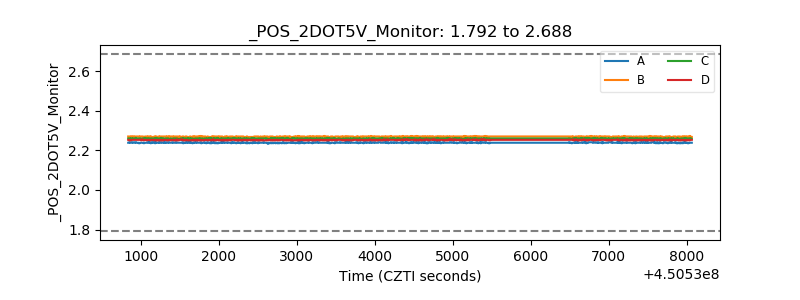 |
| +5 Volts monitor | 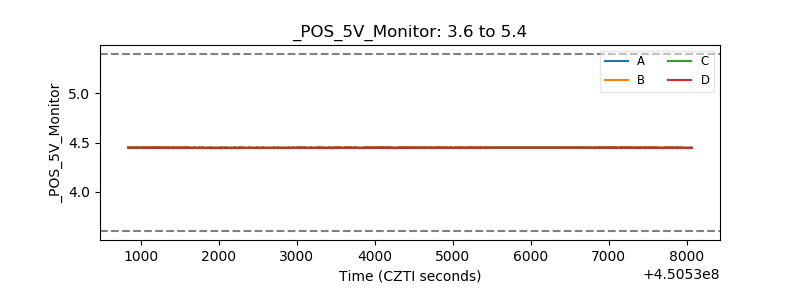 |
| _ROLL_ROT | 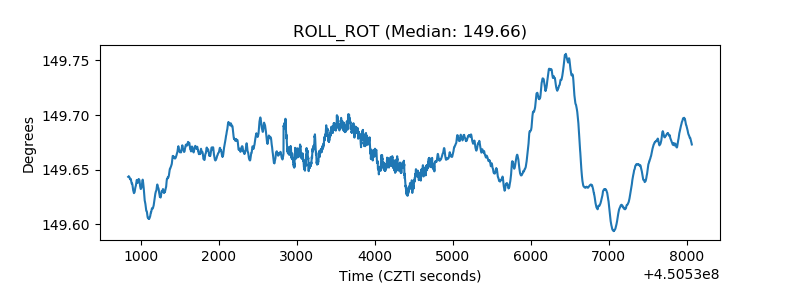 |
| _Roll_DEC | 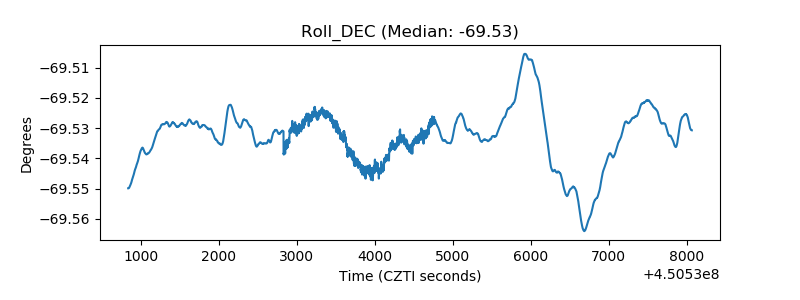 |
| _Roll_RA |  |
| Veto Counter | 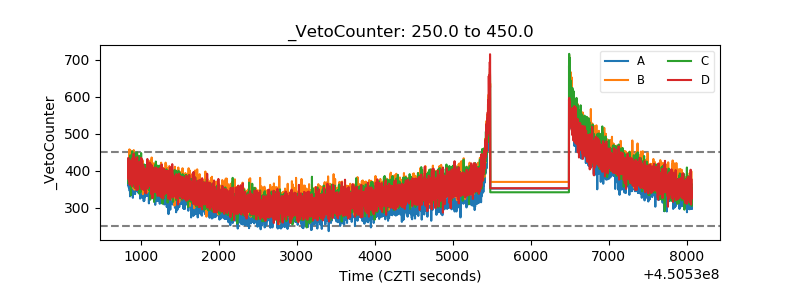 |