| Param | Original file | Final file |
|---|---|---|
| Filename | modeM0/AS1A13_093T40_9000006182_46204cztM0_level2.fits | modeM0/AS1A13_093T40_9000006182_46204cztM0_level2_quad_clean.evt |
| Size (bytes) | 558,803,520 | 121,455,360 |
| Size | 532.9 MB | 115.8 MB |
| Events in quadrant A | 6,752,528 | 818,634 |
| Events in quadrant B | 3,911,729 | 848,284 |
| Events in quadrant C | 3,685,341 | 790,663 |
| Events in quadrant D | 5,740,328 | 685,885 |
| Mode SS | |||
|---|---|---|---|
| Quadrant | BADHDUFLAG | Total packets | Discarded packets |
| A | 0 | 154 | 0 |
| B | 0 | 154 | 0 |
| C | 0 | 154 | 0 |
| D | 0 | 154 | 0 |
| Mode M0 | |||
|---|---|---|---|
| Quadrant | BADHDUFLAG | Total packets | Discarded packets |
| A | 0 | 25040 | 1 |
| B | 0 | 16531 | 0 |
| C | 0 | 16726 | 0 |
| D | 0 | 22381 | 0 |
| Quadrant | Total seconds | Saturated seconds | Saturation percentage |
|---|---|---|---|
| A | 7675 | 211 | 2.749186% |
| B | 7676 | 48 | 0.625326% |
| C | 7676 | 84 | 1.094320% |
| D | 7676 | 566 | 7.373632% |
Noise dominated data is calculated using 1-second bins in cleaned event files. If a bin has >2000 counts, and if more than 50% of those come from <1% of pixels, then it is considered to be noise-dominated and hence unusable.
| Quadrant | # 1 sec bins | Bins with >0 counts | Bins with >2000 counts | High rate bins dominated by noise | Noise dominated (total time) | Noise dominated (detector-on time) | Marked lightcurve |
|---|---|---|---|---|---|---|---|
| A | 7675 | 7675 | 125 | 125 | 1.63% | 1.63% |  |
| B | 7676 | 7676 | 8 | 8 | 0.10% | 0.10% |  |
| C | 7676 | 7676 | 49 | 49 | 0.64% | 0.64% |  |
| D | 7676 | 7676 | 533 | 533 | 6.94% | 6.94% |  |
Top three noisy pixels from each quadrant. If the there are fewer than three noisy pixels in the level2.evt file, extra rows are filled as -1
| Pixel properties | Quadrant properties | ||||||
|---|---|---|---|---|---|---|---|
| Quadrant | DetID | PixID | Counts | Sigma | Mean | Median | Sigma |
| A | 10 | 83 | 3097191 | 17723.19 | 836 | 818 | 174.7 |
| A | 0 | 247 | 262393 | 1497.22 | 836 | 818 | 174.7 |
| A | 13 | 248 | 122422 | 696.04 | 836 | 818 | 174.7 |
| B | 3 | 112 | 424996 | 2577.08 | 839 | 813 | 164.6 |
| B | 5 | 173 | 103891 | 626.24 | 839 | 813 | 164.6 |
| B | 5 | 172 | 35185 | 208.82 | 839 | 813 | 164.6 |
| C | 14 | 254 | 426377 | 2219.48 | 818 | 820 | 191.7 |
| C | 12 | 2 | 62444 | 321.4 | 818 | 820 | 191.7 |
| C | 13 | 61 | 5456 | 24.18 | 818 | 820 | 191.7 |
| D | 13 | 249 | 1271355 | 6523.29 | 789 | 766 | 194.8 |
| D | 1 | 52 | 880693 | 4517.6 | 789 | 766 | 194.8 |
| D | 2 | 249 | 404952 | 2075.12 | 789 | 766 | 194.8 |
Histogram calculated using DETX and DETY for each event in the final _common_clean file
| Quadrant A |  |
 |
Quadrant B |
|---|---|---|---|
| Quadrant D |  |
 |
Quadrant C |
| Plot type | Count rate plots | Images |
|---|---|---|
| Comparison with Poisson distribution Blue bars denote a histogram of data divided into 1 sec bins. Red curve is a Poisson curve with rate = median count rate of data. |
 |
 |
| Quadrant-wise count rates Data is divided into 100 sec bins |
 |
|
| Module-wise count rates for Quadrant A Data is divided into 100 sec bins |
 |
 |
| Module-wise count rates for Quadrant B Data is divided into 100 sec bins |
 |
 |
| Module-wise count rates for Quadrant C Data is divided into 100 sec bins |
 |
 |
| Module-wise count rates for Quadrant D Data is divided into 100 sec bins |
 |
 |
| Parameter | Plot |
|---|---|
| CZT HV Monitor |  |
| D_VDD |  |
| Temperature 1 |  |
| Veto HV Monitor |  |
| Veto LLD |  |
| Alpha Counter |  |
| _CPM_Rate |  |
| CZT Counter |  |
| +2.5 Volts monitor | 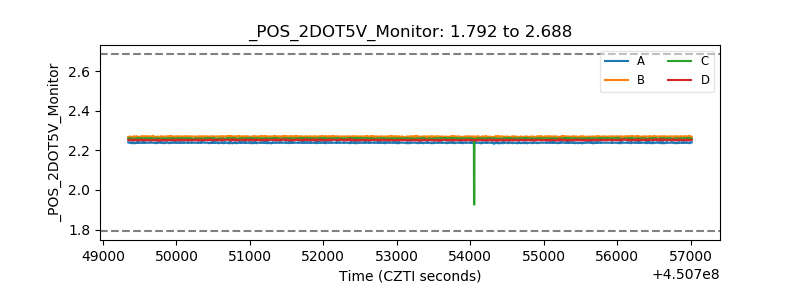 |
| +5 Volts monitor | 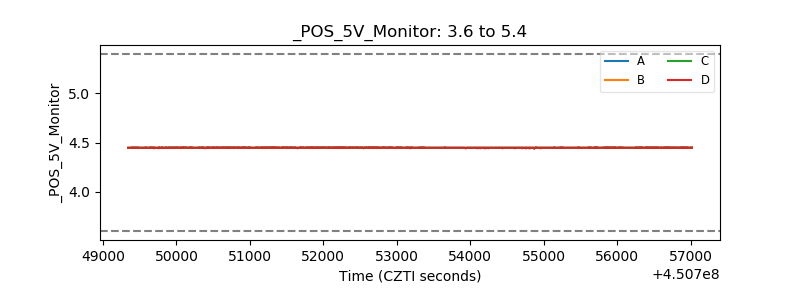 |
| _ROLL_ROT |  |
| _Roll_DEC |  |
| _Roll_RA |  |
| Veto Counter |  |