| Param | Original file | Final file |
|---|---|---|
| Filename | modeM0/AS1A13_065T07_9000006188_46232cztM0_level2.fits | modeM0/AS1A13_065T07_9000006188_46232cztM0_level2_quad_clean.evt |
| Size (bytes) | 581,126,400 | 123,808,320 |
| Size | 554.2 MB | 118.1 MB |
| Events in quadrant A | 6,861,576 | 814,203 |
| Events in quadrant B | 4,500,713 | 847,044 |
| Events in quadrant C | 3,815,101 | 823,206 |
| Events in quadrant D | 5,730,707 | 722,456 |
| Mode M0 | |||
|---|---|---|---|
| Quadrant | BADHDUFLAG | Total packets | Discarded packets |
| A | 0 | 25322 | 3 |
| B | 0 | 18625 | 3 |
| C | 0 | 17131 | 3 |
| D | 0 | 22559 | 3 |
| Mode SS | |||
|---|---|---|---|
| Quadrant | BADHDUFLAG | Total packets | Discarded packets |
| A | 0 | 158 | 0 |
| B | 0 | 158 | 0 |
| C | 0 | 158 | 0 |
| D | 0 | 158 | 0 |
| Quadrant | Total seconds | Saturated seconds | Saturation percentage |
|---|---|---|---|
| A | 7781 | 319 | 4.099730% |
| B | 7781 | 215 | 2.763141% |
| C | 7782 | 83 | 1.066564% |
| D | 7782 | 503 | 6.463634% |
Noise dominated data is calculated using 1-second bins in cleaned event files. If a bin has >2000 counts, and if more than 50% of those come from <1% of pixels, then it is considered to be noise-dominated and hence unusable.
| Quadrant | # 1 sec bins | Bins with >0 counts | Bins with >2000 counts | High rate bins dominated by noise | Noise dominated (total time) | Noise dominated (detector-on time) | Marked lightcurve |
|---|---|---|---|---|---|---|---|
| A | 7826 | 7782 | 12 | 12 | 0.15% | 0.15% |  |
| B | 7826 | 7782 | 6 | 6 | 0.08% | 0.08% |  |
| C | 7827 | 7784 | 50 | 50 | 0.64% | 0.64% |  |
| D | 7827 | 7784 | 386 | 386 | 4.93% | 4.96% |  |
Top three noisy pixels from each quadrant. If the there are fewer than three noisy pixels in the level2.evt file, extra rows are filled as -1
| Pixel properties | Quadrant properties | ||||||
|---|---|---|---|---|---|---|---|
| Quadrant | DetID | PixID | Counts | Sigma | Mean | Median | Sigma |
| A | 10 | 83 | 3244968 | 17406.21 | 891 | 870 | 186.4 |
| A | 0 | 247 | 151334 | 807.31 | 891 | 870 | 186.4 |
| A | 0 | 226 | 15079 | 76.24 | 891 | 870 | 186.4 |
| B | 3 | 112 | 793771 | 4382.33 | 895 | 861 | 180.9 |
| B | 5 | 63 | 108855 | 596.87 | 895 | 861 | 180.9 |
| B | 12 | 111 | 23555 | 125.42 | 895 | 861 | 180.9 |
| C | 12 | 2 | 314237 | 1496.39 | 880 | 882 | 209.4 |
| C | 14 | 254 | 36582 | 170.48 | 880 | 882 | 209.4 |
| C | 1 | 3 | 21765 | 99.72 | 880 | 882 | 209.4 |
| D | 1 | 52 | 2122825 | 9661.46 | 862 | 834 | 219.6 |
| D | 2 | 249 | 112290 | 507.46 | 862 | 834 | 219.6 |
| D | 13 | 249 | 64665 | 290.62 | 862 | 834 | 219.6 |
Histogram calculated using DETX and DETY for each event in the final _common_clean file
| Quadrant A |  |
 |
Quadrant B |
|---|---|---|---|
| Quadrant D |  |
 |
Quadrant C |
| Plot type | Count rate plots | Images |
|---|---|---|
| Comparison with Poisson distribution Blue bars denote a histogram of data divided into 1 sec bins. Red curve is a Poisson curve with rate = median count rate of data. |
 |
 |
| Quadrant-wise count rates Data is divided into 100 sec bins |
 |
|
| Module-wise count rates for Quadrant A Data is divided into 100 sec bins |
 |
 |
| Module-wise count rates for Quadrant B Data is divided into 100 sec bins |
 |
 |
| Module-wise count rates for Quadrant C Data is divided into 100 sec bins |
 |
 |
| Module-wise count rates for Quadrant D Data is divided into 100 sec bins |
 |
 |
| Parameter | Plot |
|---|---|
| CZT HV Monitor |  |
| D_VDD |  |
| Temperature 1 |  |
| Veto HV Monitor |  |
| Veto LLD |  |
| Alpha Counter |  |
| _CPM_Rate |  |
| CZT Counter |  |
| +2.5 Volts monitor | 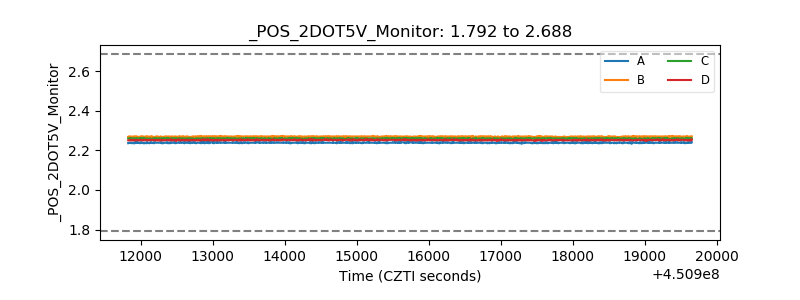 |
| +5 Volts monitor | 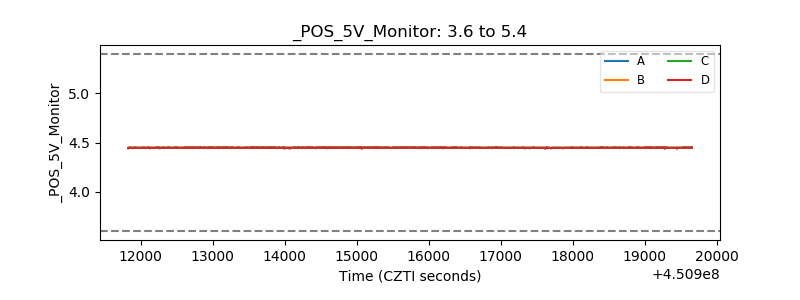 |
| _ROLL_ROT |  |
| _Roll_DEC |  |
| _Roll_RA |  |
| Veto Counter |  |