| Param | Original file | Final file |
|---|---|---|
| Filename | modeM0/AS1A13_065T07_9000006188_46233cztM0_level2.fits | modeM0/AS1A13_065T07_9000006188_46233cztM0_level2_quad_clean.evt |
| Size (bytes) | 633,070,080 | 135,838,080 |
| Size | 603.7 MB | 129.5 MB |
| Events in quadrant A | 7,398,198 | 900,453 |
| Events in quadrant B | 5,373,479 | 926,325 |
| Events in quadrant C | 4,240,299 | 896,414 |
| Events in quadrant D | 5,763,729 | 798,546 |
| Mode M0 | |||
|---|---|---|---|
| Quadrant | BADHDUFLAG | Total packets | Discarded packets |
| A | 0 | 27189 | 2 |
| B | 0 | 21730 | 2 |
| C | 0 | 18898 | 2 |
| D | 0 | 23146 | 2 |
| Mode SS | |||
|---|---|---|---|
| Quadrant | BADHDUFLAG | Total packets | Discarded packets |
| A | 0 | 172 | 0 |
| B | 0 | 172 | 0 |
| C | 0 | 172 | 0 |
| D | 0 | 172 | 0 |
| Quadrant | Total seconds | Saturated seconds | Saturation percentage |
|---|---|---|---|
| A | 8503 | 247 | 2.904857% |
| B | 8504 | 297 | 3.492474% |
| C | 8504 | 93 | 1.093603% |
| D | 8504 | 377 | 4.433208% |
Noise dominated data is calculated using 1-second bins in cleaned event files. If a bin has >2000 counts, and if more than 50% of those come from <1% of pixels, then it is considered to be noise-dominated and hence unusable.
| Quadrant | # 1 sec bins | Bins with >0 counts | Bins with >2000 counts | High rate bins dominated by noise | Noise dominated (total time) | Noise dominated (detector-on time) | Marked lightcurve |
|---|---|---|---|---|---|---|---|
| A | 8548 | 8504 | 0 | 0 | 0.00% | 0.00% |  |
| B | 8549 | 8505 | 10 | 10 | 0.12% | 0.12% |  |
| C | 8549 | 8506 | 55 | 55 | 0.64% | 0.65% |  |
| D | 8549 | 8506 | 237 | 237 | 2.77% | 2.79% |  |
Top three noisy pixels from each quadrant. If the there are fewer than three noisy pixels in the level2.evt file, extra rows are filled as -1
| Pixel properties | Quadrant properties | ||||||
|---|---|---|---|---|---|---|---|
| Quadrant | DetID | PixID | Counts | Sigma | Mean | Median | Sigma |
| A | 10 | 83 | 3400942 | 16353.92 | 991 | 968 | 207.9 |
| A | 0 | 247 | 138680 | 662.4 | 991 | 968 | 207.9 |
| A | 0 | 226 | 15196 | 68.44 | 991 | 968 | 207.9 |
| B | 3 | 112 | 1411489 | 7100.23 | 991 | 959 | 198.7 |
| B | 12 | 111 | 26385 | 127.99 | 991 | 959 | 198.7 |
| B | 11 | 111 | 24344 | 117.71 | 991 | 959 | 198.7 |
| C | 12 | 2 | 306686 | 1307.53 | 979 | 983 | 233.8 |
| C | 1 | 3 | 50323 | 211.03 | 979 | 983 | 233.8 |
| C | 14 | 254 | 36786 | 153.13 | 979 | 983 | 233.8 |
| D | 1 | 52 | 1533171 | 6251.51 | 963 | 933 | 245.1 |
| D | 13 | 171 | 184595 | 749.34 | 963 | 933 | 245.1 |
| D | 4 | 223 | 108657 | 439.51 | 963 | 933 | 245.1 |
Histogram calculated using DETX and DETY for each event in the final _common_clean file
| Quadrant A |  |
 |
Quadrant B |
|---|---|---|---|
| Quadrant D |  |
 |
Quadrant C |
| Plot type | Count rate plots | Images |
|---|---|---|
| Comparison with Poisson distribution Blue bars denote a histogram of data divided into 1 sec bins. Red curve is a Poisson curve with rate = median count rate of data. |
 |
 |
| Quadrant-wise count rates Data is divided into 100 sec bins |
 |
|
| Module-wise count rates for Quadrant A Data is divided into 100 sec bins |
 |
 |
| Module-wise count rates for Quadrant B Data is divided into 100 sec bins |
 |
 |
| Module-wise count rates for Quadrant C Data is divided into 100 sec bins |
 |
 |
| Module-wise count rates for Quadrant D Data is divided into 100 sec bins |
 |
 |
| Parameter | Plot |
|---|---|
| CZT HV Monitor |  |
| D_VDD |  |
| Temperature 1 |  |
| Veto HV Monitor |  |
| Veto LLD |  |
| Alpha Counter |  |
| _CPM_Rate |  |
| CZT Counter |  |
| +2.5 Volts monitor | 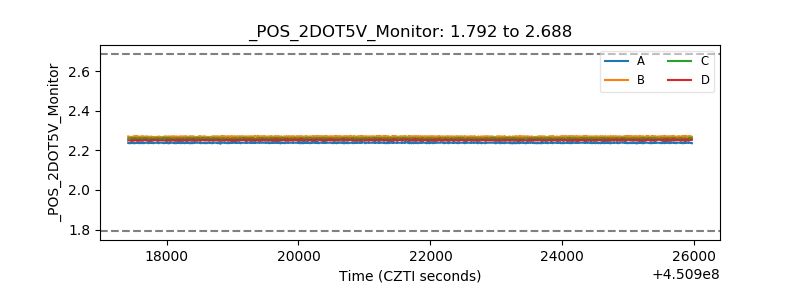 |
| +5 Volts monitor | 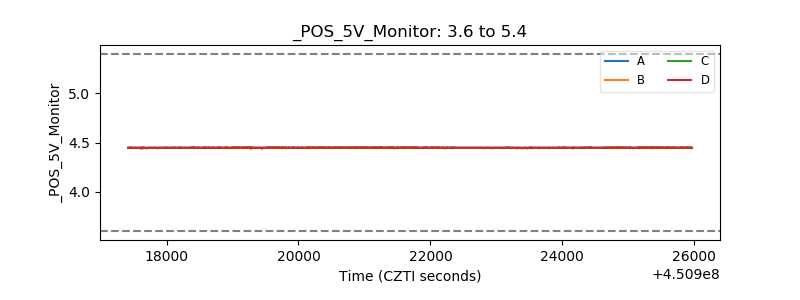 |
| _ROLL_ROT |  |
| _Roll_DEC |  |
| _Roll_RA |  |
| Veto Counter |  |