| Param | Original file | Final file |
|---|---|---|
| Filename | modeM0/AS1A13_065T07_9000006188_46243cztM0_level2.fits | modeM0/AS1A13_065T07_9000006188_46243cztM0_level2_quad_clean.evt |
| Size (bytes) | 100,719,360 | 24,615,360 |
| Size | 96.1 MB | 23.5 MB |
| Events in quadrant A | 1,306,479 | 164,771 |
| Events in quadrant B | 820,065 | 168,424 |
| Events in quadrant C | 848,089 | 154,319 |
| Events in quadrant D | 638,560 | 150,391 |
| Mode M0 | |||
|---|---|---|---|
| Quadrant | BADHDUFLAG | Total packets | Discarded packets |
| A | 0 | 4799 | 0 |
| B | 0 | 3355 | 0 |
| C | 0 | 3609 | 0 |
| D | 0 | 2980 | 0 |
| Mode SS | |||
|---|---|---|---|
| Quadrant | BADHDUFLAG | Total packets | Discarded packets |
| A | 0 | 30 | 0 |
| B | 0 | 30 | 0 |
| C | 0 | 30 | 0 |
| D | 0 | 30 | 0 |
| Quadrant | Total seconds | Saturated seconds | Saturation percentage |
|---|---|---|---|
| A | 1444 | 4 | 0.277008% |
| B | 1444 | 5 | 0.346260% |
| C | 1444 | 74 | 5.124654% |
| D | 1444 | 1 | 0.069252% |
Noise dominated data is calculated using 1-second bins in cleaned event files. If a bin has >2000 counts, and if more than 50% of those come from <1% of pixels, then it is considered to be noise-dominated and hence unusable.
| Quadrant | # 1 sec bins | Bins with >0 counts | Bins with >2000 counts | High rate bins dominated by noise | Noise dominated (total time) | Noise dominated (detector-on time) | Marked lightcurve |
|---|---|---|---|---|---|---|---|
| A | 1444 | 1444 | 1 | 1 | 0.07% | 0.07% |  |
| B | 1444 | 1444 | 5 | 5 | 0.35% | 0.35% |  |
| C | 1444 | 1444 | 80 | 80 | 5.54% | 5.54% |  |
| D | 1444 | 1444 | 3 | 3 | 0.21% | 0.21% |  |
Top three noisy pixels from each quadrant. If the there are fewer than three noisy pixels in the level2.evt file, extra rows are filled as -1
| Pixel properties | Quadrant properties | ||||||
|---|---|---|---|---|---|---|---|
| Quadrant | DetID | PixID | Counts | Sigma | Mean | Median | Sigma |
| A | 10 | 83 | 689199 | 19921.23 | 156 | 153 | 34.6 |
| A | 9 | 191 | 11216 | 319.85 | 156 | 153 | 34.6 |
| A | 13 | 254 | 2860 | 78.26 | 156 | 153 | 34.6 |
| B | 3 | 112 | 178591 | 5492.7 | 156 | 152 | 32.5 |
| B | 5 | 32 | 6546 | 196.82 | 156 | 152 | 32.5 |
| B | 5 | 172 | 5797 | 173.76 | 156 | 152 | 32.5 |
| C | 12 | 2 | 259574 | 7153.48 | 144 | 145 | 36.3 |
| C | 3 | 9 | 19545 | 534.93 | 144 | 145 | 36.3 |
| C | 1 | 3 | 3726 | 98.74 | 144 | 145 | 36.3 |
| D | 1 | 52 | 30411 | 753.11 | 151 | 146 | 40.2 |
| D | 2 | 249 | 15401 | 379.6 | 151 | 146 | 40.2 |
| D | 2 | 234 | 7859 | 191.93 | 151 | 146 | 40.2 |
Histogram calculated using DETX and DETY for each event in the final _common_clean file
| Quadrant A |  |
 |
Quadrant B |
|---|---|---|---|
| Quadrant D |  |
 |
Quadrant C |
| Plot type | Count rate plots | Images |
|---|---|---|
| Comparison with Poisson distribution Blue bars denote a histogram of data divided into 1 sec bins. Red curve is a Poisson curve with rate = median count rate of data. |
 |
 |
| Quadrant-wise count rates Data is divided into 100 sec bins |
 |
|
| Module-wise count rates for Quadrant A Data is divided into 100 sec bins |
 |
 |
| Module-wise count rates for Quadrant B Data is divided into 100 sec bins |
 |
 |
| Module-wise count rates for Quadrant C Data is divided into 100 sec bins |
 |
 |
| Module-wise count rates for Quadrant D Data is divided into 100 sec bins |
 |
 |
| Parameter | Plot |
|---|---|
| CZT HV Monitor |  |
| D_VDD |  |
| Temperature 1 |  |
| Veto HV Monitor |  |
| Veto LLD |  |
| Alpha Counter |  |
| _CPM_Rate |  |
| CZT Counter |  |
| +2.5 Volts monitor | 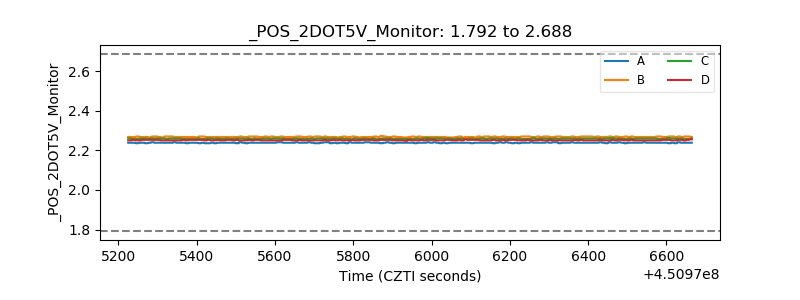 |
| +5 Volts monitor | 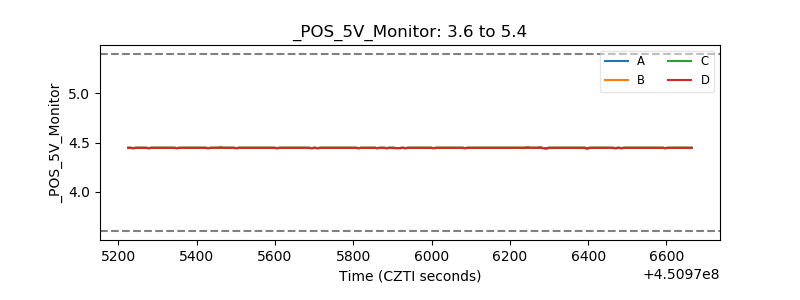 |
| _ROLL_ROT |  |
| _Roll_DEC |  |
| _Roll_RA |  |
| Veto Counter |  |